. 2014 Feb 28;9(2):e90523.
doi: 10.1371/journal.pone.0090523. eCollection 2014.

Blood platelets in the progression of Alzheimer's disease

Affiliations

Blood platelets in the progression of Alzheimer's disease

Nina S Gowert et al. PLoS One. .

Abstract

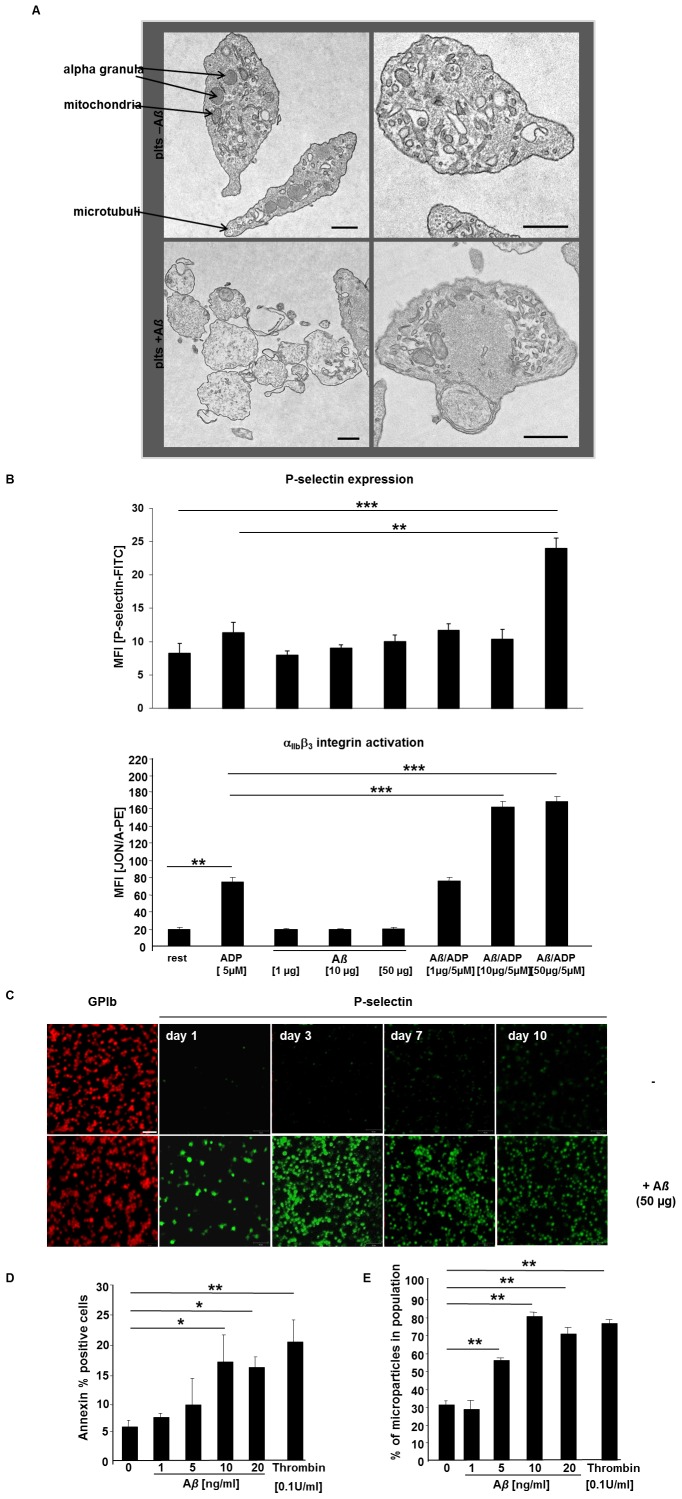
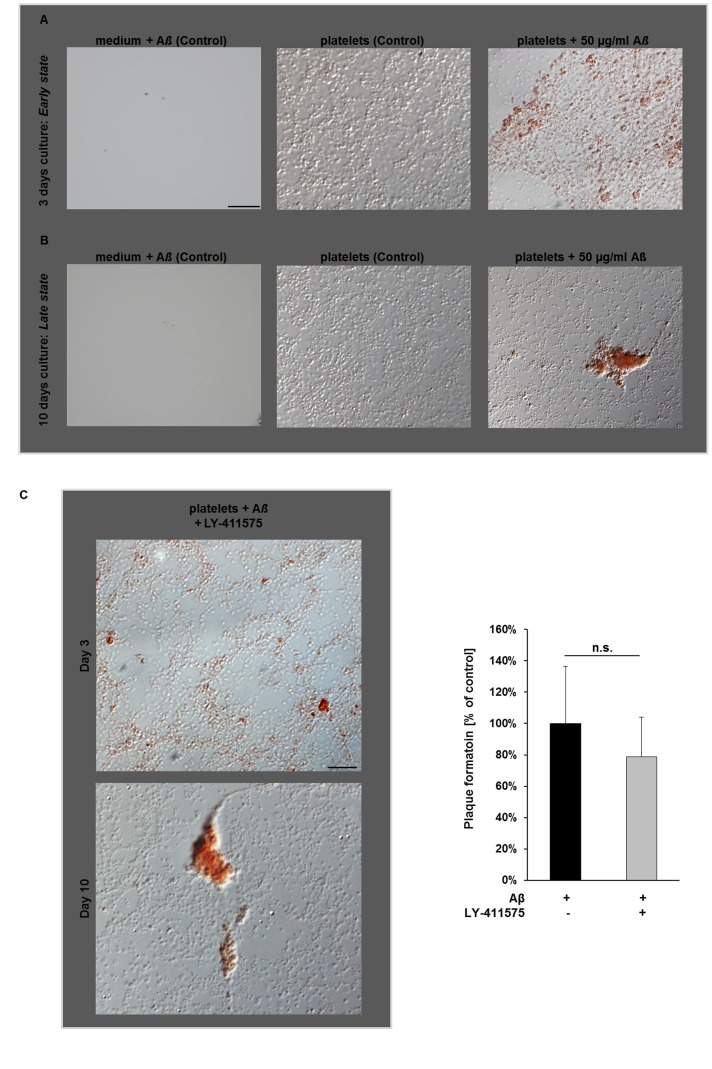
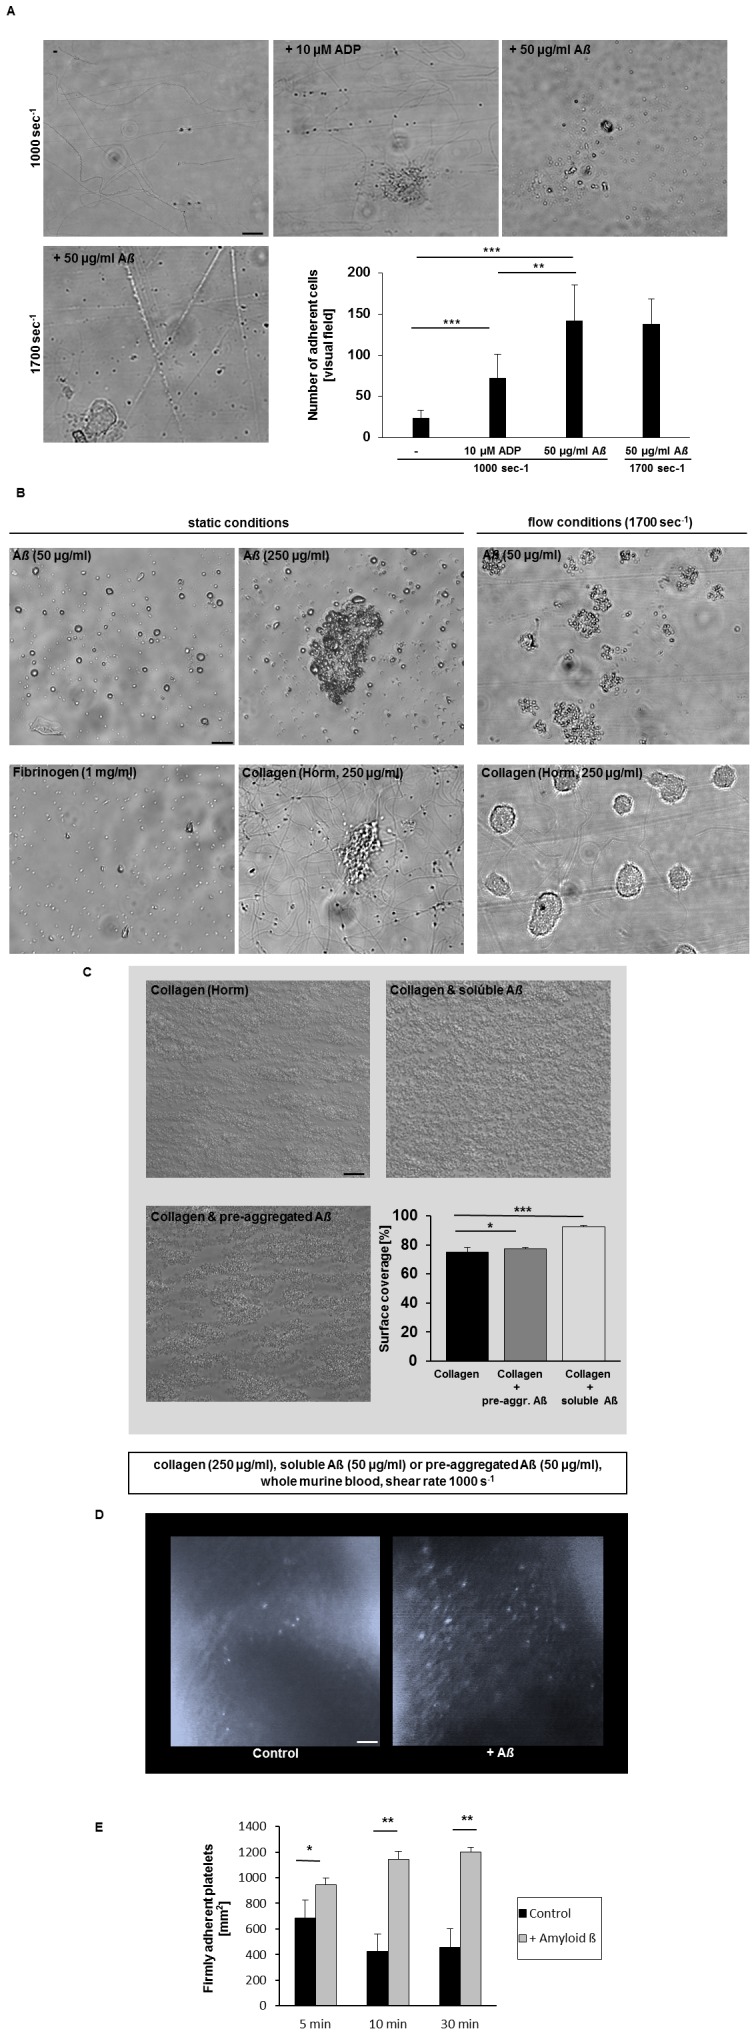
Alzheimer's disease (AD) is characterized by neurotoxic amyloid-ß plaque formation in brain parenchyma and cerebral blood vessels known as cerebral amyloid angiopathy (CAA). Besides CAA, AD is strongly related to vascular diseases such as stroke and atherosclerosis. Cerebrovascular dysfunction occurs in AD patients leading to alterations in blood flow that might play an important role in AD pathology with neuronal loss and memory deficits. Platelets are the major players in hemostasis and thrombosis, but are also involved in neuroinflammatory diseases like AD. For many years, platelets were accepted as peripheral model to study the pathophysiology of AD because platelets display the enzymatic activities to generate amyloid-ß (Aß) peptides. In addition, platelets are considered to be a biomarker for early diagnosis of AD. Effects of Aß peptides on platelets and the impact of platelets in the progression of AD remained, however, ill-defined. The present study explored the cellular mechanisms triggered by Aß in platelets. Treatment of platelets with Aß led to platelet activation and enhanced generation of reactive oxygen species (ROS) and membrane scrambling, suggesting enhanced platelet apoptosis. More important, platelets modulate soluble Aß into fibrillar structures that were absorbed by apoptotic but not vital platelets. This together with enhanced platelet adhesion under flow ex vivo and in vivo and platelet accumulation at amyloid deposits of cerebral vessels of AD transgenic mice suggested that platelets are major contributors of CAA inducing platelet thrombus formation at vascular amyloid plaques leading to vessel occlusion critical for cerebrovascular events like stroke.


Conflict of interest statement

Competing Interests: The authors have declared that no competing interests exist.

Figures

Figure 1
Figure 1. Contact of platelets with soluble Aß leads to Aß production in human platelet culture.
(A) Accumulation of Aß (1–42) in activated human platelets was measured at indicated time points by sandwich ELISA assay. Bar graphs depict mean values ±SEM (n = 4) of Aß1–42 levels in resting and Aß (50 ng/ml, left panel, 50 µg/ml right panel) stimulated platelets. (B) Aß (1–42) levels measured in supernatants of resting and Aß stimulated platelets after 1, 3, 7 and 10 days in culture. **p<0.01 and ***p<0.001 indicates statistically significant difference to values in the absence of Aß, n.s. not significant. (C) Aß (1–42) was measured in platelet lysate and supernatant after pre-treatment with the γ-secretase inhibitor LY 411575. Bar graphs depict mean values ±SEM (n = 3), *p<0.05. (D) Platelets were isolated and stimulated with 50 µg/ml Aß for indicated time points. Aß was detected by confocal microscopy using an antibody directed to Aß (6E10, Covance). (E) Electron microscopy with postembedding immunogold labeling in human platelets at 24 h in the presence of Aß. Expression of APP at the plasma membrane and in granules was evident (see arrowheads, left panel). Aß was only marginally detected at the plasma membrane (see arrowheads, right panel). Scale bar 1 µm. (F) Statistical analysis of gold-labeled APP and Aß.
Figure 2
Figure 2. Stimulation of platelets with soluble Aß leads to platelet activation.
(A) Platelets become activated by stimulation with 50 ng Aß (1–40) as shown by TEM (resting platelets upper panel, Aß stimulated platelets lower panel). Scale bar 5 µm. Intracellular organells were marked by arrows. (B) Blood was washed twice and incubated with 5 µM ADP, 1, 10 and 50 µg Aß and ADP/Aß as inidcated for 15 minutes in the presence of anti-P-selectin and JON/A-PE. Platelets were gated by their forward and side characteristics. The mean flourescence intensity (MFI) for each measurement is shown (n = 5 per group), **p<0.01 and ***p<0.001. (C) Platelets were isolated and stained for P-selectin as marker for platelet activation at indicated time points. (D) Arithmetic means ± SEM (n = 13) of the percentage of human platelets binding Annexin V Flous following a 60 min exposure to Tyrode buffer 2 mM CaCl2 in the absence (control) and presence of 1–20 ng/ml Aß. *p<0.05 and **p<0.01 indicates statistically significant difference to value in the absence of amyloid. (E) Arithmetic means ± SEM (n = 5) of the percentage microparticles from human platelets following a 60 min exposure to Tyrode buffer 2 mM CaCl2 in the absence (control) and presence of 1–20 ng/ml Aß. **p<0.01 indicates statistically significant difference to value in the absence of Aß.
Figure 3
Figure 3. Aß stimulation of platelets induces ROS generation and cell membrane scrambling.
(A) Generation of ROS from platelets is reported as mean fluorescence intensity (MFI) of DCF. Bar graphs depict mean values ±SEM (n = 5), *p<0.05 and ***p<0.001. TRAP stimulation of platelets was used as positive control. (B) Bar graphs depict mean values ±SEM (n = 13) of the percentage of human platelets expressing active caspase-3 following a 60 min exposure to Tyrode buffer (pH 7.4) 2 mM CaCl2 in the absence and presence of Aß (1–42) (1–20 ng/ml). ). *p<0.05 and ***p<0.001 indicates statistically significant difference to value in the absence of Aß. (C) Aß stimulated platelets were stained for caspase-3 at indicated time points and compared to non-stimulated platelets. (D). Bar graphs depict mean values ±SEM (n = 6) of the cell volume shrinkage in human platelets following a 60 min exposure to Tyrode buffer including 2 mM CaCl2 in the absence (control) and presence of 1–20 ng/ml Aß. *p<0.05 indicates statistically significant difference to value in the absence of amyloid. (E) Bar graphs depict mean values ± SEM (n = 7) of Fluo3AM fluorescence in FACS analysis reflecting calcium mobilization of platelets following a 60 min exposure to Tyrode buffer 2 mM CaCl2 in the absence and presence of Aß (1–20 ng/ml). *p<0.05 indicates statistically significant difference compared to control. (F) Bar graphs depict mean values ±SEM (n = 5) of DiOC6 fluorescence in FACS analysis reflecting mitochondrial membrane potential of platelets following a 60 min exposure to Tyrode buffer in the absence (control) and presence of Aß (1–20 ng/ml). **p<0.01 indicates statistically significant decrease in mitochondrial membrane potential (one-way ANOVA). (G) Bar graphs depict mean values ±SEM (n = 5, left panel) of the percentage of human platelets binding Annexin V-Fluos after pre-treatment with caspase inhibitor 1 µM zVAD-FMK (zVAD) followed by a 60 min. exposure with 20 ng/ml Aß in the presence of 2 mM CaCl2 and in the nominal absence of Ca2+ and presence of EGTA, **p<0.01 indicates statistically significant difference to the control in the absence of Aß, *p<0.05 indicates statistically significant difference to results with 20 ng/ml Aß alone in the absence of any pre-treatment. Bar graphs depict mean values ±SEM (n = 5, right panel) of the percentage of human platelets expressing caspase-3 after a 60 min exposure to 20 ng/ml Aß in the presence of 2 mM CaCl2 and in the nominal absence of Ca2+ and presence of EGTA, **p<0.01 indicates statistically significant difference to control experiments in the absence of Aß, ***p<0.001 indicates statistically significant difference to results with 20 ng/ml Aß alone in the absence of any pre-treatment. Ic = isotype control.
Figure 4
Figure 4. Formation of Aß deposits in human platelet cell culture.
Congo red-positive platelets and Aß deposits in platelet cell culture after stimulation with 50 µg/ml Aß (A) after 3 days (early state, upper panel) and (B) after 10 days (late state, lower panel). Note the increase in extracellular Aß deposits after 10 days. Scale bar 20 µm. (C) Congo red-positive Aß aggregates are formed in the presence and absence of the APP inhibitor LY-411575 at indicated time points. Representative images (left) and bar graphs (right) are shown that depict mean values ±SEM (n = 6), n.s. = not significant. Scale bar 20 µm.
Figure 5
Figure 5. Incorporation of synthetic Aß fibrils by platelets.
(A) Viable platelets do not absorb synthetic Aß fibrils. Different platelet concentrations were incubated with 0.5 µM pre-aggregated FAM-labeled Aß and fluorecsence intensity was measured (upper panel). 10 µM Cytochalasin D (Cyt D) was used as inhibitor of phagocytosis. THP-1 cells served as positive control. Presence of platelets was controlled by DiOC6 labeling (100 nM, lower left panel) and by phase contrast microscopy (lower right panel). N = 6; *p<0.05, **p<0.01 and ***p<0.001; n.s. = not significant. (B) Synthetic Aß was found on the plasma membrane of vital platelets as detected by confocal microscopy. FAM-Aß (green), platelet specific marker GPIb (red). Scale bar 20 µm. (C) Apoptotic platelets are able to incorporate pre-aggregated FAM-labeled Aß. Platelets were pre-treated with 1 and 5 µM ABT-737 to induce apoptosis. Fluorescence intensity of FAM-Aß was measured as indicated. Bar graphs depict mean values ±SEM (n = 6), *p<0.05, **p<0.01.
Figure 6
Figure 6. Strongly enhanced platelet adhesion under flow conditions ex vivo and on the injured carotid artery upon Aß stimulation of platelets in vivo.
(A) Representative phase contrast images show platelet adhesion on collagen under flow conditions at a shear rate of 1000 sec−1 (upper panel) and 1700 sec−1 (lower panel) are shown. Scale bar indicates 20 µm. Bar graphs depict mean values ±SEM of the number of adherent cells per visual field [212×229 µm]. The platelet agonist ADP served as positive control, (n = 5 per group), **p<0.01 and ***p<0.001. (B) Platelets adhere to immobilized Aß under static and flow conditions (shear rate 1700 sec−1). Coverslips coated with 250 µg/ml collagen and 1 mg/ml fibrinogen served as positive control. Representative phase contrast images are shown. (C) Representative images show platelet thrombus formation on collagen and on collagen/Aß, respectively, at a shear rate of 1000 sec−1. Scale bar indicates 20 µm. Bar graphs depict mean values ±SEM of surface coverage, n = 5 per group, *p<0.05 and ***p<0.001. (D) Platelet adhesion at the injured carotid artery 10 min after injury. DCF-labeled platelets of C57BL/6J mice were incubated with vehicle or 50 µg/ml Aß for 30 min and injected into a C57BL/6J recipient mouse. Scale bar 50 µm. (E) Bar graphs depict mean values ±SEM showing the number of firmly adherent platelets at the vessel wall per mm2 after 5, 10 and 30 min after injury of seven independent experiments. *p<0.05, **p<0.01.
Figure 7
Figure 7. Recruitment of platelets to vascular amyloid-ß deposits in brain of APP Dutch and APP23 transgenic mice.
(A) Platelet adhesion to vascular Aß plaques in cerebral vessels of both, APP23 (upper, middle panel) and APP Dutch (upper, right panel) transgenic mice was analyzed by confocal microscopy. Brains were immunohistochemically analyzed for Aß deposition (6E10, red) and the presence of platelets using the platelet specific marker GPIb (green). (B) Sustained platelet recruitment to vascular amyloid-ß deposits leads to full occlusion of the vessel (lower panel). Overlay of Aß immunoreactivity (red) and GPIb (green) is shown in yellow (merge), staining of cell nuclei (blue), scale bar 20 µm.

References

    1. Langer F, Eisele YS, Fritschi SK, Staufenbiel M, Walker LC, et al. (2011) Soluble Abeta seeds are potent inducers of cerebral beta-amyloid deposition. J Neurosci 31: 14488–14495. - PMC - PubMed
    1. Catricala S, Torti M, Ricevuti G (2012) Alzheimer disease and platelets: how’s that relevant. Immun Ageing 9: 20. - PMC - PubMed
    1. Thal DR, Griffin WS, de Vos RA, Ghebremedhin E (2008) Cerebral amyloid angiopathy and its relationship to Alzheimer’s disease. Acta Neuropathol 115: 599–609. - PubMed
    1. Honig LS, Tang MX, Albert S, Costa R, Luchsinger J, et al. (2003) Stroke and the risk of Alzheimer disease. Arch Neurol 60: 1707–1712. - PubMed
    1. Mielke MM, Rosenberg PB, Tschanz J, Cook L, Corcoran C, et al. (2007) Vascular factors predict rate of progression in Alzheimer disease. Neurology 69: 1850–1858. - PubMed

Publication types

MeSH terms