. 2014 Feb 28;9(2):e90593.
doi: 10.1371/journal.pone.0090593. eCollection 2014.

Plasticity in the macromolecular-scale causal networks of cell migration

Affiliations

Plasticity in the macromolecular-scale causal networks of cell migration

John G Lock et al. PLoS One. .

Abstract

Heterogeneous and dynamic single cell migration behaviours arise from a complex multi-scale signalling network comprising both molecular components and macromolecular modules, among which cell-matrix adhesions and F-actin directly mediate migration. To date, the global wiring architecture characterizing this network remains poorly defined. It is also unclear whether such a wiring pattern may be stable and generalizable to different conditions, or plastic and context dependent. Here, synchronous imaging-based quantification of migration system organization, represented by 87 morphological and dynamic macromolecular module features, and migration system behaviour, i.e., migration speed, facilitated Granger causality analysis. We thereby leveraged natural cellular heterogeneity to begin mapping the directionally specific causal wiring between organizational and behavioural features of the cell migration system. This represents an important advance on commonly used correlative analyses that do not resolve causal directionality. We identified organizational features such as adhesion stability and adhesion F-actin content that, as anticipated, causally influenced cell migration speed. Strikingly, we also found that cell speed can exert causal influence over organizational features, including cell shape and adhesion complex location, thus revealing causality in directions contradictory to previous expectations. Importantly, by comparing unperturbed and signalling-modulated cells, we provide proof-of-principle that causal interaction patterns are in fact plastic and context dependent, rather than stable and generalizable.


Conflict of interest statement

Competing Interests: The authors have declared that no competing interests exist.

Figures

Figure 1
Figure 1. Rationale for a coarse-grained analysis of causal influence in the cell migration system.
Cell migration emerges from biological properties encompassing multiple scales (A–C). At the molecular scale, thousands of distinct components and their interactions produce a complex and modular molecular network comprising the cell migration system (A). At the macromolecular scale, this network gives rise to a variety of functional macromolecular modules (B), which collectively produce single cell migration at the cellular scale (C). Unfortunately, it is not yet possible to synchronously record the state of the molecular network underlying cell migration with spatiotemporal resolution (D). Instead, we coarse-grain (orange arrow from A to B) this molecular complexity by focusing our analysis at the scale of macromolecular modules. Specifically, we focus on CMACs and the F-actin cytoskeleton (green ovals in B) because these core modules directly mediate the process of cell migration. Their observable features exemplify the state of both: i) their own molecular components (green box in A), and; ii) extrinsic sources of regulation distributed throughout the broader molecular network from which they integrate information (black arrows in A). This information is functionalized through adaptive changes in the organization of these core macromolecular modules and at the cellular-scale, leading to associated changes in migratory behaviour. Through imaging and quantitative analysis of individual migrating cells expressing EGFP-Paxillin and RubyRed-LifeAct (markers for CMAC and F-actin modules, respectively), we extract 88 quantitative features defining organizational (E) and behavioural features (F) of the cell migration system (see Supporting Tables S1 and S2 for feature descriptions). Briefly, organizational features include those describing core macromolecular module status (lime-green boxes in E, e.g. CMAC area, CMAC lifetime, RubyRed-LifeAct intensity within CMACs, etc) and cellular-scale morphological features (pink boxes in E, e.g. cell perimeter, cell compactness (roundness), number of CMACs per cell), while behavioral features addressed in this study relate exclusively to cell migration speed (F). Finally, Granger causality analysis enables causal influence mapping to define the nature and direction of causal information flow between pairs of these coarse-grained features of the cell migration system (G).
Figure 2
Figure 2. Imaging, segmentation and tracking of migrating cells and their CMACs.
Confocal imaging of EGFP-Paxillin (A) and RubyRed-LifeAct (B) was performed simultaneously for 8 h at 5 min intervals (Supporting Movie S1 [left]). EGFP-Paxillin (C) and RubyRed-LifeAct (D) images were processed by median filtering and background correction. RubyRed-LifeAct signal was used for automated cell segmentation (dark blue outline in E–H). CMACs were segmented based on EGFP-Paxillin signals (red outlines in E, Supporting Movie S1 [center], and enlarged in F from white box in E). The RubyRed-LifeAct channel is shown overlayed by the EGFP-Paxillin-segmentation profile from E (G and enlarged in H from white box in G). Cells and CMACs were tracked via nearest neighbor analysis. CMAC tracking clearly differentiates stationary adhesions (I, enlarged in J from cell front (white box) in I) from sliding adhesions (I, enlarged in K from cell rear (yellow box) in I) (CMAC trajectories color coded for time, ≤10 time points shown, Supporting Movie S1 [right]). (L) Cell displacement over several hours (images from three time points, 0 h:20 min, 3 h:10 min, 5 h:50 min overlayed as red, green, blue, respectively). Quantitative variables describing cell and CMAC features/dynamics were automatically extracted (88 Single Cell Scale variables, Supporting Table S1, 29 variables defining individual CMACs, Supporting Table S2). Scale bars: A–K = 10 µm; L = 20 µm.
Figure 3
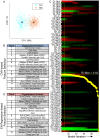
Figure 3. Selection of organizational features associated with Instantaneous Cell Speed (ICS).
(A) Comparative CVA clustering of the slowest (S1, 1–20%, blue) and fastest (S5, 81–100%, red) moving Instantaneous Cell Speed (ICS)-defined cell subpopulations using all organizational variables achieves strong separation along the 1st canonical vector (X-axis, captures 99% of total variation). (B) Organizational features driving separation of subpopulations selected by rank ordering according to absolute coefficient values associated with each feature in the 1st canonical vector. (C) 81 normalized organizational features (background variables, Y-axis, compact feature names defined in Supporting Table S1) contribute to EN-regression modeling of ICS (behavioral feature, response variable) for the entire control cell population. Horizontal color bars indicate coefficient values (−1<x<1) (green = negative, red = positive, black = near zero) associated with each variable at any iteration (X-axis) of the modeling process. Red and green variables are positively or negatively correlated with ICS, respectively, while absolute coefficient values indicate the importance of each variable to the estimation of ICS per model iteration. With progressive model iterations, the sum of all coefficient values is forced non-uniformly towards zero, with coefficients redistributed to optimize the regression model according to adjusted R2. (D) Rank ordering of background variables based on their absolute coefficient values in the optimal regression model (adjusted R2 = 0.43, horizontal yellow line, iteration 10, vertical yellow line) provides a second list of organizational features associated with variations in ICS. Variables with grey backgrounds were implicated among the top 15 features by both feature selection methods (B and D).
Figure 4
Figure 4. Exploration of individual feature correlations.
(A) A heat map of Spearman’s rank correlation coefficients (rs) summarizes the pairwise correlative relationships between all 88 recorded variables (organizational and behavioral, compact feature names defined in Supporting Table S1) based on ranked observation values (blue = negative rs; red = positive rs; green = rs ∼ 0). (B–G) Selected correlations to ICS (indicated in heat map by lines (B)–(G), corresponding to panels B–G) plotted as ranked values of ICS (X-axes) vs ranked values of organizational features (Y-axes): Cell Area (B); Cell Compactness (C); Mean [CMAC Lifetime] per Cell (D); Sum [CMAC Total RubyRed-LifeAct Intensity] per Cell (E); Median [EGFP-Paxillin – RubyRed-LifeAct Colocalization per CMAC] per Cell (F); Median [CMAC Area] per Cell (G). Red dotted trend lines represent linear best fits.
Figure 5
Figure 5. Mapping of directed causal influence based on Granger causality.
(A and B) 3D surface plots of adjusted R2 values (Y-axes) based on auto-regression (AR) modeling of the response variable, Instantaneous Cell Speed (ICS), using combinations of one to ten temporal lags (5 min interval) of the response variable (ICS, Z-axes) and one to ten temporal lags of a background variable, either Sum [CMAC Total RubyRed-LifeAct Intensity] per Cell (X-axis, A) or Mean [CMAC Lifetime] per Cell (X-axis, B). Grey arrows along X and Z axes indicate the inclusion of additional temporal lags of the indicated variable (A and B). (C–G) Significance testing of improvements in adjusted R2 values caused by the addition of temporal lags of background (X-axes) and response variables (Y-axes) to an AR model based on >2200 cell observations. White indicates no statistically significant improvement in prediction. Blue and red color schemes (indicating negative and positive correlations between background and response variables, respectively) are each divided into 4 levels of significance, with P values <0.05 (*), <0.01 (**), <0.001 (***) or <0.0001 (****), as indicated (color scale-bar, upper right). Causation is tested reciprocally within variable pairs to discern evidence for the causal influence of organizational variables over ICS (left panels, C–G) and vice versa (right panels, C–G). We infer causal influence only where significance-testing patterns are robust and ordered (as in C [left panel], D [left panel], E [left panel], G [right panel]. Stem plots (below X-axes, C–G, left and right panels) indicate the degree of autocorrelation in respective response variables.
Figure 6
Figure 6. Causal influence patterns are plastic and contextually dependent.
(A) Granger causality analysis revealed a sequence of causal interactions extending both up-stream and down-stream of Instantaneous Cell Speed (ICS): Increasing IDR [Change in CMAC Total EGFP-Paxillin intensity] per Cell (indicates per cell variation in the net rate of EGFP-Paxillin recruitment/release per CMAC) caused increased Median [EGFP-Paxillin – RubyRed-LifeAct Colocalization per CMAC] per Cell (A, left panel). Increasing Median [EGFP-Paxillin – RubyRed-LifeAct Colocalization per CMAC] per Cell caused reduced ICS (A, center panel). Increasing ICS caused increased Cell Compactness (A, right panel), indicating that fast moving cells become less round. The causal links between these four variables are summarized schematically (grey boxes), with positive and negative relationships indicated by arrows and capped lines, respectively. Analyses of Granger causality predictions for equivalent inter-feature relationships in ROCK-inhibited cells (B) reveal comparable causal relationships while Rho-activated cells did not (C). Notably, although the final causal relationship (C, right panel) was still detected, the causal effect was reversed such that increasing ICS caused decreasing Cell Compactness, i.e. increased cell speed caused cells to become more round. All variables are defined in Supporting Table S1.

Similar articles

Cited by

References

    1. Horwitz R, Webb D (2003) Cell migration. Curr Biol 13: R756–R759. - PubMed
    1. Friedl P, Wolf K (2010) Plasticity of cell migration: a multiscale tuning model. J Cell Biol 188: 11–19. - PMC - PubMed
    1. Humphries JD, Byron A, Bass MD, Craig SE, Pinney JW, et al. (2009) Proteomic analysis of integrin-associated complexes identifies RCC2 as a dual regulator of Rac1 and Arf6. Sci STKE 2: ra51. - PMC - PubMed
    1. Schiller HB, Friedel CC, Boulegue C, Fässler R (2011) Quantitative proteomics of the integrin adhesome show a myosin II-dependent recruitment of LIM domain proteins. EMBO Rep 12: 259–266. - PMC - PubMed
    1. Kuo JC, Han X, Hsiao CT, Yates IiiJR, Waterman CM (2011) Analysis of the myosin-II-responsive focal adhesion proteome reveals a role for [beta]-Pix in negative regulation of focal adhesion maturation. Nat Cell Biol 13: 383–393. - PMC - PubMed

Publication types

LinkOut - more resources