

Mapping the geographical distribution of lymphatic filariasis in Zambia
- PMID: 24587466
- PMCID: PMC3930513
- DOI: 10.1371/journal.pntd.0002714
Mapping the geographical distribution of lymphatic filariasis in Zambia
Abstract
Background: Past case reports have indicated that lymphatic filariasis (LF) occurs in Zambia, but knowledge about its geographical distribution and prevalence pattern, and the underlying potential environmental drivers, has been limited. As a background for planning and implementation of control, a country-wide mapping survey was undertaken between 2003 and 2011. Here the mapping activities are outlined, the findings across the numerous survey sites are presented, and the ecological requirements of the LF distribution are explored.
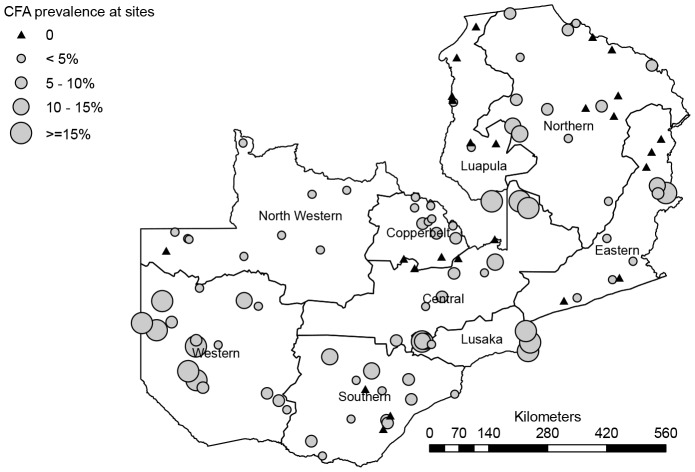
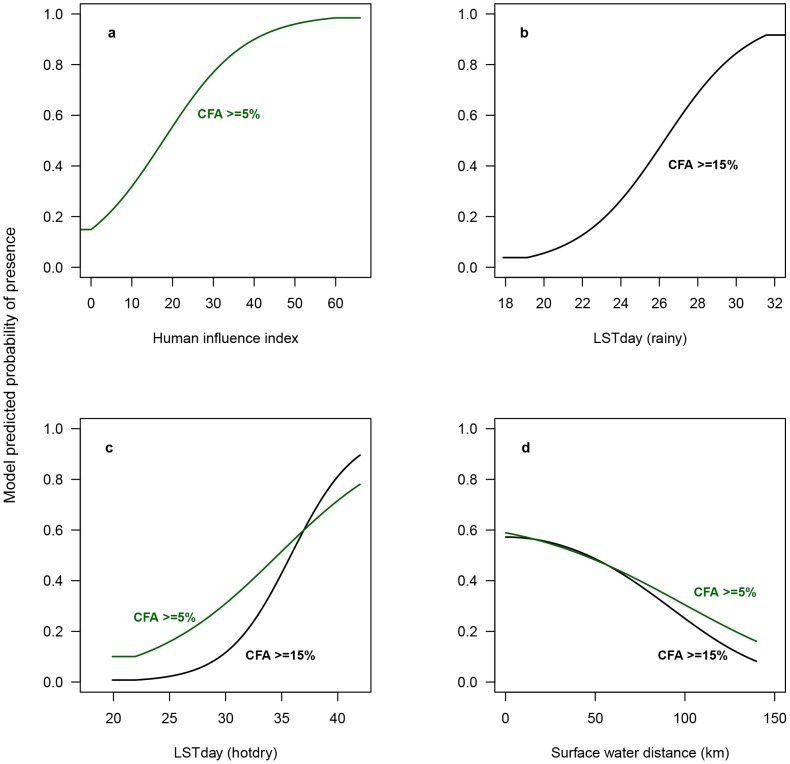
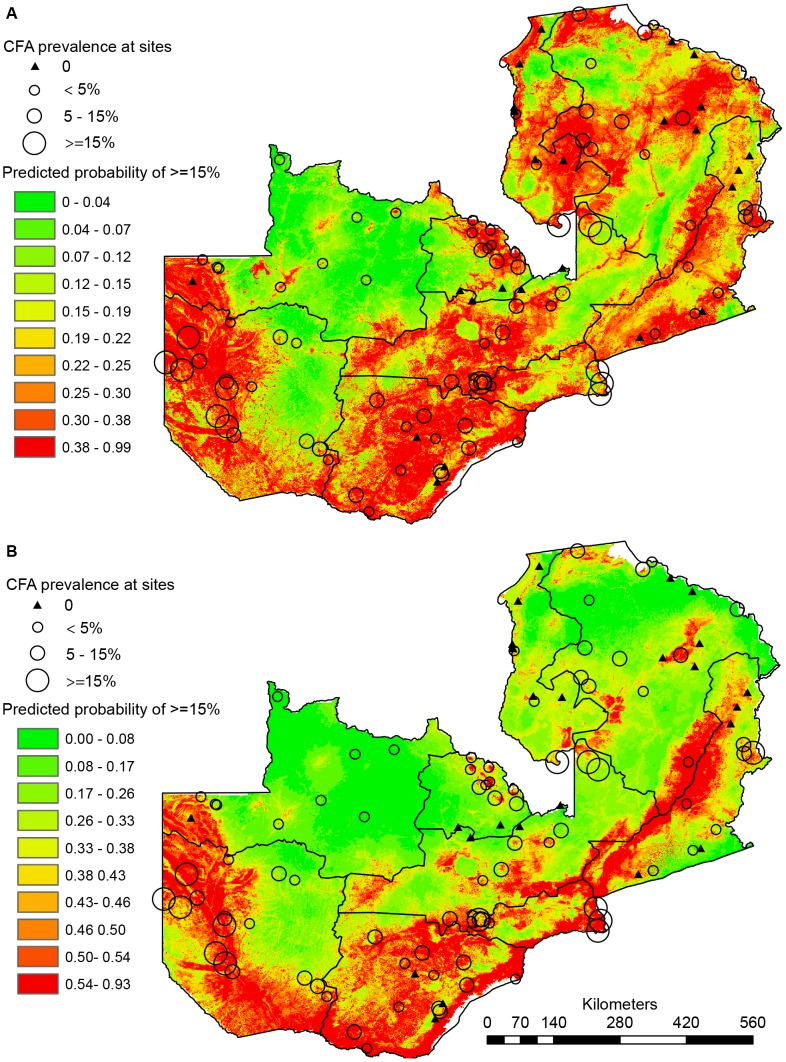
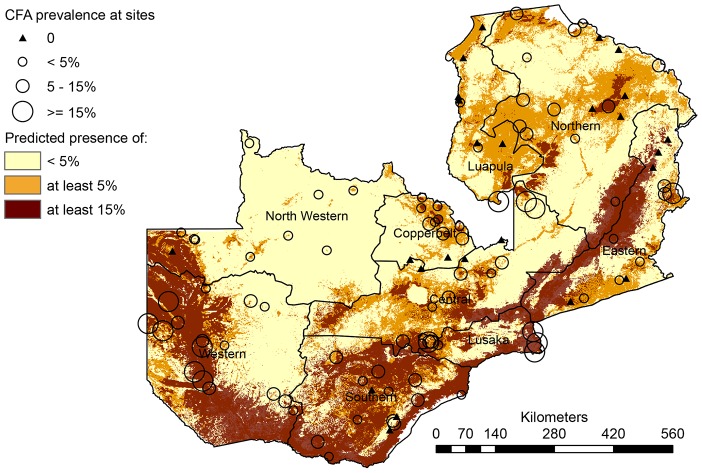
Methodology/principal findings: Approximately 10,000 adult volunteers from 108 geo-referenced survey sites across Zambia were examined for circulating filarial antigens (CFA) with rapid format ICT cards, and a map indicating the distribution of CFA prevalences in Zambia was prepared. 78% of survey sites had CFA positive cases, with prevalences ranging between 1% and 54%. Most positive survey sites had low prevalence, but six foci with more than 15% prevalence were identified. The observed geographical variation in prevalence pattern was examined in more detail using a species distribution modeling approach to explore environmental requirements for parasite presence, and to predict potential suitable habitats over unsurveyed areas. Of note, areas associated with human modification of the landscape appeared to play an important role for the general presence of LF, whereas temperature (measured as averaged seasonal land surface temperature) seemed to be an important determinant of medium-high prevalence levels.
Conclusions/significance: LF was found to be surprisingly widespread in Zambia, although in most places with low prevalence. The produced maps and the identified environmental correlates of LF infection will provide useful guidance for planning and start-up of geographically targeted and cost-effective LF control in Zambia.
Conflict of interest statement
The authors have declared that no competing interests exist.
Figures
Similar articles
-
Lymphatic filariasis in Luangwa District, South-East Zambia.Parasit Vectors. 2013 Oct 15;6(1):299. doi: 10.1186/1756-3305-6-299. Parasit Vectors. 2013. PMID: 24499525 Free PMC article.
-
Rapid assessment of the geographical distribution of lymphatic filariasis in Uganda, by screening of schoolchildren for circulating filarial antigens.Ann Trop Med Parasitol. 2005 Mar;99(2):141-53. doi: 10.1179/136485905X19829. Ann Trop Med Parasitol. 2005. PMID: 15814033
-
Cross-Reactivity of Filariais ICT Cards in Areas of Contrasting Endemicity of Loa loa and Mansonella perstans in Cameroon: Implications for Shrinking of the Lymphatic Filariasis Map in the Central African Region.PLoS Negl Trop Dis. 2015 Nov 6;9(11):e0004184. doi: 10.1371/journal.pntd.0004184. eCollection 2015 Nov. PLoS Negl Trop Dis. 2015. PMID: 26544042 Free PMC article.
-
Evaluation of lymphatic filariasis in endemic area of Brazil where mass drug administration is not required.Pathog Glob Health. 2019 May;113(3):143-148. doi: 10.1080/20477724.2019.1623546. Epub 2019 May 29. Pathog Glob Health. 2019. PMID: 31138026 Free PMC article.
-
Increasing evidence of low lymphatic filariasis prevalence in high risk Loa loa areas in Central and West Africa: a literature review.Parasit Vectors. 2018 Jun 15;11(1):349. doi: 10.1186/s13071-018-2900-y. Parasit Vectors. 2018. PMID: 29907117 Free PMC article. Review.
Cited by
-
Lymphatic filariasis in Luangwa District, South-East Zambia.Parasit Vectors. 2013 Oct 15;6(1):299. doi: 10.1186/1756-3305-6-299. Parasit Vectors. 2013. PMID: 24499525 Free PMC article.
-
Mapping and monitoring for a lymphatic filariasis elimination program: a systematic review.Res Rep Trop Med. 2019 May 27;10:43-90. doi: 10.2147/RRTM.S134186. eCollection 2019. Res Rep Trop Med. 2019. PMID: 31239804 Free PMC article. Review.
-
Longitudinal study of cross-reactive antigenemia in individuals with high Loa loa microfilarial density reveals promising biomarkers for distinguishing lymphatic filariasis from loiasis.Front Parasitol. 2023;2:1292837. doi: 10.3389/fpara.2023.1292837. Epub 2023 Nov 16. Front Parasitol. 2023. PMID: 39176078 Free PMC article.
-
Lymphatic Filariasis Elimination Status: Wuchereria bancrofti Infections in Human Populations after Five Effective Rounds of Mass Drug Administration in Zambia.Trop Med Infect Dis. 2023 Jun 22;8(7):333. doi: 10.3390/tropicalmed8070333. Trop Med Infect Dis. 2023. PMID: 37505629 Free PMC article.
-
The prevalence of lymphatic filariasis infection and disease following six rounds of mass drug administration in Mandalay Region, Myanmar.PLoS Negl Trop Dis. 2018 Nov 12;12(11):e0006944. doi: 10.1371/journal.pntd.0006944. eCollection 2018 Nov. PLoS Negl Trop Dis. 2018. PMID: 30419025 Free PMC article.
References
-
- Buckley JJC (1946) A helminthological survey in Northern Rhodesia. J Helminthol 21: 111–174.
-
- Barclay R (1971) Filariasis in Luangwa basin. Med J Zambia 5: 201–203.
-
- Hira PR (1975) Bancroftian filariasis in Zambia. Ann Trop Med Parasitol 69: 521–522.
-
- Hira PR (1976) Bancroftian filariasis. An autochthonous case in Zambia. Med J Zambia 10: 160–163. - PubMed
-
- Hira PR (1977) Wuchereria bancrofti: The staining of the microfilarial sheath in giemsa and haematoxylin for diagnosis. Med J Zambia 11: 93–96. - PubMed
Publication types
MeSH terms
Substances
Grants and funding
LinkOut - more resources
Full Text Sources
Other Literature Sources
Research Materials
Miscellaneous
