. 2014 Feb 21;20(7):1807-21.
doi: 10.3748/wjg.v20.i7.1807.

Diet high in fructose leads to an overexpression of lipocalin-2 in rat fatty liver

Affiliations

Diet high in fructose leads to an overexpression of lipocalin-2 in rat fatty liver

Salamah Mohammad Alwahsh et al. World J Gastroenterol. .

Abstract

Aim: To explore lipocalin-2 (LCN-2) expression and its possible role and mechanism(s) of production in rat models of diet-inducible fatty liver.

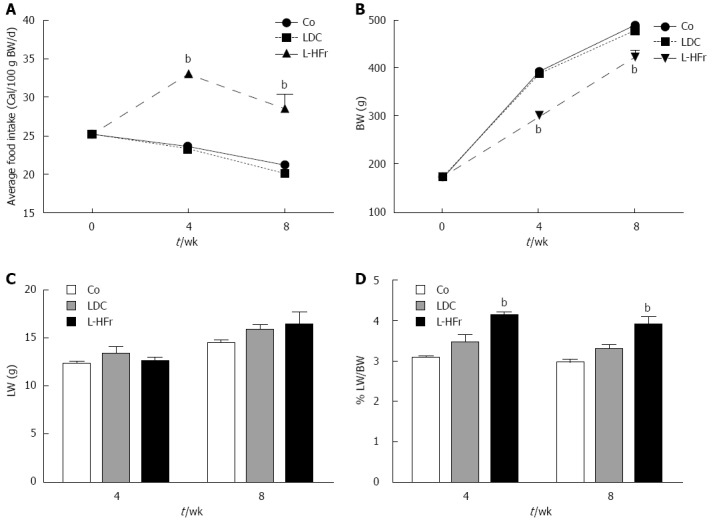
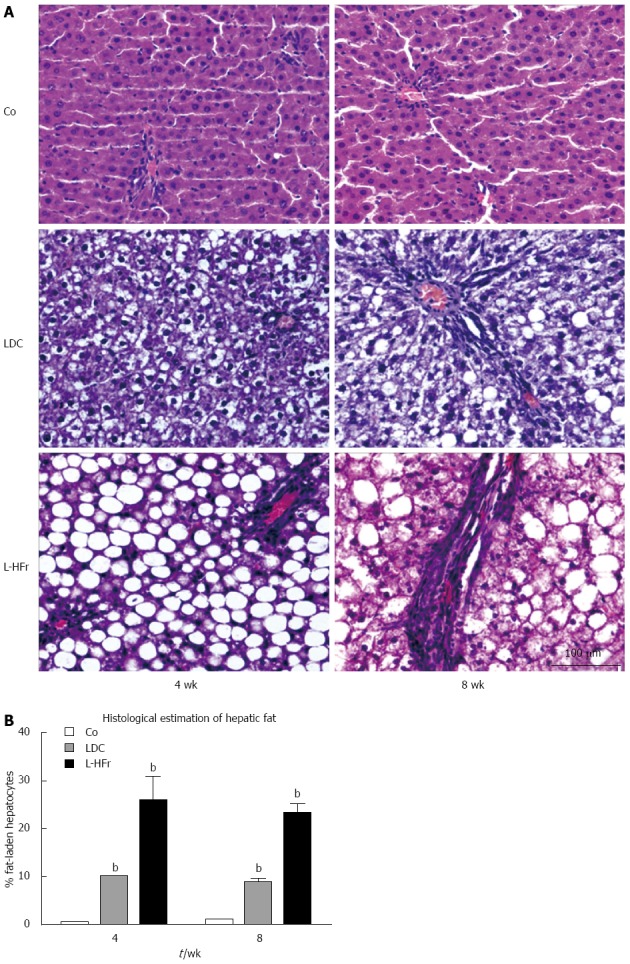
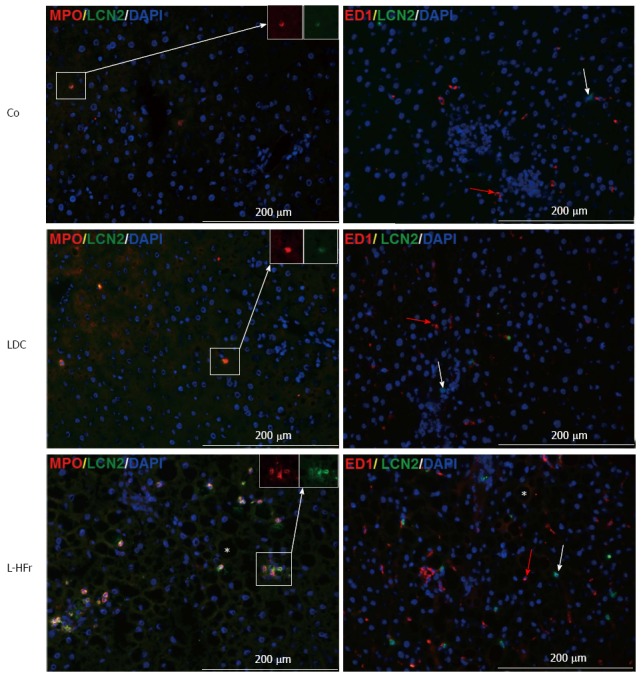
Methods: Fatty liver was triggered in male Sprague-Dawley rats fed either with liquid Lieber-DeCarli (LDC) or LDC + 70% cal fructose (L-HFr) diet for 4 or 8 wk. Chow-nourished animals served as controls. Hepatic expression of LCN-2 and other metabolic and inflammatory mediators was assessed by quantitative reverse transcription polymerase chain reaction and Western blotting. Serum LCN-2, fasting leptin, and lipid profile were evaluated via Enzyme-Linked Immunosorbent Assay, Radioimmunoassay, and colorimetric assays, respectively. The localization of LCN-2 in the liver was detected by using immunofluorescence staining. Furthermore, HE stain was used to evaluate hepatic fat degeneration and inflammation.

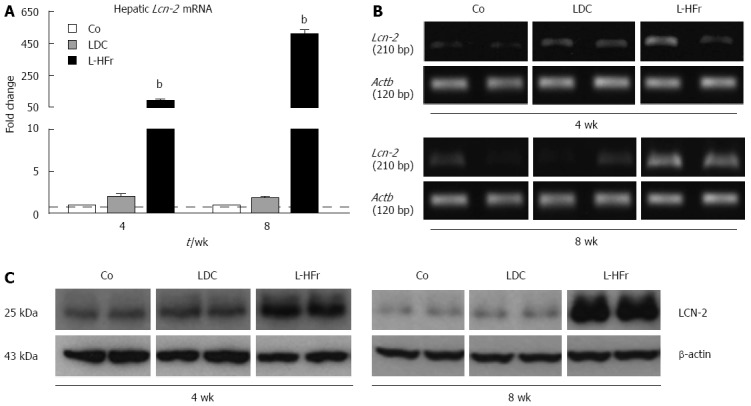
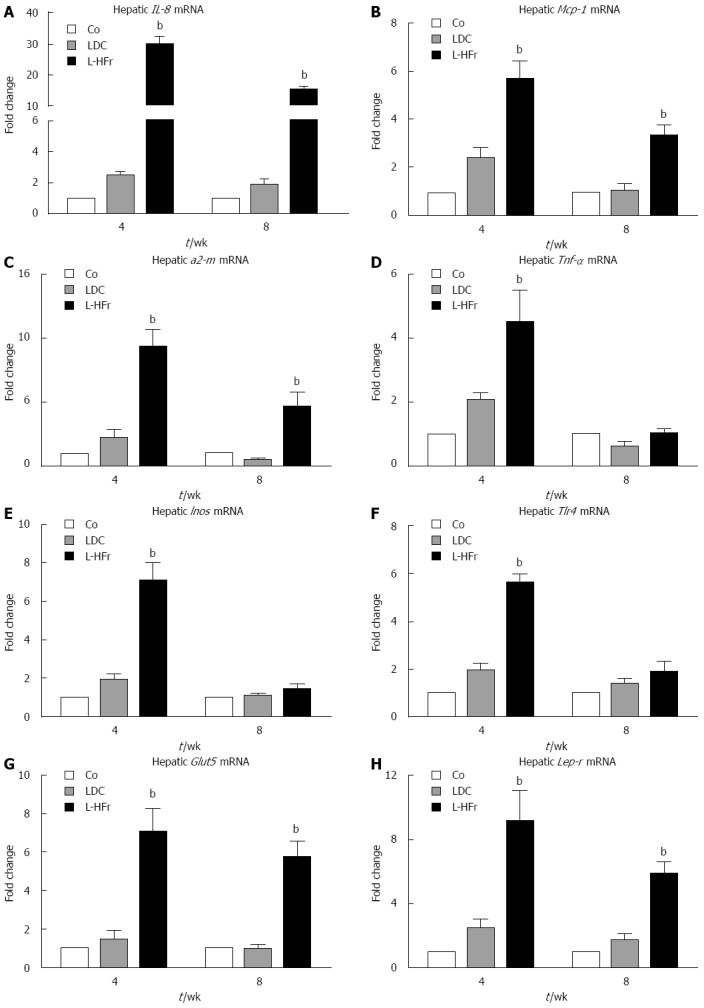
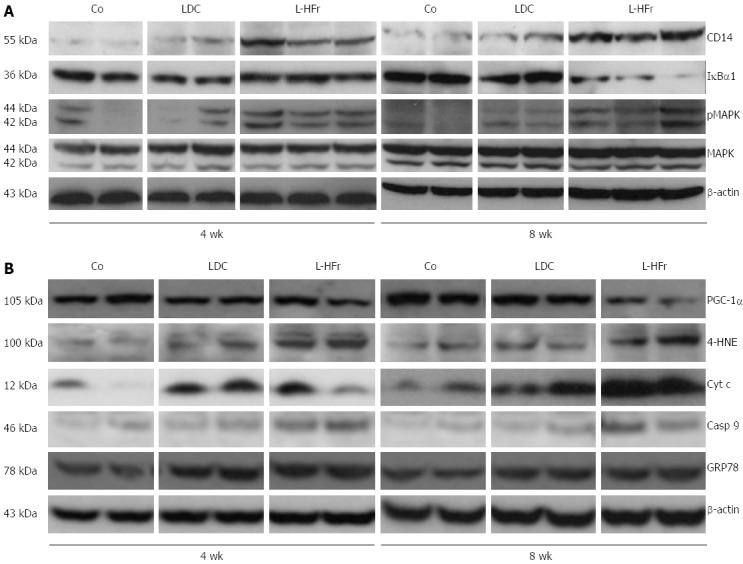
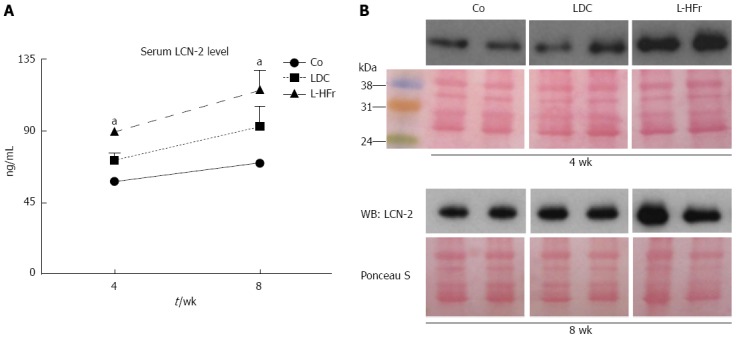
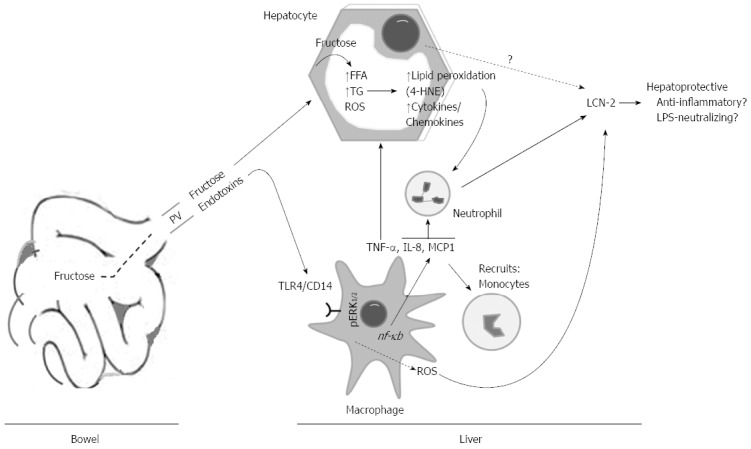
Results: Both LDC-fed and L-HFr-fed rat histologically featured fatty liver. In the liver, mRNA transcriptions of Mcp-1, a2-m, Il-8 and Glut5 were increased in the L-HFr group at both time points (P < 0.001), while the transcription of Tlr4, Inos, and Tnf-α was significantly up-regulated at week 4. Interestingly, hepatic Lcn-2 expression was 90-fold at week 4 and 507-fold at week 8 higher in L-HFr-subjected rats vs control (P < 0.001). In contrast to HDL-cholesterol, systemic levels of LCN-2, fasting leptin and triglycerides were elevated in the L-HFr regimen (P < 0.001). Moreover, protein expression of hepatic LCN-2, CD14, phospho-MAPK, caspase-9, cytochrome c and 4-hydroxynonenal was increased in the L-HFr group. Conversely, the hepatic expression of PGC-1α (a mitochondrial-biogenic protein) was reduced in the L-HFr category at week 8. The localization of LCN-2 in the liver was predominantly restricted to MPO⁺ granulocytes.

Conclusion: Fructose diet up-regulates hepatic LCN-2 expression, which correlates with the increased indicators of oxidative stress and mitochondrial dysfunction. The LCN-2 may be involved in liver protection.

Keywords: Endotoxins; Inflammation; Lipopolysaccharide; Metabolic syndrome; Mitochondrial dysfunction; Non-alcoholic fatty liver disease; Oxidative stress.


Figures

Figure 1
Figure 1
Phenotypes of the animals and daily food intake. Linear graph shows the average of animals’ caloric intake (A) at weeks 0, 4 and 8 of the treatment (food intake was expressed as cal/100 g BW/d) and animals’ body weight (BW; B). Bar blots show liver weight (LW; C) and relative liver weight (RLW; D). Data are presented as mean ± SEM of 4 rats per group in correspondence to time points. Indicates statistically significant difference bP < 0.01 via one-way ANOVA. Standard chow pellets (Co), a fresh-prepared Lieber-DeCarli (LDC) liquid diet, and LDC combined with 70% cal fructose (L-HFr).
Figure 2
Figure 2
Changes in lipocalin-2 mRNA and protein expression in rats livers. A: Bar plots show relative specific mRNA levels in hepatic samples. Each bar represents as mean ± SEM of 4 rats/group at weeks 4 and 8. Data were normalized by ubiquitin C. β-actin (Actb) was used as an additional reference housekeeping gene, yielding comparable results; B: Photographs of end-point polymerase chain reaction products run on 1.1% agarose gel electrophoresis for hepatic Lcn-2 and Actb; C: Immunoblots of hepatic LCN-2 (two representative animals per group). bP < 0.01. Co: Chow pellets; LDC: Lieber-DeCarli liquid diet; L-HFr: LDC combined with 70% fructose.
Figure 3
Figure 3
Alterations in hepatic mRNA levels of inflammation- and metabolism-related genes. A-C: Bar plots show relative specific mRNA levels of inflammation-related mediators in hepatic specimens that were up-regulated in the L-HFr group at both time points; D-F: Only increased at 4th week; G-H: Selected metabolism-related genes; Each bar represents mean ± SEM of 4 rats/group at weeks 4 and 8; Data were normalized by Ubc (ubiquitin C), and Actb (β-actin) was additionally used as a reference housekeeping gene. bP < 0.001. Co: Chow pellets; LDC: Lieber-DeCarli liquid diet; L-HFr: LDC combined with 70% fructose.
Figure 4
Figure 4
Changes in protein expression in rat liver. A: Representative immunoblots for inflammation-related proteins; B: mitochondrial functional impairment, apoptosis, and oxidative stress; Co: Chow diet, LDC: Lieber-DeCarli liquid diet; L-HFr: LDC + 70% fructose.
Figure 5
Figure 5
Up-regulation of a systemic lipocalin-2 mainly in animal model fed with Lieber-DeCarli + 70% cal fructose diet. A: Serum LCN-2 data; Values on y-axis were expressed in ng/mL; B: Representative autoradiographies from Western blotting determination and the corresponding Ponceau stained membrane of two animals per group are shown. aP < 0.05 Significance difference vs Co. Co: Chow diet, LDC: Lieber-DeCarli liquid diet; L-HFr: LDC + 70% fructose.
Figure 6
Figure 6
Microphotograph of representative livers of rats on different dietary regimens for 4 or 8 wk. A: The left panel (4-wk) and right panel (8-wk) of HE stained livers show: Co: control group exhibiting normal arrangement of hepatocytes around the sinusoids; LDC: Lieber-DeCarli nourished group represented principally micro- and randomly macro-steatosis at 4 and 8 wk respectively; L-HFr: 70% cal fructose supplemented LDC group showing almost hepatocytes around the portal triads with macrovesicular steatosis shows clear, rounded, and well-defined fat droplets (often single) within the cytoplasm and the nuclei are peripherally displaced by the fat droplets clearly at 4 wk more than 8 wk of experiment time, accompanied with loss of structural integrity and vessel architecture. Scale bar = 100 μm; B: Percentage of hepatocytes with macro fat vesicles was microscopically evaluated by a pathologist in HE stained liver slices. bP < 0.01 vs Co.
Figure 7
Figure 7
Representative photomicrographs show immunolocalization of key markers of Neutrophil granulocytes infiltration. Myeloperoxidase (MPO) double-stained with LCN-2 (left-panel), and tissue macrophages (ED1) plus LCN-2 (right-panel) at week 4; A co-localization of LCN-2 and MPO can be detected in liver sections. The black cavities (vesicles) that were marked by Star in L-HFr micrographs resulted from washing of fat from hepatocytes during fixation step. Red arrows in right panel show ED1+ cells. Scale bar = 200 μm. Co: Chow diet, LDC: Lieber-DeCarli liquid diet; L-HFr: LDC + 70% fructose.
Figure 8
Figure 8
Hypothetical model of the mechanism thereby lipocalin-2 was produced in high fructose-induced rat fatty liver. Ingested fructose is delivered into the liver via portal vein. Once in liver, hepatocytes transformed fructose into FFAs and TGs. In addition, the chronic fructose consumption facilitates the influx of endotoxins LPS into the liver. Endotoxins stimulate Kupffer cells which, in turn, release ROS and cytokines. This results in recruitment of more neutrophil granulocytes and monocytes to the liver. As a result of fat accumulation in hepatocytes, lipid peroxidation end products (e.g., 4-HNE), iNOS and other cytokines/chemokines will be produced, which could recruit neutrophil granulocytes to the liver. LCN-2 could act as hepatoprotective protein. PV: Portal vein; LPS: Lipopolysaccharide; LCN-2: Lipocalin-2.

Similar articles

Cited by

References

    1. Wieckowska A, McCullough AJ, Feldstein AE. Noninvasive diagnosis and monitoring of nonalcoholic steatohepatitis: present and future. Hepatology. 2007;46:582–589. - PubMed
    1. Vanni E, Bugianesi E, Kotronen A, De Minicis S, Yki-Järvinen H, Svegliati-Baroni G. From the metabolic syndrome to NAFLD or vice versa? Dig Liver Dis. 2010;42:320–330. - PubMed
    1. Younossi ZM. Review article: current management of non-alcoholic fatty liver disease and non-alcoholic steatohepatitis. Aliment Pharmacol Ther. 2008;28:2–12. - PubMed
    1. Lê KA, Bortolotti M. Role of dietary carbohydrates and macronutrients in the pathogenesis of nonalcoholic fatty liver disease. Curr Opin Clin Nutr Metab Care. 2008;11:477–482. - PubMed
    1. Akar F, Uludağ O, Aydın A, Aytekin YA, Elbeg S, Tuzcu M, Sahin K. High-fructose corn syrup causes vascular dysfunction associated with metabolic disturbance in rats: protective effect of resveratrol. Food Chem Toxicol. 2012;50:2135–2141. - PubMed

Publication types

MeSH terms