

Assessing Risks to Sea Otters and the Exxon Valdez Oil Spill: New Scenarios, Attributable Risk, and Recovery
- PMID: 24587690
- PMCID: PMC3935186
- DOI: 10.1080/10807039.2013.828513
Assessing Risks to Sea Otters and the Exxon Valdez Oil Spill: New Scenarios, Attributable Risk, and Recovery
Abstract
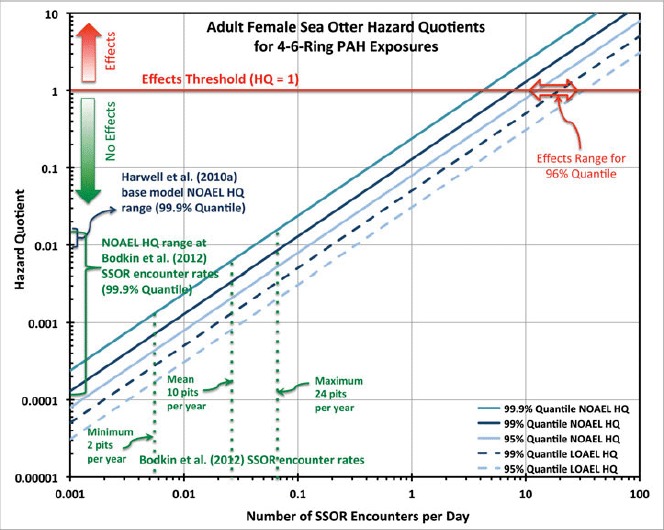
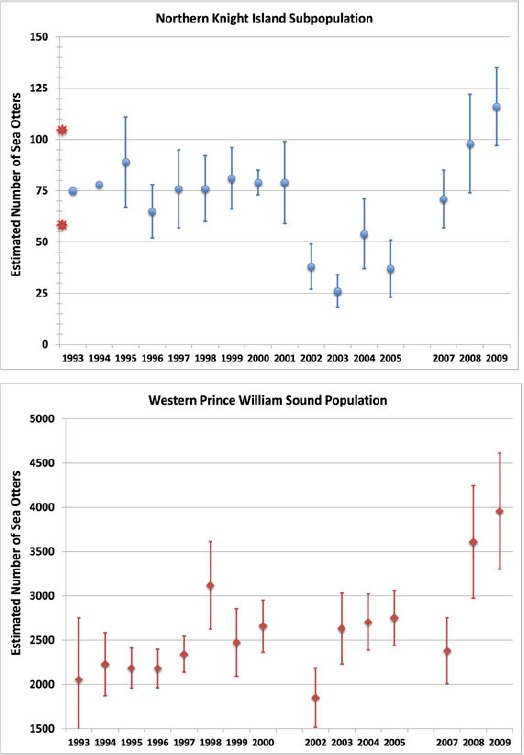
The Exxon Valdez oil spill occurred more than two decades ago, and the Prince William Sound ecosystem has essentially recovered. Nevertheless, discussion continues on whether or not localized effects persist on sea otters (Enhydra lutris) at northern Knight Island (NKI) and, if so, what are the associated attributable risks. A recent study estimated new rates of sea otter encounters with subsurface oil residues (SSOR) from the oil spill. We previously demonstrated that a potential pathway existed for exposures to polycyclic aromatic hydrocarbons (PAHs) and conducted a quantitative ecological risk assessment using an individual-based model that simulated this and other plausible exposure pathways. Here we quantitatively update the potential for this exposure pathway to constitute an ongoing risk to sea otters using the new estimates of SSOR encounters. Our conservative model predicted that the assimilated doses of PAHs to the 1-in-1000th most-exposed sea otters would remain 1-2 orders of magnitude below the chronic effects thresholds. We re-examine the baseline estimates, post-spill surveys, recovery status, and attributable risks for this subpopulation. We conclude that the new estimated frequencies of encountering SSOR do not constitute a plausible risk for sea otters at NKI and these sea otters have fully recovered from the oil spill.
Keywords: Enhydra lutris; Exxon Valdez oil spill; attributable risk; ecological recovery; ecological risk assessment; individual-based models; sea otter.
Figures


Similar articles
-
A Quantitative Ecological Risk Assessment of the Toxicological Risks from Exxon Valdez Subsurface Oil Residues to Sea Otters at Northern Knight Island, Prince William Sound, Alaska.Hum Ecol Risk Assess. 2010 Jul;16(4):727-761. doi: 10.1080/10807039.2010.501230. Epub 2010 Aug 23. Hum Ecol Risk Assess. 2010. PMID: 20862194 Free PMC article.
-
Quantifying population-level risks using an individual-based model: sea otters, Harlequin Ducks, and the Exxon Valdez oil spill.Integr Environ Assess Manag. 2012 Jul;8(3):503-22. doi: 10.1002/ieam.1277. Epub 2012 Mar 12. Integr Environ Assess Manag. 2012. PMID: 22275071 Free PMC article.
-
Exposure of sea otters and harlequin ducks in Prince William Sound, Alaska, USA, to shoreline oil residues 20 years after the Exxon Valdez oil spill.Environ Toxicol Chem. 2011 Mar;30(3):659-72. doi: 10.1002/etc.415. Epub 2011 Jan 7. Environ Toxicol Chem. 2011. PMID: 21298711
-
Prolonged recovery of sea otters from the Exxon Valdez oil spill? A re-examination of the evidence.Mar Pollut Bull. 2013 Jun 15;71(1-2):7-19. doi: 10.1016/j.marpolbul.2013.03.027. Epub 2013 Apr 29. Mar Pollut Bull. 2013. PMID: 23639486 Review.
-
Ecological significance of residual exposures and effects from the Exxon Valdez oil spill.Integr Environ Assess Manag. 2006 Jul;2(3):204-46. doi: 10.1897/1551-3793(2006)2[204:esorea]2.0.co;2. Integr Environ Assess Manag. 2006. PMID: 16869437 Review.
Cited by
-
Evaluation of diagnostic ratios of phenanthrenes and chrysenes for the identification of severely weathered spilled oils from the simulation weathering and the Sinopec pipeline explosion at Huangdao, 2013.RSC Adv. 2018 Sep 18;8(56):32164-32171. doi: 10.1039/c8ra03154a. eCollection 2018 Sep 12. RSC Adv. 2018. PMID: 35547522 Free PMC article.
-
Conceptual Framework for Assessing Ecosystem Health.Integr Environ Assess Manag. 2019 Jul;15(4):544-564. doi: 10.1002/ieam.4152. Epub 2019 Jul 25. Integr Environ Assess Manag. 2019. PMID: 30908815 Free PMC article.
References
-
- Ballachey BE, Bodkin JL. Lingering Oil and Sea Otters: Pathways of Exposure and Recovery Status. Restoration Project 620 Draft Final Report. 2006. April 2006. Exxon Valdez Oil Spill Trustee Council, Anchorage, AK, USA; note: This report is no longer available from the Trustees' website; at some date after the sea otter diving parameters from this report were used for a sensitivity analysis reported in Harwell et al. (2010a), the authors' agency (USGS) has attached this disclaimer: “A portion of this report was based on data recently determined to be unverifiable; it will not be published or released to the public in its current form and therefore should not be cited.”.
-
- Beyers DW. Causal inference in environmental impact studies. J N Am Benthol Soc. 1998;17:367–73.
-
- Bhatia NP, Szego GP. Stability Theory of Dynamical Systems. New York, NY, USA: Springer-Verlag; 1970.
-
- Bodkin JL, Ballachey BE, Dean TA, et al. Sea otter population status and the process of recovery from the 1989 Exxon Valdez oil spill. Mar Ecol Prog Ser. 2002;241:237–53.
-
- Bodkin JL, Ballachey BE, Esslinger GG. Synthesis of Nearshore Recovery Following the 1989 Exxon Valdez Oil Spill: Trends in Sea Otter Population Abundance in Western Prince William Sound. 2011. Restoration Projects 070808, 070808A, and 090808 Final Report. US Geological Survey, Alaska Science Center, Anchorage, AK, USA.
LinkOut - more resources
Full Text Sources
Other Literature Sources