

Motion tracking in infrared imaging for quantitative medical diagnostic applications
- PMID: 24587692
- PMCID: PMC3935328
- DOI: 10.1016/j.infrared.2013.10.009
Motion tracking in infrared imaging for quantitative medical diagnostic applications
Abstract
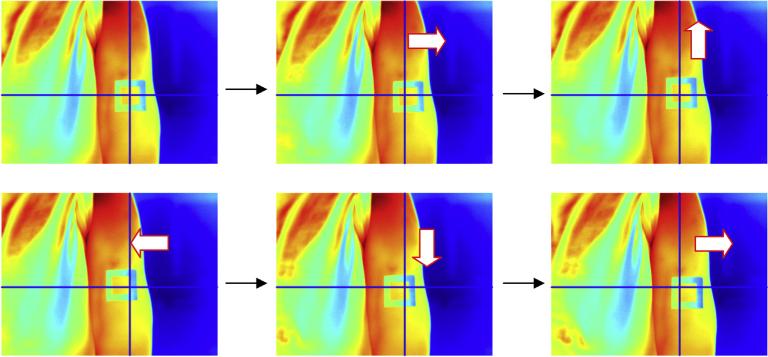
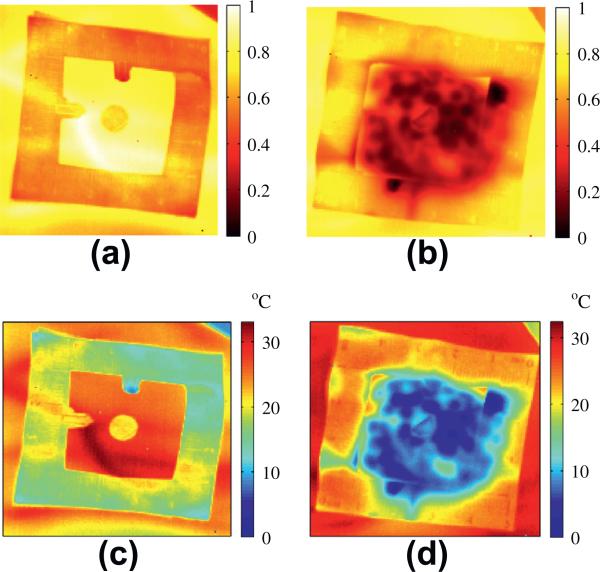
In medical applications, infrared (IR) thermography is used to detect and examine the thermal signature of skin abnormalities by quantitatively analyzing skin temperature in steady state conditions or its evolution over time, captured in an image sequence. However, during the image acquisition period, the involuntary movements of the patient are unavoidable, and such movements will undermine the accuracy of temperature measurement for any particular location on the skin. In this study, a tracking approach using a template-based algorithm is proposed, to follow the involuntary motion of the subject in the IR image sequence. The motion tacking will allow to associate a temperature evolution to each spatial location on the body while the body moves relative to the image frame. The affine transformation model is adopted to estimate the motion parameters of the template image. The Lucas-Kanade algorithm is applied to search for the optimized parameters of the affine transformation. A weighting mask is incorporated into the algorithm to ensure its tracking robustness. To evaluate the feasibility of the tracking approach, two sets of IR image sequences with random in-plane motion were tested in our experiments. A steady-state (no heating or cooling) IR image sequence in which the skin temperature is in equilibrium with the environment was considered first. The thermal recovery IR image sequence, acquired when the skin is recovering from 60-s cooling, was the second case analyzed. By proper selection of the template image along with template update, satisfactory tracking results were obtained for both IR image sequences. The achieved tracking accuracies are promising in terms of satisfying the demands imposed by clinical applications of IR thermography.
Keywords: Dynamic infrared imaging; Infrared thermography; Medical thermography; Motion tracking; Quantitative infrared imaging; Template-based algorithm.
Figures


Similar articles
-
Involuntary motion tracking for medical dynamic infrared thermography using a template-based algorithm.Proc SPIE Int Soc Opt Eng. 2013 Mar 13;8669:10.1117/12.2000569. doi: 10.1117/12.2000569. Proc SPIE Int Soc Opt Eng. 2013. PMID: 24392205 Free PMC article.
-
Quantitative visualization and detection of skin cancer using dynamic thermal imaging.J Vis Exp. 2011 May 5;(51):2679. doi: 10.3791/2679. J Vis Exp. 2011. PMID: 21587160 Free PMC article.
-
Thermal infrared imaging based facial temperature in comparison to ear temperature during a real-driving scenario.J Therm Biol. 2021 Feb;96:102806. doi: 10.1016/j.jtherbio.2020.102806. Epub 2020 Dec 9. J Therm Biol. 2021. PMID: 33627258
-
FPA-based infrared thermography as applied to the study of cutaneous perspiration and stimulated vascular response in humans.Phys Med Biol. 2005 Dec 7;50(23):R63-94. doi: 10.1088/0031-9155/50/23/R01. Epub 2005 Nov 23. Phys Med Biol. 2005. PMID: 16306642 Review.
-
Recent use of medical infrared thermography in skin neoplasms.Skin Res Technol. 2018 Nov;24(4):587-591. doi: 10.1111/srt.12469. Epub 2018 Mar 25. Skin Res Technol. 2018. PMID: 29575378 Review.
Cited by
-
Synchronization Design and Error Analysis of Near-Infrared Cameras in Surgical Navigation.J Med Syst. 2016 Jan;40(1):7. doi: 10.1007/s10916-015-0368-2. Epub 2015 Oct 29. J Med Syst. 2016. PMID: 26573644
-
Heat transfer model for deep tissue injury: a step towards an early thermographic diagnostic capability.Diagn Pathol. 2014 Feb 20;9:36. doi: 10.1186/1746-1596-9-36. Diagn Pathol. 2014. PMID: 24555856 Free PMC article.
-
Skin Cancer Detection Using Infrared Thermography: Measurement Setup, Procedure and Equipment.Sensors (Basel). 2022 Apr 26;22(9):3327. doi: 10.3390/s22093327. Sensors (Basel). 2022. PMID: 35591018 Free PMC article. Review.
References
-
- Button TM, Li H, Fisher P, Rosenblatt R, Dulaimy K, Li S, O'Hea B, Salvitti M, Geronimo V, Geronimo C, Jambawalikar S, Carvelli P, Weiss R. Dynamic infrared imaging for the detection of malignancy. Phys. Med. Biol. 2004;49:3105–3116. - PubMed
-
- Cetingul MP, Herman C. Quantification of the thermal signature of a melanoma lesion. Int. J. Therm. Sci. 2011;50:421–431.
-
- Cetingul MP, Herman C. A heat transfer model of skin tissue for the detection of lesions: sensitivity analysis. Phys. Med. Biol. 2010;55:5933–5951. - PubMed
-
- Cetingul MP, Cetingul HE, Herman C. Analysis of transient thermal images to distinguish melanoma from dysplastic nevi. Proc. SPIE Medical Imaging 2011: Computer-Aided Diagnosis. 2011;79633N
Grants and funding
LinkOut - more resources
Full Text Sources
Other Literature Sources