

Differential evolutionary constraints in the evolution of chemoreceptors: a murine and human case study
- PMID: 24587745
- PMCID: PMC3920627
- DOI: 10.1155/2014/696485
Differential evolutionary constraints in the evolution of chemoreceptors: a murine and human case study
Abstract
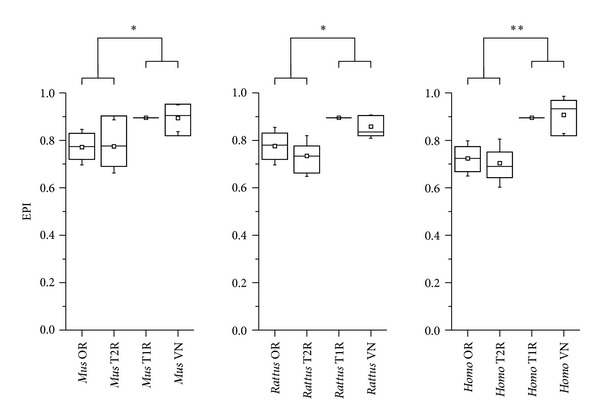
Chemoreception is among the most important sensory modalities in animals. Organisms use the ability to perceive chemical compounds in all major ecological activities. Recent studies have allowed the characterization of chemoreceptor gene families. These genes present strikingly high variability in copy numbers and pseudogenization degrees among different species, but the mechanisms underlying their evolution are not fully understood. We have analyzed the functional networks of these genes, their orthologs distribution, and performed phylogenetic analyses in order to investigate their evolutionary dynamics. We have modeled the chemosensory networks and compared the evolutionary constraints of their genes in Mus musculus, Homo sapiens, and Rattus norvegicus. We have observed significant differences regarding the constraints on the orthologous groups and network topologies of chemoreceptors and signal transduction machinery. Our findings suggest that chemosensory receptor genes are less constrained than their signal transducing machinery, resulting in greater receptor diversity and conservation of information processing pathways. More importantly, we have observed significant differences among the receptors themselves, suggesting that olfactory and bitter taste receptors are more conserved than vomeronasal receptors.
Figures


Similar articles
-
Distinct evolutionary patterns between chemoreceptors of 2 vertebrate olfactory systems and the differential tuning hypothesis.Mol Biol Evol. 2008 Aug;25(8):1593-601. doi: 10.1093/molbev/msn107. Epub 2008 May 5. Mol Biol Evol. 2008. PMID: 18460446 Free PMC article.
-
The Caenorhabditis chemoreceptor gene families.BMC Biol. 2008 Oct 6;6:42. doi: 10.1186/1741-7007-6-42. BMC Biol. 2008. PMID: 18837995 Free PMC article.
-
Expression of taste receptors in solitary chemosensory cells of rodent airways.BMC Pulm Med. 2011 Jan 13;11:3. doi: 10.1186/1471-2466-11-3. BMC Pulm Med. 2011. PMID: 21232137 Free PMC article.
-
Evolutionary dynamics of olfactory and other chemosensory receptor genes in vertebrates.J Hum Genet. 2006;51(6):505-517. doi: 10.1007/s10038-006-0391-8. Epub 2006 Apr 11. J Hum Genet. 2006. PMID: 16607462 Free PMC article. Review.
-
Mammalian chemosensory receptors.Neuroreport. 2002 Jan 21;13(1):A9-17. doi: 10.1097/00001756-200201210-00003. Neuroreport. 2002. PMID: 11924905 Review.
Cited by
-
The molecular evolutionary dynamics of the vomeronasal receptor (class 1) genes in primates: a gene family on the verge of a functional breakdown.Front Neuroanat. 2014 Dec 12;8:153. doi: 10.3389/fnana.2014.00153. eCollection 2014. Front Neuroanat. 2014. PMID: 25565978 Free PMC article. Review.
-
The vomeronasal system of the newborn capybara: a morphological and immunohistochemical study.Sci Rep. 2020 Aug 6;10(1):13304. doi: 10.1038/s41598-020-69994-w. Sci Rep. 2020. PMID: 32764621 Free PMC article.
References
-
- Adler E, Hoon MA, Mueller KL, Chandrashekar J, Ryba NJP, Zuker CS. A novel family of mammalian taste receptors. Cell. 2000;100(6):693–702. - PubMed
-
- Nelson G, Hoon MA, Chandrashekar J, Zhang Y, Ryba NJP, Zuker CS. Mammalian sweet taste receptors. Cell. 2001;106(3):381–390. - PubMed
-
- Rodriguez I, Del Punta K, Rothman A, Ishii T, Mombaerts P. Multiple new and isolated families within the mouse superfamily of V1r vomeronasal receptors. Nature Neuroscience. 2002;5(2):134–140. - PubMed
-
- Hashiguchi Y, Nishida M. Evolution of trace amine-associated receptor (TAAR) gene family in vertebrates: Lineage-specific expansions and degradations of a second class of vertebrate chemosensory receptors expressed in the olfactory epithelium. Molecular Biology and Evolution. 2007;24(9):2099–2107. - PubMed
MeSH terms
Substances
LinkOut - more resources
Full Text Sources
Other Literature Sources
