

Carbonaceous aerosols in fine particulate matter of Santiago Metropolitan Area, Chile
- PMID: 24587753
- PMCID: PMC3919059
- DOI: 10.1155/2014/794590
Carbonaceous aerosols in fine particulate matter of Santiago Metropolitan Area, Chile
Abstract
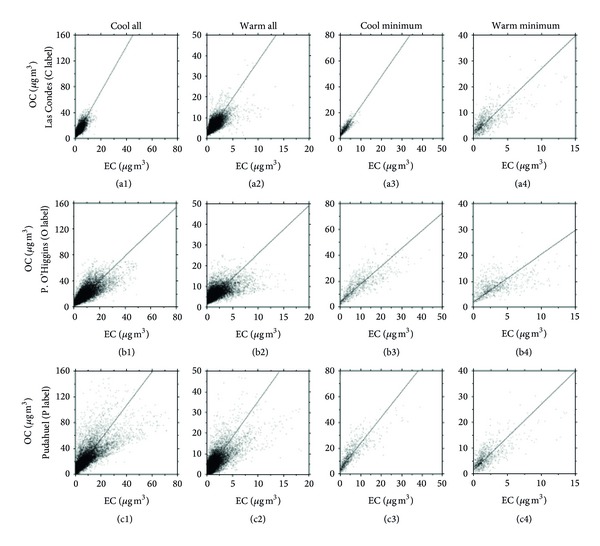
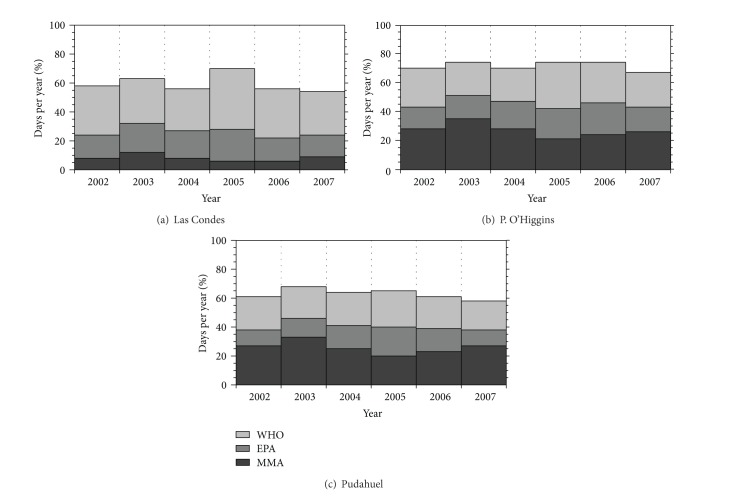
Measurements of carbonaceous aerosols in South American cities are limited, and most existing data are of short term and limited to only a few locations. For 6 years (2002-2007), concentrations of fine particulate matter and organic and elemental carbon were measured continuously in the capital of Chile. The contribution of carbonaceous aerosols to the primary and secondary fractions was estimated at three different sampling sites and in the warm and cool seasons. The results demonstrate that there are significant differences in the levels in both the cold (March to August) and warm (September to February) seasons at all sites studied. The percent contribution of total carbonaceous aerosol fine particulate matter was greater in the cool season (53 ± 41%) than in the warm season (44 ± 18%). On average, the secondary organic carbon in the city corresponded to 29% of the total organic carbon. In cold periods, this proportion may reach an average of 38%. A comparison of the results with the air quality standards for fine particulate matter indicates that the total carbonaceous fraction alone exceeds the World Health Organization standard (10 µg/m(3)) and the United States Environmental Protection Agency standard (15 µg/m(3)) for fine particulate matter.
Figures
Similar articles
-
Sources and characteristics of carbonaceous aerosols at Agra "World heritage site" and Delhi "capital city of India".Environ Sci Pollut Res Int. 2014;21(14):8678-91. doi: 10.1007/s11356-014-2768-0. Epub 2014 Apr 11. Environ Sci Pollut Res Int. 2014. PMID: 24723344
-
Trends in the elemental composition of fine particulate matter in Santiago, Chile, from 1998 to 2003.J Air Waste Manag Assoc. 2007 Jul;57(7):845-55. doi: 10.3155/1047-3289.57.7.845. J Air Waste Manag Assoc. 2007. PMID: 17688000
-
Organic and elemental carbon associated to PM10 and PM 2.5 at urban sites of northern Greece.Environ Sci Pollut Res Int. 2014 Feb;21(3):1769-1785. doi: 10.1007/s11356-013-2052-8. Epub 2013 Aug 25. Environ Sci Pollut Res Int. 2014. PMID: 23979848
-
Multicity study of air pollution and mortality in Latin America (the ESCALA study).Res Rep Health Eff Inst. 2012 Oct;(171):5-86. Res Rep Health Eff Inst. 2012. PMID: 23311234
-
Carbonaceous aerosols over China--review of observations, emissions, and climate forcing.Environ Sci Pollut Res Int. 2016 Jan;23(2):1671-80. doi: 10.1007/s11356-015-5398-2. Epub 2015 Sep 19. Environ Sci Pollut Res Int. 2016. PMID: 26385857 Review.
Cited by
-
Influence of number of visitors and weather conditions on airborne particulate matter mass concentrations at the Plitvice Lakes National Park, Croatia during summer and autumn.Arh Hig Rada Toksikol. 2022 Apr 7;73(1):1-14. doi: 10.2478/aiht-2022-73-3610. Arh Hig Rada Toksikol. 2022. PMID: 35390243 Free PMC article.
-
Source apportionment of the oxidative potential of fine ambient particulate matter (PM2.5) in Athens, Greece.Sci Total Environ. 2019 Feb 25;653:1407-1416. doi: 10.1016/j.scitotenv.2018.11.016. Epub 2018 Nov 7. Sci Total Environ. 2019. PMID: 30759579 Free PMC article.
References
-
- Hu D, Bian Q, Lau AKH, Yu JZ. Source apportioning of primary and secondary organic carbon in summer PM2.5 in Hong Kong using positive matrix factorization of secondary and primary organic tracer data. Journal of Geophysical Research D. 2010;115(16)16204
-
- Yang F, Brook J, He K, Duan F, Ma Y. Temporal variability in fine carbonaceous aerosol over two years in two megacities: Beijing and Toronto. Advances in Atmospheric Sciences. 2010;27(3):705–714.
-
- Highwood EJ, Kinnersley RP. When smoke gets in our eyes: the multiple impacts of atmospheric black carbon on climate, air quality and health. Environment International. 2006;32(4):560–566. - PubMed
-
- Fuzzi S, Andreae MO, Huebert BJ, et al. Critical assessment of the current state of scientific knowledge, terminology, and research needs concerning the role of organic aerosols in the atmosphere, climate, and global change. Atmospheric Chemistry and Physics. 2006;6(7):2017–2038.
Publication types
MeSH terms
Substances
LinkOut - more resources
Full Text Sources
Other Literature Sources
Medical
