. 2014 Aug;51(2):210-22.
doi: 10.1165/rcmb.2013-0353OC.

Knockout mice reveal key roles for claudin 18 in alveolar barrier properties and fluid homeostasis

Affiliations

Knockout mice reveal key roles for claudin 18 in alveolar barrier properties and fluid homeostasis

Guanglei Li et al. Am J Respir Cell Mol Biol. 2014 Aug.

Abstract

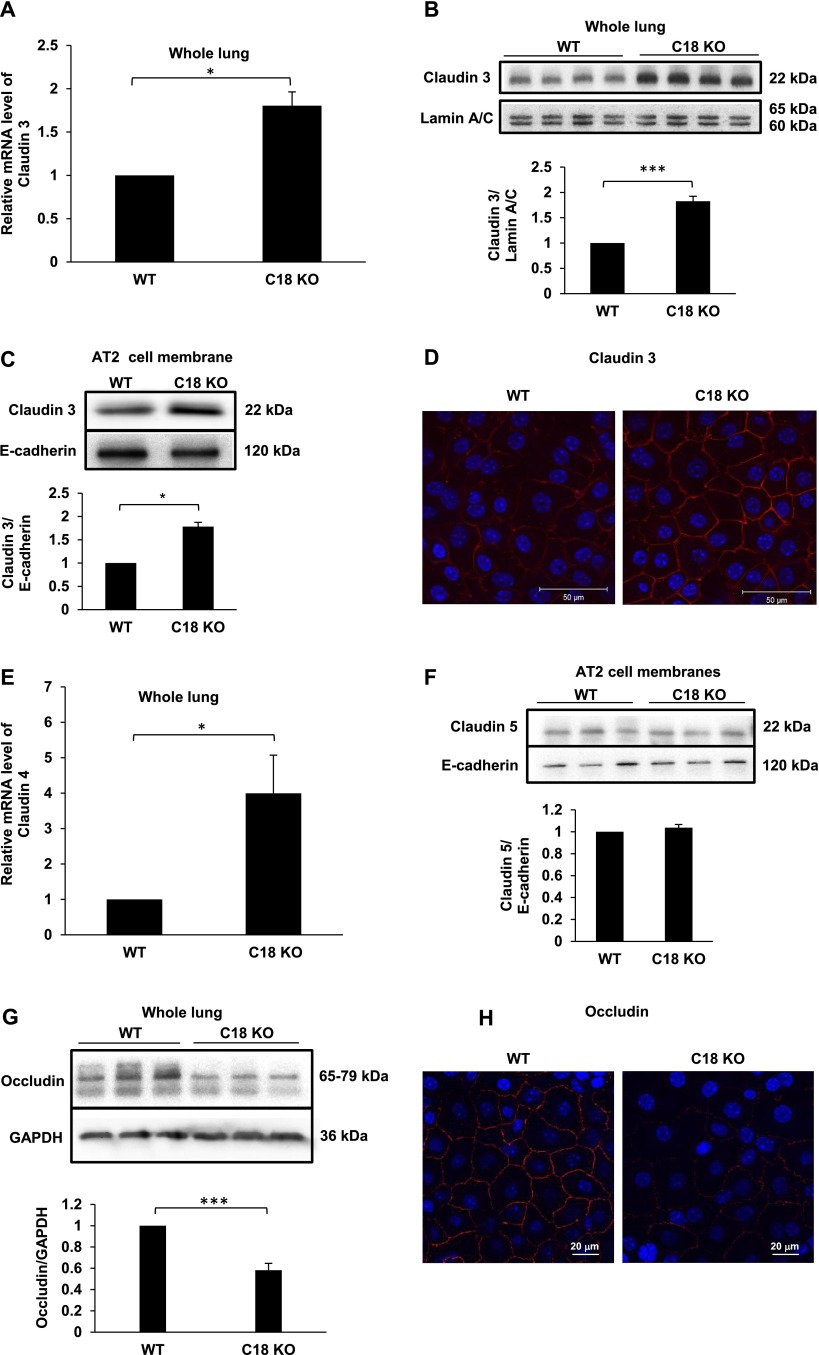
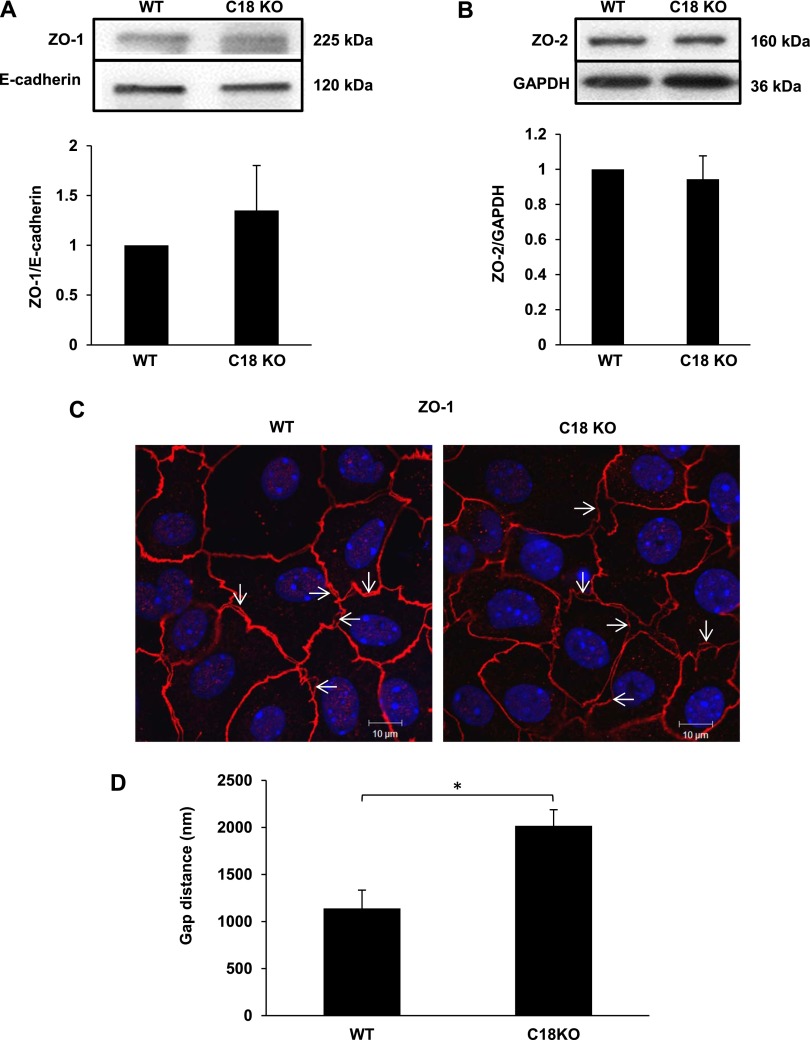
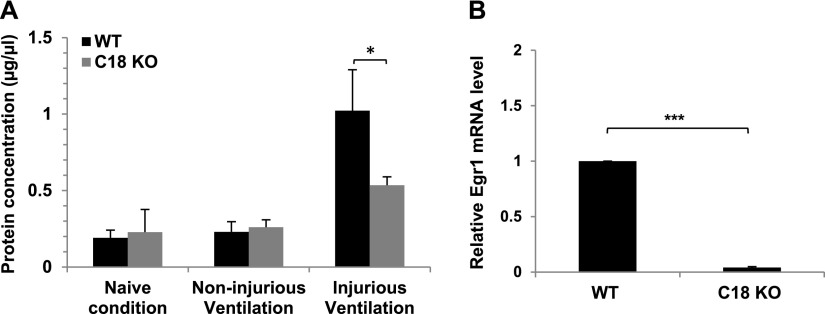
Claudin proteins are major constituents of epithelial and endothelial tight junctions (TJs) that regulate paracellular permeability to ions and solutes. Claudin 18, a member of the large claudin family, is highly expressed in lung alveolar epithelium. To elucidate the role of claudin 18 in alveolar epithelial barrier function, we generated claudin 18 knockout (C18 KO) mice. C18 KO mice exhibited increased solute permeability and alveolar fluid clearance (AFC) compared with wild-type control mice. Increased AFC in C18 KO mice was associated with increased β-adrenergic receptor signaling together with activation of cystic fibrosis transmembrane conductance regulator, higher epithelial sodium channel, and Na-K-ATPase (Na pump) activity and increased Na-K-ATPase β1 subunit expression. Consistent with in vivo findings, C18 KO alveolar epithelial cell (AEC) monolayers exhibited lower transepithelial electrical resistance and increased solute and ion permeability with unchanged ion selectivity. Claudin 3 and claudin 4 expression was markedly increased in C18 KO mice, whereas claudin 5 expression was unchanged and occludin significantly decreased. Microarray analysis revealed changes in cytoskeleton-associated gene expression in C18 KO mice, consistent with observed F-actin cytoskeletal rearrangement in AEC monolayers. These findings demonstrate a crucial nonredundant role for claudin 18 in the regulation of alveolar epithelial TJ composition and permeability properties. Increased AFC in C18 KO mice identifies a role for claudin 18 in alveolar fluid homeostasis beyond its direct contributions to barrier properties that may, at least in part, compensate for increased permeability.

Keywords: alveolar fluid clearance; bioelectrical properties; permeability; tight junction; β2-adrenergic receptor.


Figures

Figure 1.
Figure 1.
Increased alveolar fluid clearance (AFC) and lung permeability in claudin 18 knockout (C18 KO) mice. (A) AFC in C18 KO mice (n = 5) was about 2-fold higher than in wild-type (WT) mice (n = 5) at baseline (48.4 ± 4.5%/h versus 23.1 ± 1.9%/h; ***P < 0.001). Amiloride (0.3 mM) decreased AFC significantly in WT (*P < 0.05) and C18 KO (**P < 0.01) mice compared with mice of the same genotype at baseline. Terbutaline (0.1 mM) increased AFC significantly in WT (**P < 0.01) and C18 KO mice (***P < 0.001) compared with mice of the same genotype at baseline. (B) In a separate set of experiments, AFC at baseline was 52.1 ± 4.2%/h in C18 KO mice (n = 3) versus 31.6 ± 1.6%/h in WT mice (n = 3) (***P < 0.001). In the presence of the β-adrenergic receptor antagonist propranolol, there was no significant difference (NS) in AFC between C18 KO mice (24.6 ± 0.8%/h; n = 3) versus WT mice (19.2 ± 1.6%/h; n = 3). CFTR(inh)-172 decreased AFC to 34.9 ± 3.9%/h in C18 KO mice (n = 3) versus 30.7 ± 2.7%/h in WT mice (n = 3), a difference that was not significant. (C) In vivo permeability index of fluorescein-BSA from blood into alveolar spaces in C18 KO mice was significantly higher (0.56 ± 0.15; n = 9) than in WT mice (0.19 ± 0.04; n = 6). *P < 0.05. (D) Wet-to-dry lung weight ratios of WT and C18 KO mice were similar (4.63 ± 0.54 [n = 34] in WT mice versus 4.48 ± 0.23 [n = 33] in C18 KO mice; P = 0.14).
Figure 2.
Figure 2.
Increased Na-K-ATPase activity and β1 subunit expression in C18 KO mice. (A) Ouabain-sensitive ATPase activity (attributed primarily to Na-K-ATPase activity) was significantly higher (2.3-fold; **P < 0.01) in whole lung membranes from C18 KO (6.3 ± 0.31; n = 3) versus WT mice (2.7 ± 0.12; n = 3). (B) Quantitative RT-PCR (qRT-PCR) analysis of WT and C18 KO whole lung demonstrates relative expression of Na pump subunits (expression level of WT = 1.0). In C18 KO mice, expression of the β1 subunit increased by 61%, whereas α2, α3, and β2 subunits decreased by 56, 53, and 23%, respectively (*P < 0.05). Expression of α1 and β3 subunits remained unchanged. (C) qRT-PCR analysis of Na pump subunit gene expression in freshly isolated AT2 cells from C18 KO mice demonstrates increased expression of β1 and α1 subunits of 30 and 14%, respectively, whereas the α3 subunit was decreased (*P < 0.05) and α2, β2, and β3 subunits were unchanged compared with WT mice. (D) Western blot analysis of whole lung for β1 Na pump subunit demonstrates about 4-fold greater protein levels in C18 KO versus WT mice. ***P < 0.001. GAPDH, glyceraldehyde 3-phosphate dehydrogenase. (E) Western blot analysis of AT2 cell membrane fractions shows significantly higher (2.4-fold) β1 subunit expression in C18 KO versus WT mice. ***P < 0.001. (F) Analysis of β1 mRNA levels in mouse alveolar epithelial cell monolayers (MAECMs) on Day 6 in culture shows no differences between genotypes. (G) Western blot analysis of whole cell lysates from Day 6 MAECMs demonstrates that β1 protein level is unchanged in C18 KO versus WT mice.
Figure 3.
Figure 3.
Decreased transepithelial electrical resistance (RT) and increased solute and ion permeability in MAECMs from C18 KO mice. (A) RT was significantly lower across MAECMs from C18 KO mice (0.88 ± 0.06 kΩ·cm2; n = 53) versus MAECMs from WT mice (1.86 ± 0.10 kΩ·cm2; n = 51). ***P < 0.001. (B) There was no difference in IEQ between C18 KO (6.1 ± 0.3 μA/cm2; n = 53) and WT (6.2 ± 0.2 μA/cm2; n = 51) MAECMs. (C) In vitro permeability (Papp) to 5-carboxyfluorescein of MAECMs from C18 KO mice (38 × 10−8 ± 1.3 × 10⁻⁸ cm/s; n = 3) was significantly higher versus MAECMs from WT mice (24 × 10−8 ± 0.5 × 10⁻⁸ cm/s; n = 3). **P < 0.01. (D) In vitro tetramethylrhodamine-isothiocyanate (TRITC)-dextran permeability (Papp) was significantly higher in MAECM from C18 KO mice (2.3 × 10⁻⁸ ± 0.03 × 10⁻⁸ cm/s; n = 3) versus MAECM from WT mice (1.5 × 10⁻⁸ ± 0.15 × 10⁻⁸ cm/s; n = 3). *P < 0.05. (E) PNa/PCl was not different between WT (1.37 ± 0.06; n = 7) and C18 KO (1.52 ± 0.04; n = 7) MAECM. (F) No difference in PNa/PK was found between genotypes (1.01 ± 0.01 versus 0.97 ± 0.01 in WT [n = 7] and C18 KO [n = 7] MAECMs, respectively). (G) Ion permeability was significantly higher in C18 KO compared with WT MAECMs (n = 7) for Na (***P < 0.001), Cl (*P < 0.05), and K (***P < 0.001).
Figure 4.
Figure 4.
Increased claudin and decreased occludin expression in C18 KO lungs and alveolar epithelial cells. (A) qRT-PCR analysis of whole lung shows that expression of claudin 3 mRNA is 1.8-fold higher in C18 KO versus WT mice. *P < 0.05. (B) Western blot analysis of whole lung demonstrates significantly greater (∼ 2-fold) expression of claudin 3 protein in C18 KO versus WT mice. ***P < 0.001. (C) Western blot analysis shows significantly greater (∼ 2-fold) expression of claudin 3 protein in freshly isolated AT2 cell membrane fractions derived from C18 KO versus WT mice. *P < 0.05. (D) Antibody staining for claudin 3 shows greater expression and membrane localization in C18 KO MAECM on Day 6 (confocal micrographs). (E) qRT-PCR analysis demonstrates significantly higher (∼ 4-fold) claudin 4 mRNA expression in C18 KO versus WT lungs. *P < 0.05. (F) Western blot analysis of claudin 5 expression in AT2 cell membranes demonstrates similar expression in WT and C18 KO mice. (G) Western blot analysis of occludin protein expression shows a significant decrease in whole lung samples from C18 KO mice. ***P < 0.001. (H) Confocal microscopy demonstrates lower levels of occludin localized at tight junctions in MAECMs derived from C18 KO mice.
Figure 5.
Figure 5.
Zonula occludens (ZO)-1 and ZO-2 expression and localization in WT and C18 KO mice. (A and B) Western blot analysis of whole lung membrane fractions for ZO-1 (A) and ZO-2 (B) shows similar expression levels in WT and C18 KO mice. (C) Immunofluorescence and confocal microscopy reveal increased distance between ZO-1 localization in adjacent cells in MAECMs from C18 KO compared with WT mice on Day 10 (confocal micrographs). Arrows indicate examples of gaps. (D) The distance between ZO-1 staining in adjacent alveolar epithelial cells was significantly higher in C18 KO compared with WT MAECM. *P < 0.05.
Figure 6.
Figure 6.
(See figure legend on following page) Cytoskeletal changes in C18 KO lungs and airway epithelial cells. (A) Log2 expression of genes in WT (x axis) versus C18 KO (y axis) mice. Green = genes down-regulated ≥ 2-fold; red = genes up-regulated ≥ 2-fold in C18 KO lung. (B) Ingenuity Pathway Analysis. Length of bars in graph indicates −log10 of Benjamini-Hochburg (BH) corrected P value for enrichment of indicated pathway. The dotted line indicates the threshold border of significance for enriched pathways. (C) Confocal micrographs show increased localization of F-actin to the plasma membrane in C18 KO MAECMs by phalloidin staining. Areas magnified and shown in the lower panels are indicated by rectangles. Lower panels show z-stacks and distinct F-actin staining close to the plasma membrane in C18 KO cells. (D) Z-max image (combined fluorescent signal in all z-planes) demonstrating perinuclear F-actin aggregates (indicated by arrows) and radial fibers.
Figure 7.
Figure 7.
Decreased sensitivity of C18 KO mice to ventilator-induced lung injury. (A) Protein concentration in bronchoalveolar lavage (BAL) fluid was measured in untreated (naive) mice and in mice ventilated under noninjurious or injurious conditions. Under injurious conditions, BAL protein concentration in WT mice was significantly (*P < 0.05) higher (1.02 ± 0.27 mg/ml; n = 3) compared with C18 KO mice (0.53 ± 0.06 mg/ml; n = 3). (B) qRT-PCR analysis in whole lung shows a 22.5-fold decrease in Egr1 mRNA expression levels in C18 KO mice (***P < 0.001).

Similar articles

Cited by

References

    1. Tsukita S, Furuse M, Itoh M. Multifunctional strands in tight junctions. Nat Rev Mol Cell Biol. 2001;2:285–293. - PubMed
    1. Flodby P, Borok B, Crandall ED, Kim KJ. Claudins and Barrier Function of the Lung. In: Yu ASL, editor. Claudins. Philadelphia: Elsevier; 2010. pp. 177–194.
    1. Van Itallie CM, Anderson JM. Claudins and epithelial paracellular transport. Annu Rev Physiol. 2006;68:403–429. - PubMed
    1. Chen SP, Zhou B, Willis BC, Sandoval AJ, Liebler JM, Kim KJ, Ann DK, Crandall ED, Borok Z. Effects of transdifferentiation and EGF on claudin isoform expression in alveolar epithelial cells. J Appl Physiol (1985) 2005;98:322–328. - PubMed
    1. Mitchell LA, Overgaard CE, Ward C, Margulies SS, Koval M. Differential effects of claudin-3 and claudin-4 on alveolar epithelial barrier function. Am J Physiol Lung Cell Mol Physiol. 2011;301:L40–L49. - PMC - PubMed

Publication types

MeSH terms