

Review
doi: 10.1021/cr400327t.
Epub 2014 Mar 3.
Copper active sites in biology
Affiliations
- PMID: 24588098
- PMCID: PMC4040215
- DOI: 10.1021/cr400327t
Item in Clipboard
Review
Copper active sites in biology
Chem Rev.
.
No abstract available
Figures
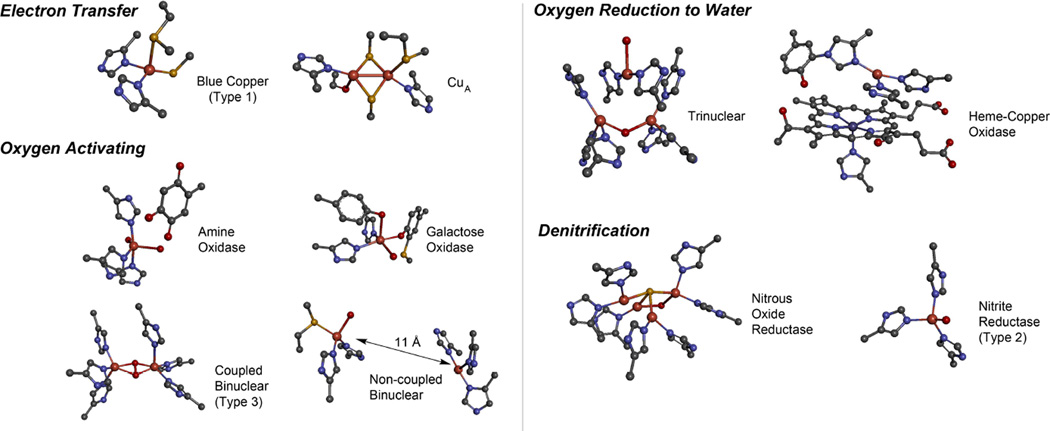
Copper active sites in biology.
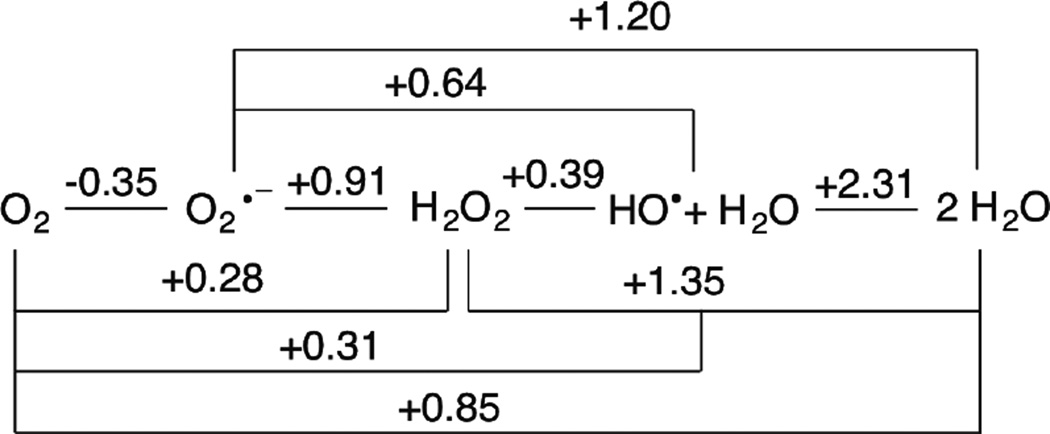
Latimer Diagram for Oxygen Reduction at pH = 7.0 Adapted from References and .
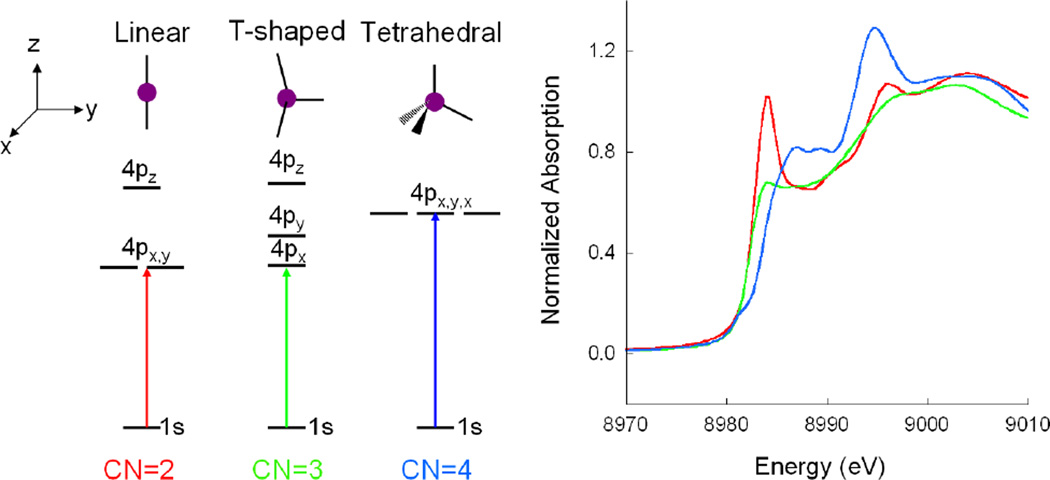
(Left) Ligand field splitting of Cu(I) 4p orbitals as a function of site geometry. (Right) K-edge XAS of two-coordinate Cu(I) [Cu2(EDTB)](ClO4)2 (red), three-coordinate Cu(I) [Cu(L1-pr)](BF4) (green), and four-coordinate Cu(I) [Cu(py)4]ClO4 (blue). (Reprinted with permission from Ref. . Copyright 1987 American Chemical Society.)
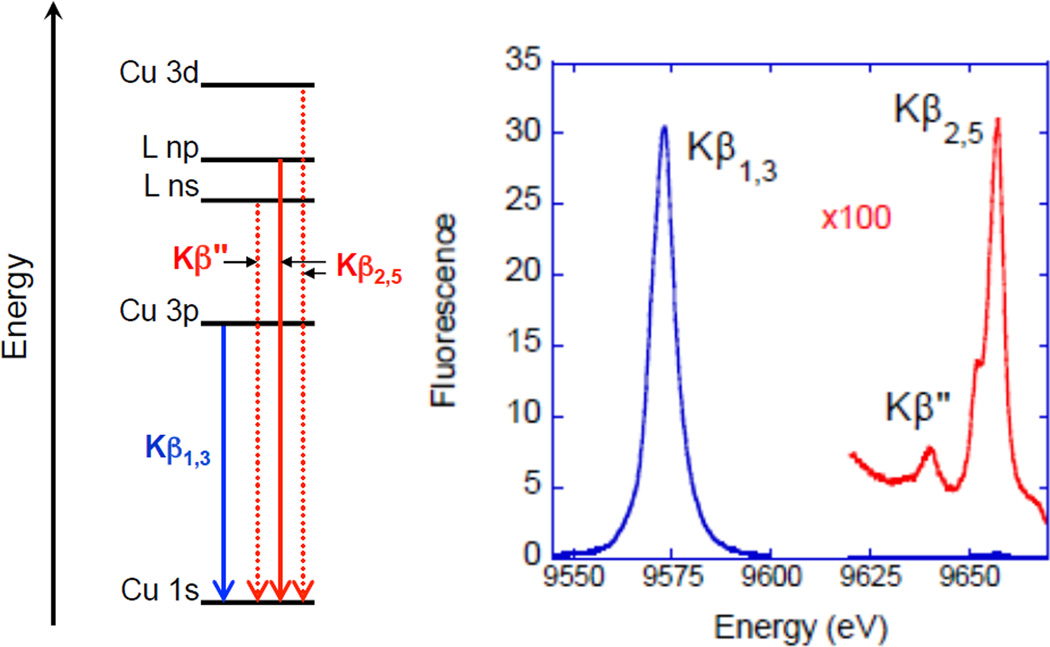
(Left) Schematic of Cu K-β emission. The ligand ns and np (where n=2,3 depending on ligand type) to metal 1s transitions occur via LMCT. L(np) and L(ns) = ligand p and s hole, respectively. (Right) XES of ZnO (a d10 system).
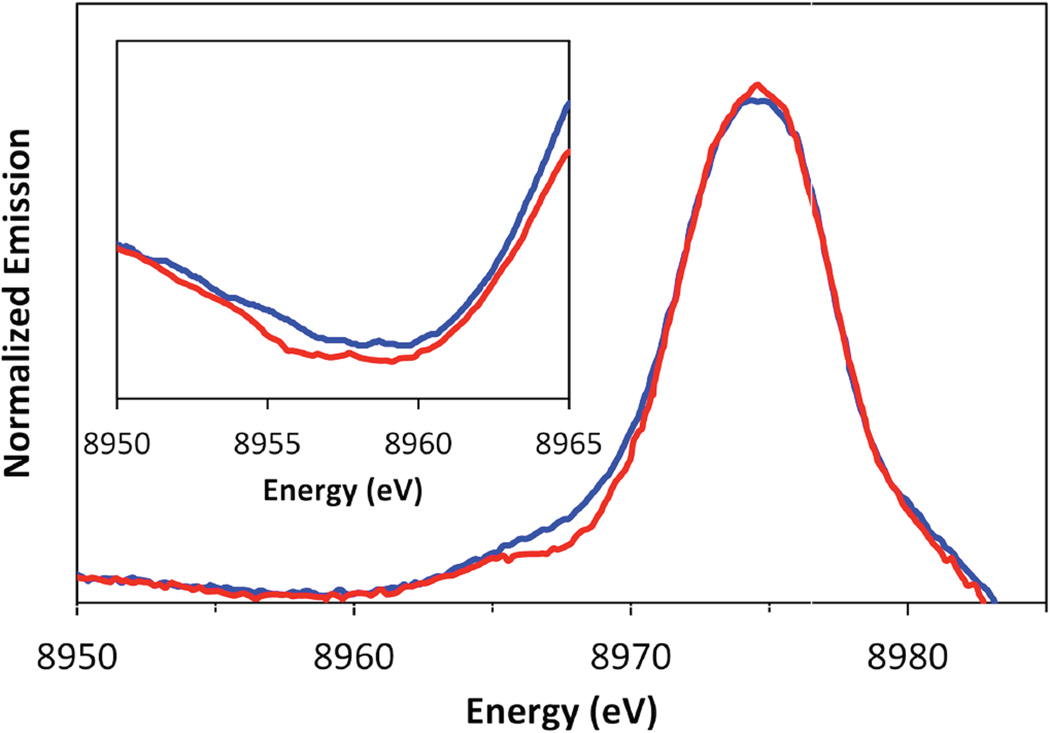
XES spectra showing the satellite region of d9 Cu(II) complexes.
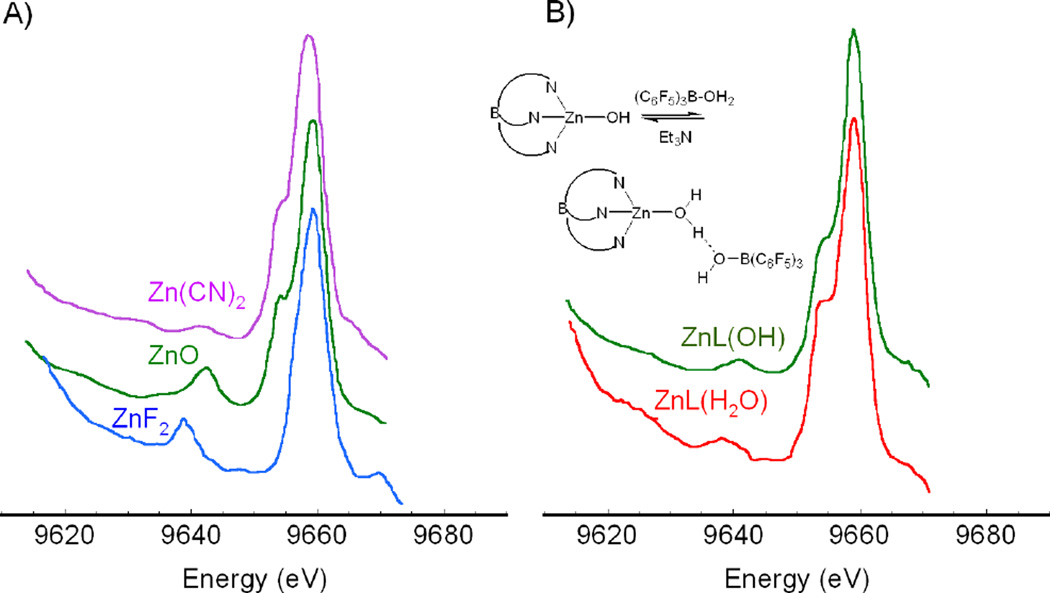
XES spectra showing the valence region of different d10 Zn2+ complexes. (A) Ligation to Zn is varied from C, O, to F. (B) Ligation to Zn is changed from H2O to OH−. (Used with permission from Ref. .)
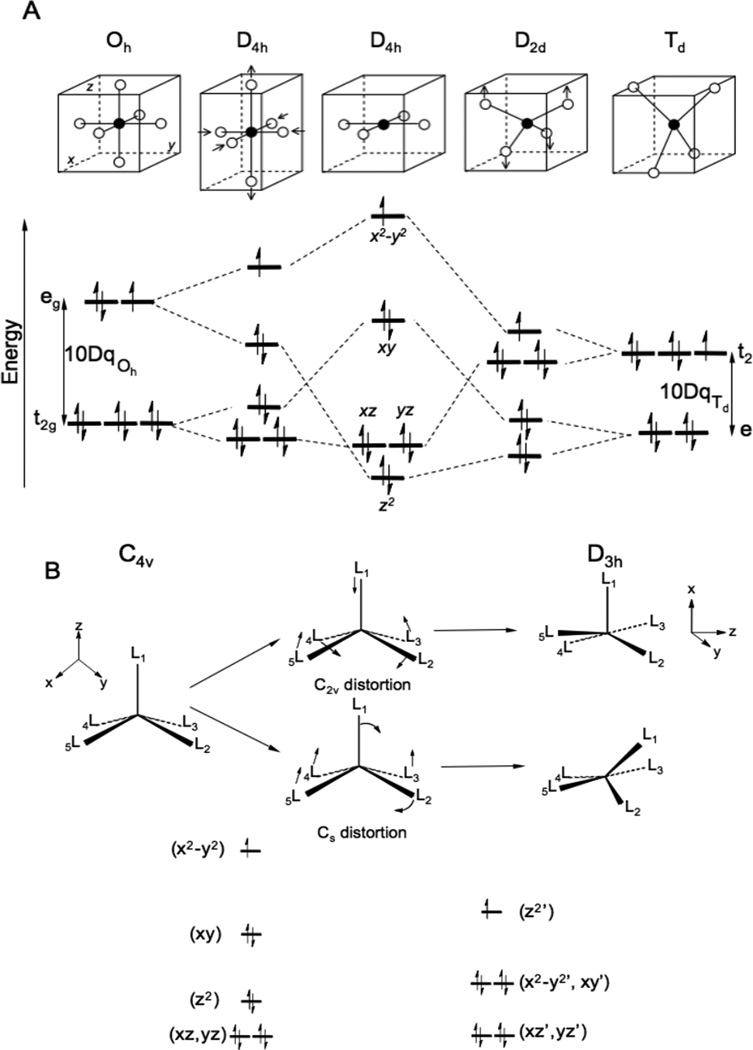
Ligand Field Splitting of the d manifold. A. Octahedral to square planar to tetrahedral. B. Square pyramidal to trigonal byparimidal. Rearrangements through Berry pseudorotation (C2v) and associated ligand displacement (Cs) coordinates.
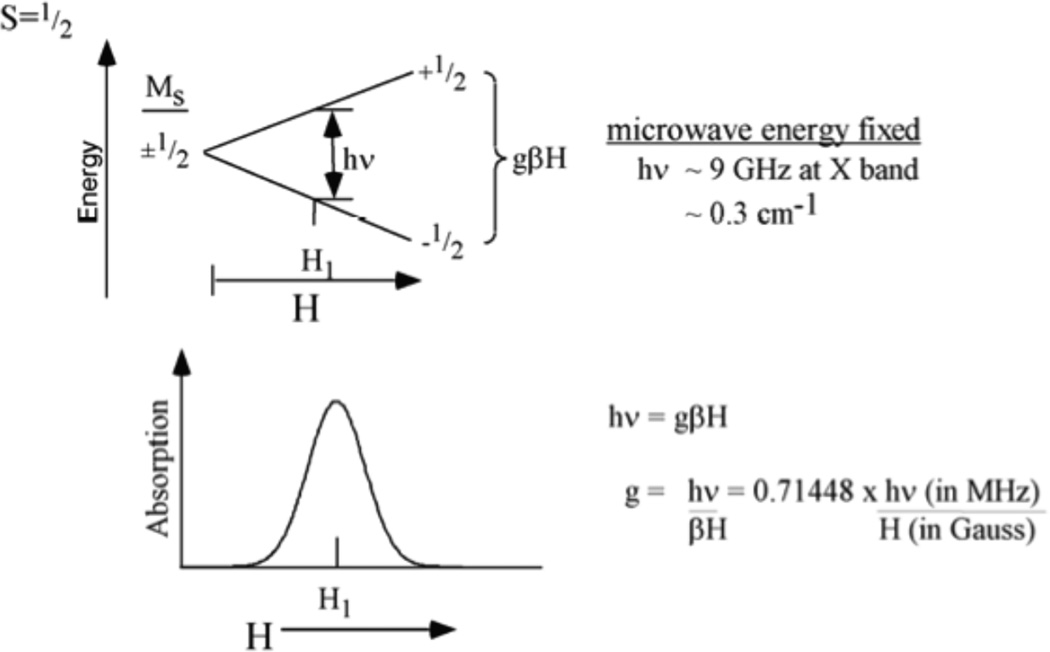
Zeeman effect on an S=1/2, MS =±1/2 system. The degenerate MS values split in a magnetic field by gβHMS. This splitting equals the microwave energy hν, at a magnetic field where microwave absorption occurs.
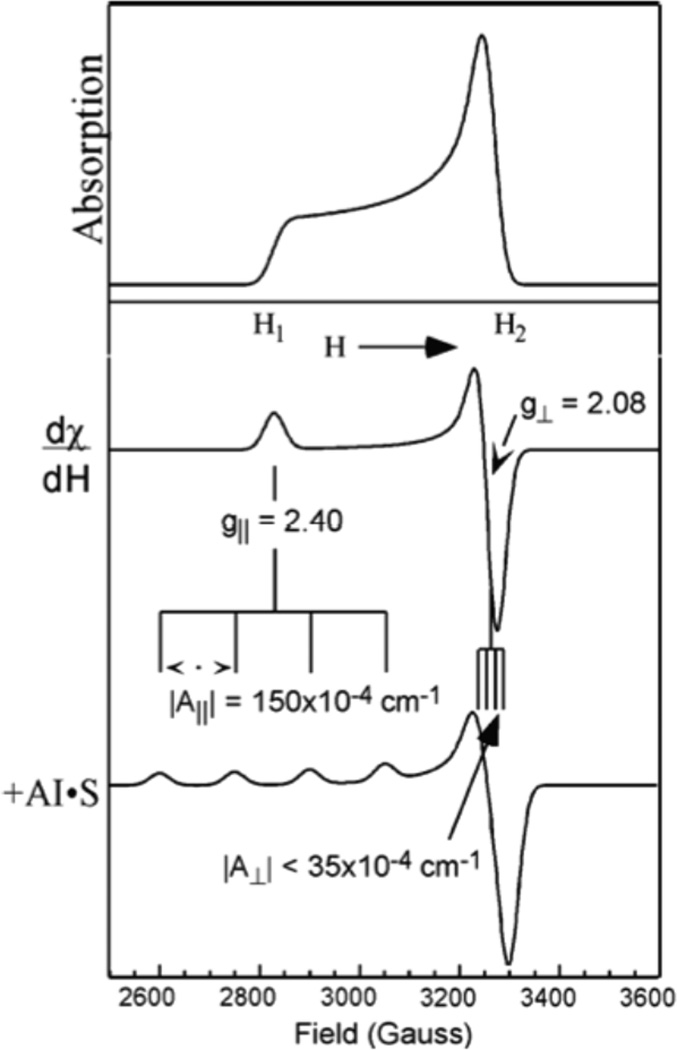
(top) A frozen solution EPR spectrum gives a powder pattern with all orientations (g||(H1)→g⊥(H2)) weighted by the number of molecules with specific orientations. Thus the intensity increases towards the field associated with the perpendicular direction. (middle) The EPR spectrum is taken as the first derivative to enhance sensitivity. (bottom) Anisotropic hyperfine coupling of the electron spin to the Cu nucleus spin I=3/2.

Delocalization of the electron spin onto the ligand Li by an amount . The ligand valence orbital is a hybrid with s and pz character.
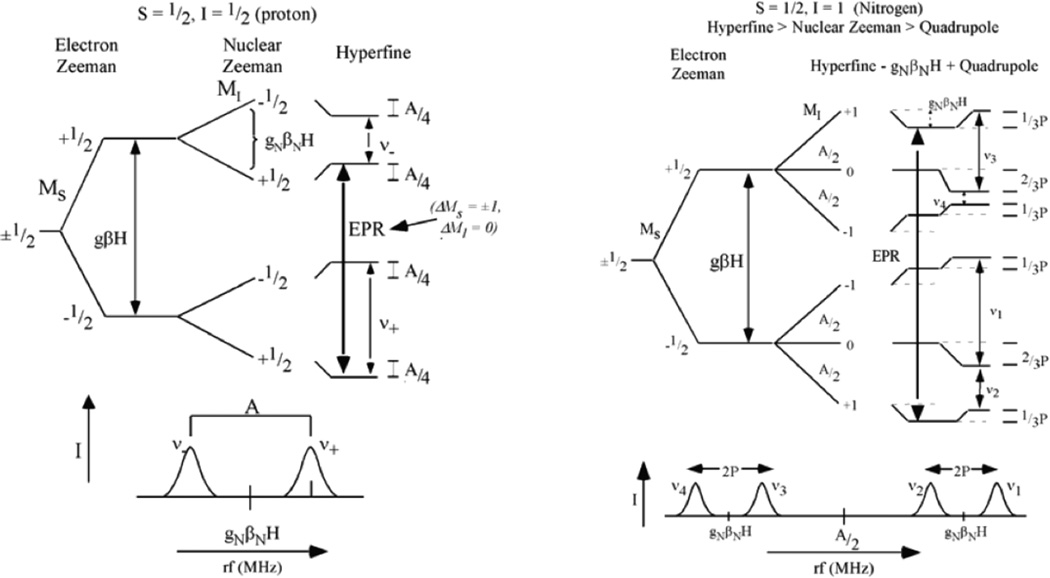
ENDOR experiment for an S=1/2, MS = ±1/2 metal site. Left, Levels for protons (I =1/2, nuclear Zeeman large related to metal-ligand hyperfine) and Right, levels for other nuclei (in particular N, I = 1, nuclear Zeeman smaller than metal-ligand hyperfine coupling).
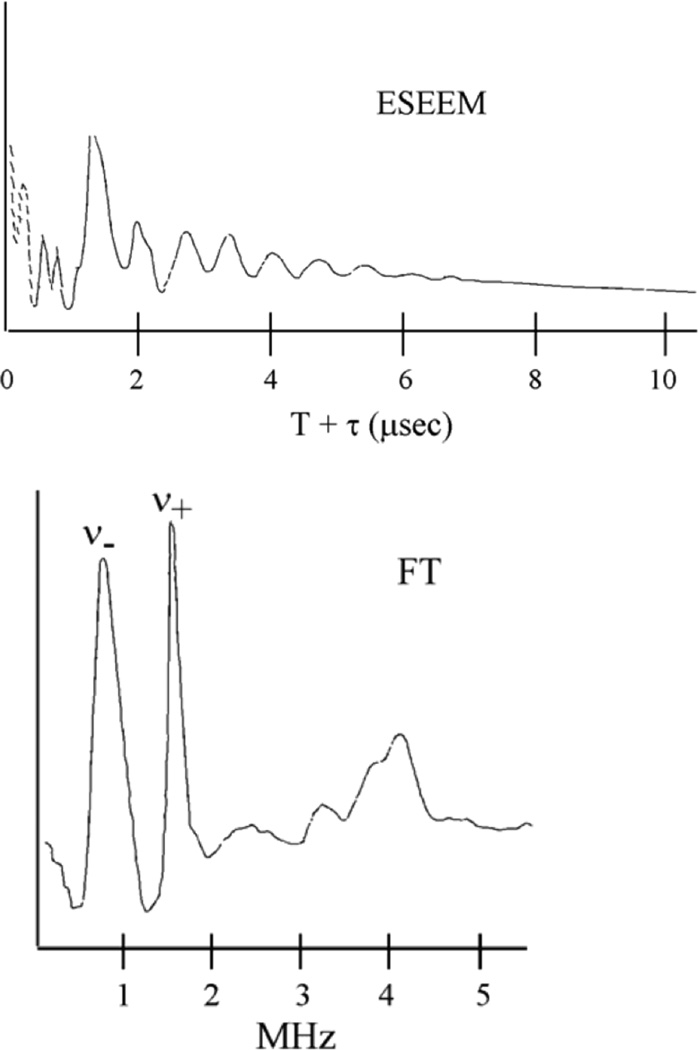
The ESEEM spectrum: (top) Modulated decay of the spin echo and (bottom) The Fourier Transform of the modulation.,
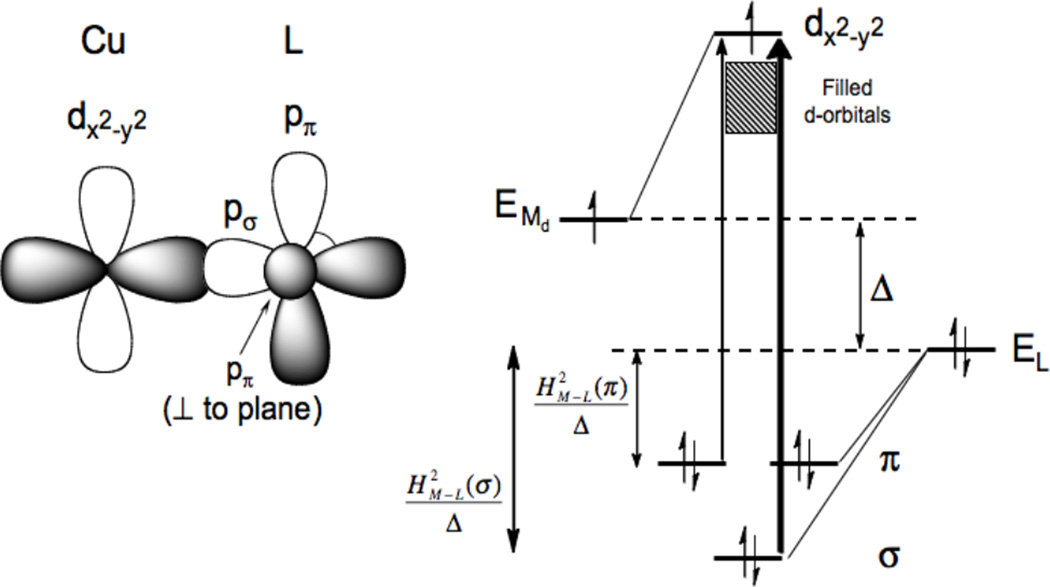
The differences in σ and π overlap between the ligand and the copper valence orbitals leads to low energy weak π and higher energy intense σ charge transfer transitions.
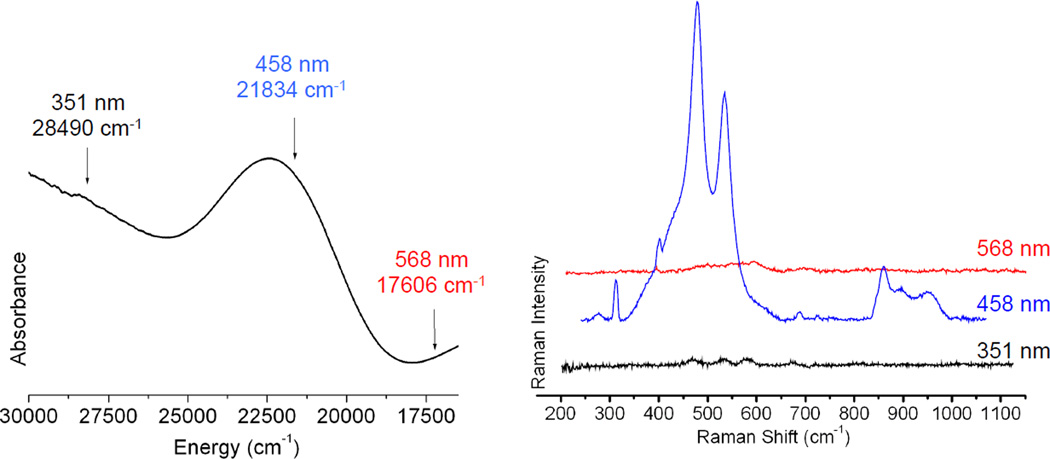
Resonance Raman spectroscopy: Excitation energy dependence of resonance intensity gives the excitation profile. (Reprinted with permission from Ref. )
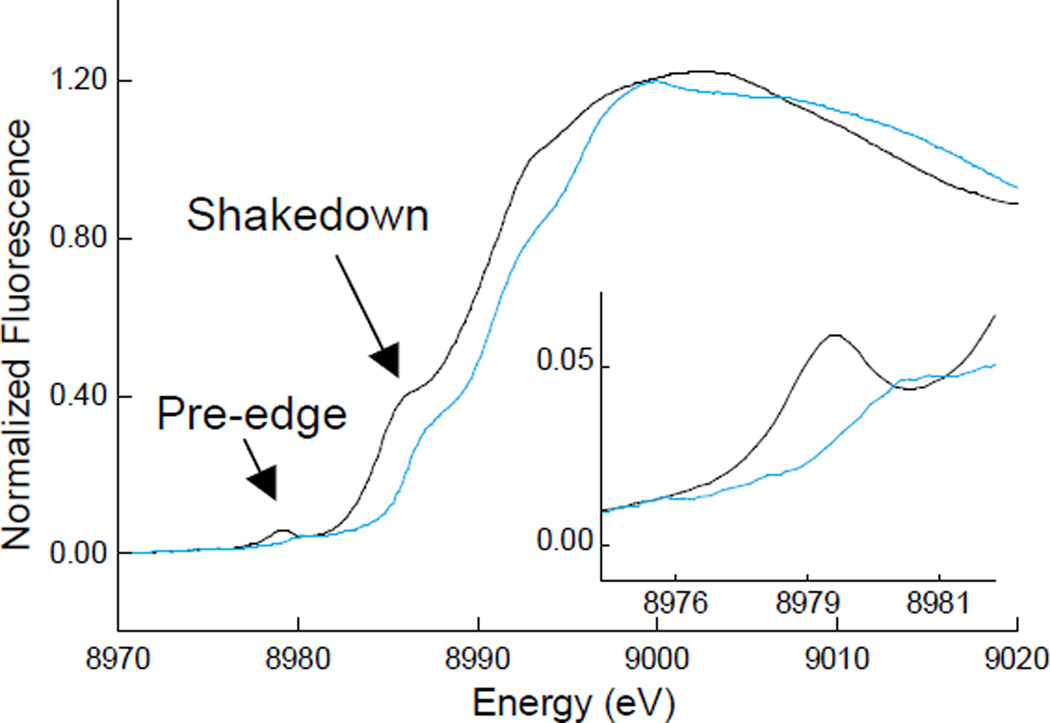
Cu K-edge spectra of CuII (black line) and CuIII (blue line) model complexes. The inset amplifies the pre-edge region.
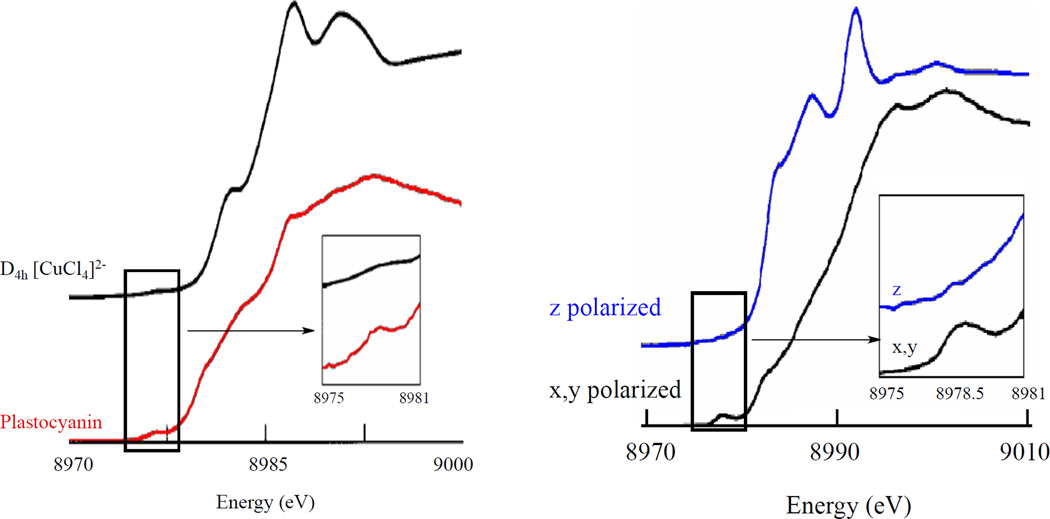
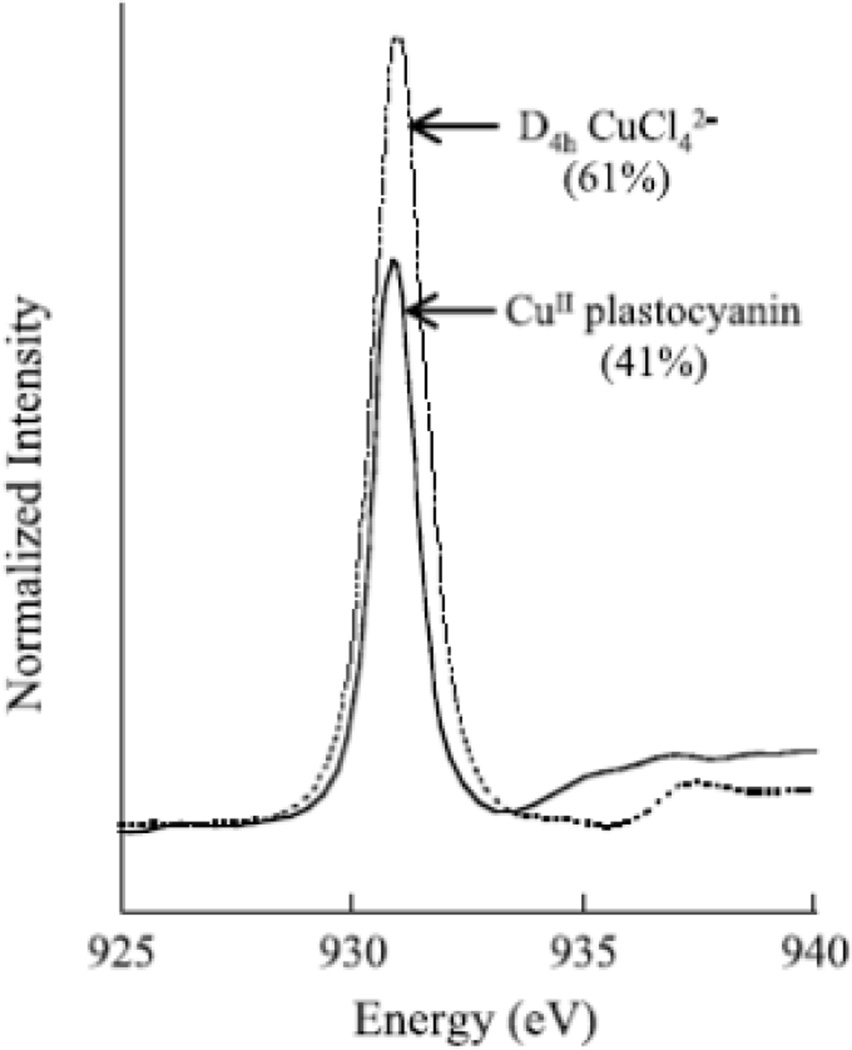
(Left) Orientation averaged Cu K-edge spectra of D4h CuCl42− and plastocyanin. Insets show the expanded pre-edge region.(Right) Polarized Cu K-edge spectra of plastocyanin. Inset shows the expanded pre-edge region. (Reprinted with permission from Ref. . Copyright 1993 American Chemical Society.)

Configuration interaction formalism for the Cu K-edge near-edge analysis. A) Ground-state wave functions determined by T and Δ parameters. B) Final-state wave functions with the 1s→4p + LMCT shakedown final-state (Ψs) separated from the main 1s→4p final-state (Ψm) by the splitting W.
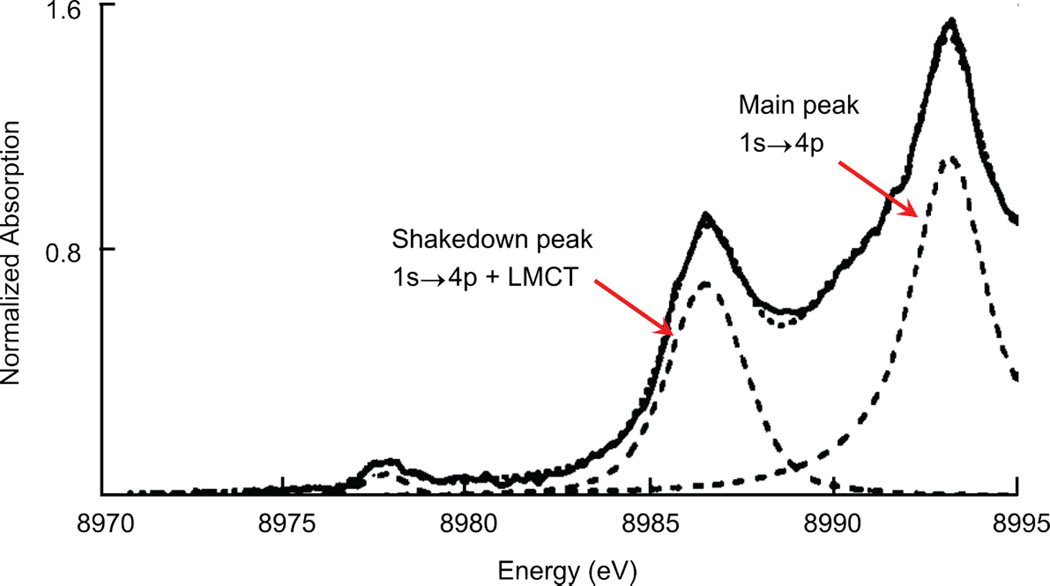
Z-polarized Cu K-edge spectra of D2d CuCl42−. Data (—) and fit (····). The intensity of the main transition is not well established due to the rising-edge background. (Reprinted with permission from Ref. . Copyright 1993 American Chemical Society.)
Cu L3-edge XAS spectra for D4h-CuCl42− and plastocyanin. Values listed are the amount of Cu d character in the half occupied HOMO. (Reprinted with permission from Ref. . Copyright 1993 American Chemical Society.)
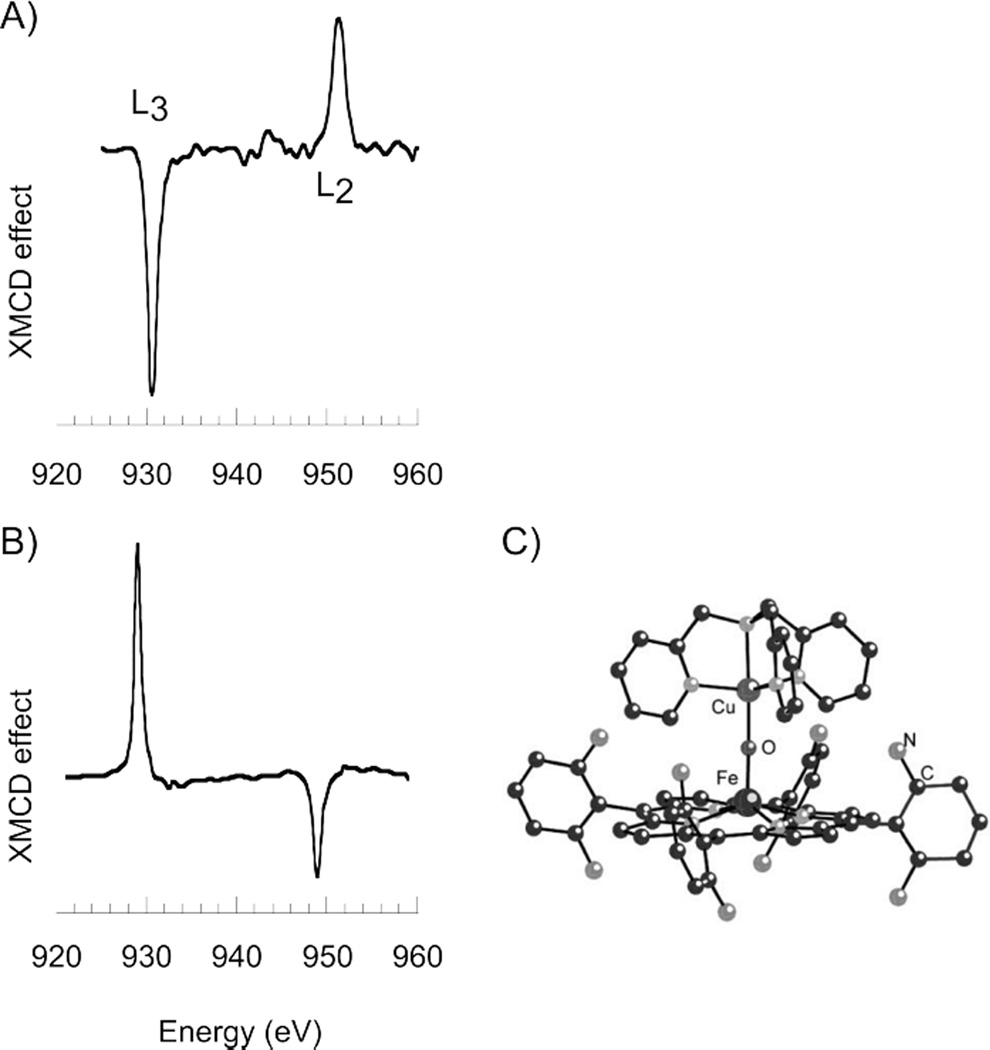
Cu L-edge XMCD spectra for A) mononuclear blue Cu site in plastocyanin measured at ~0.3 K, and B) Cu center in [(F8TPP)FeIII-O-CuII(TMPA)](ClO4) heme-Cu dimer measured at 2.2 K. C) Structure of [(F8TPP)FeIII-O-CuII(TMPA)](ClO4) heme-Cu dimer. (Reprinted with permission from Ref. . Copyright 2004, American Institute of Physics.)
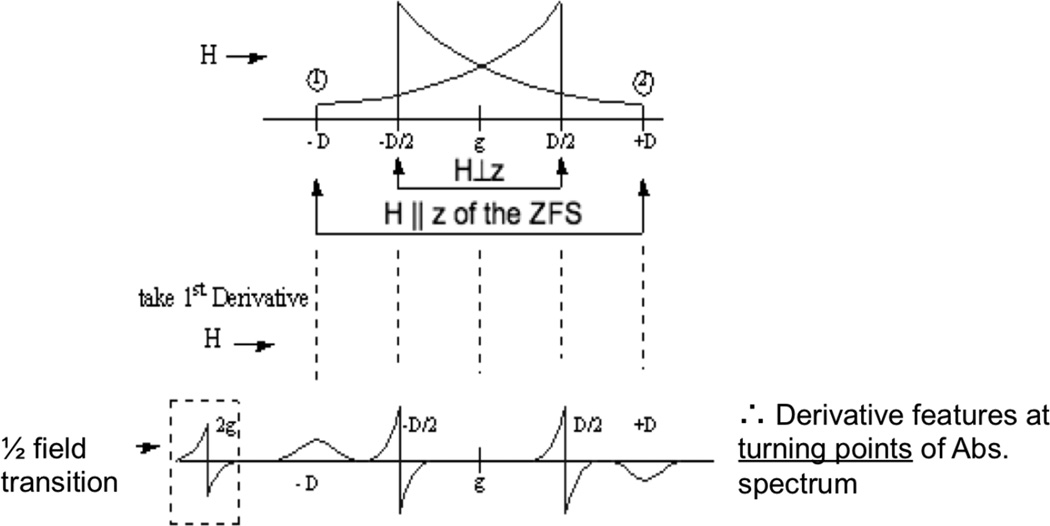
EPR spectrum of an S=1 system including the characteristic ΔMS =2 transition and the Zero Field Splitting D of the ΔMS =1 transition which are anisotropic.
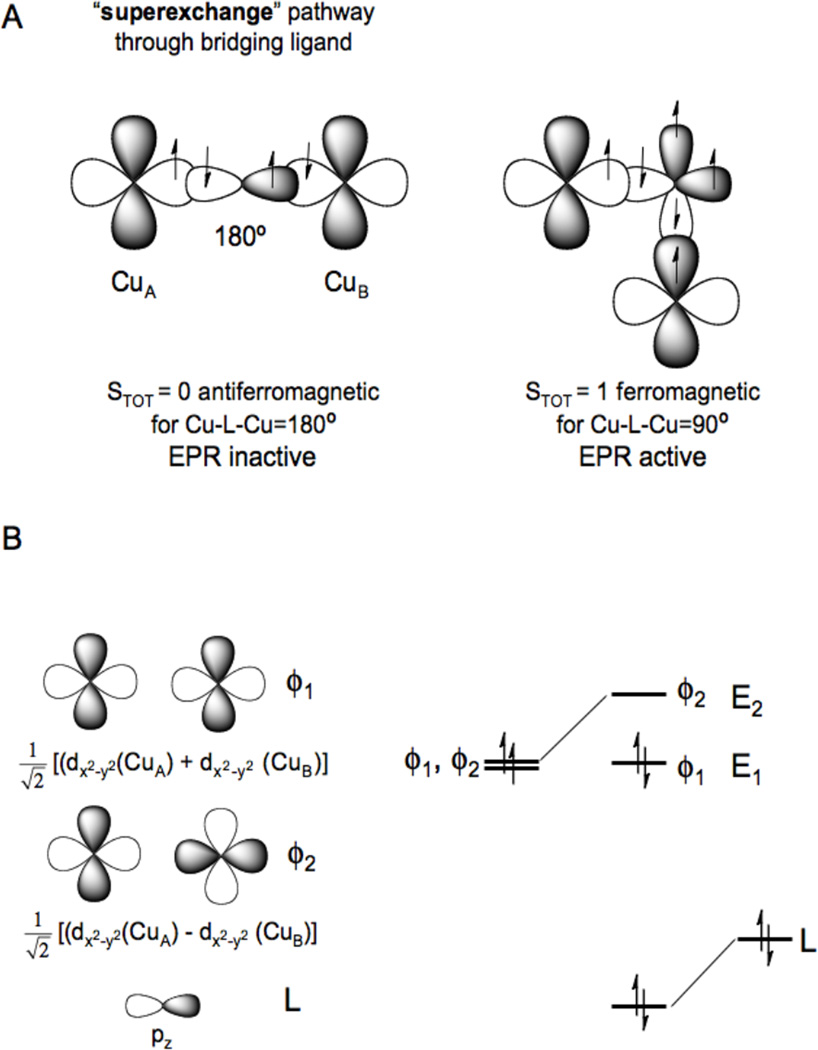
A) Magnetic couplings due to superexchange pathways (magnetic orbital overlap (left), orthogonal magnetic orbitals (right)) and B) molecular orbital origin of antiferromagnetism.
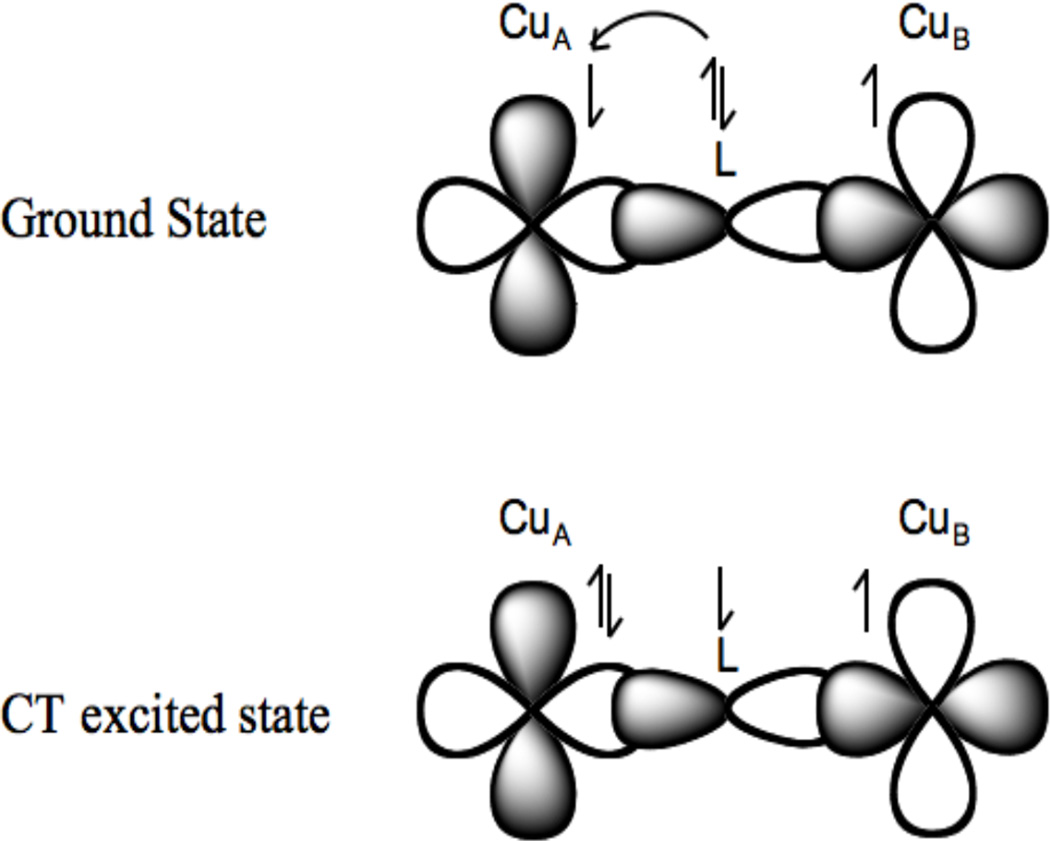
Charge transfer transitions of bridging ligands: Large charge transfer excited state antiferromagnetically coupling. This mixing into the ground state through covalency leads to the antiferromagnetic coupling in the ground state.
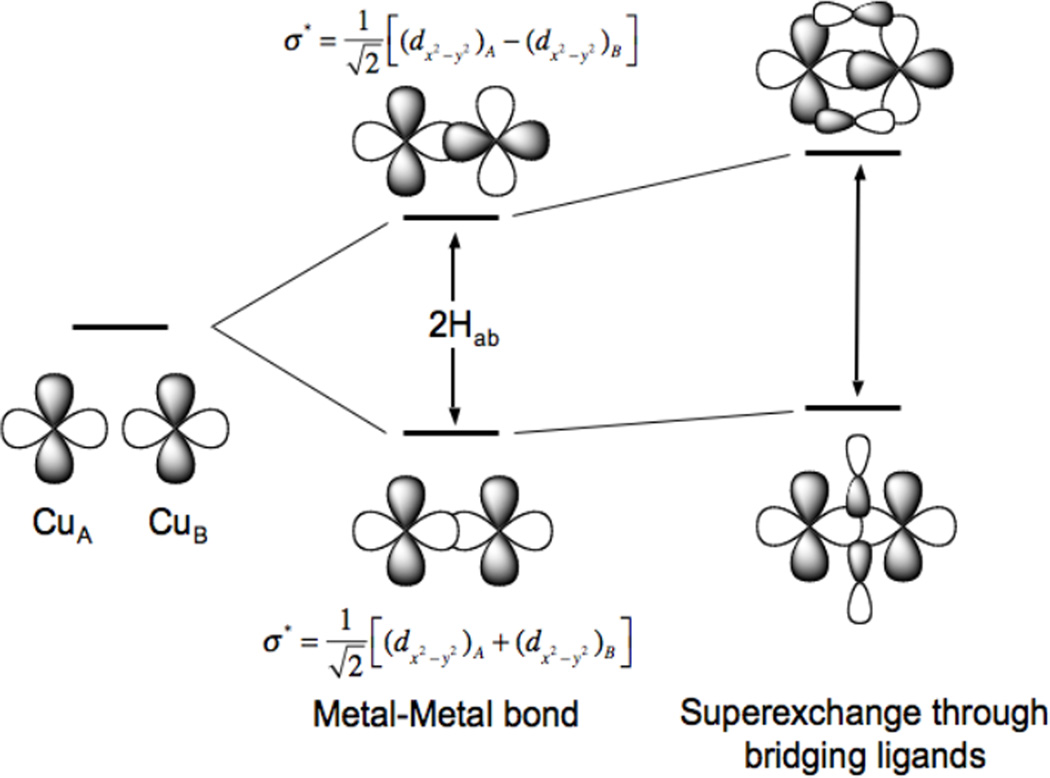
Delocalization in mixed-valent systems is due to the electronic coupling matrix element HAB associated with the direct bonding interaction between two metal ions and their superexchange interaction through bridging ligand orbitals.
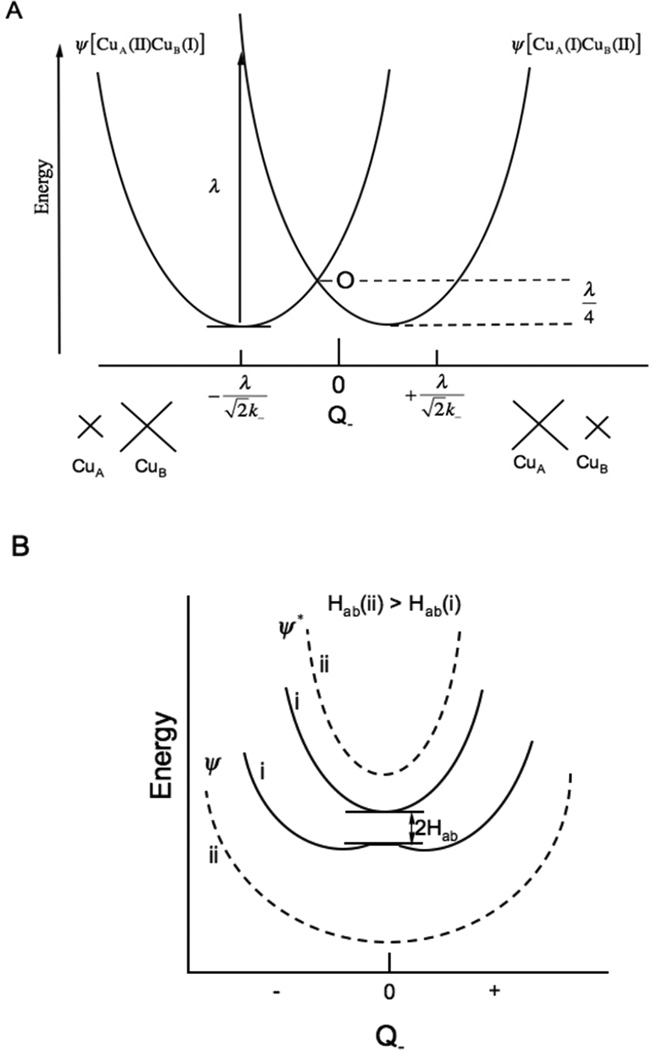
Mixed valence interactions. A) Two non-interacting potential energy surfaces, (left hole on CuA, right for hole on CuB) and their associated distortions in the Q- mode. B), inclusion of electronic coupling between the two Cu’s (HAB(i)) solid lines << HAB(ii) dashed lines).
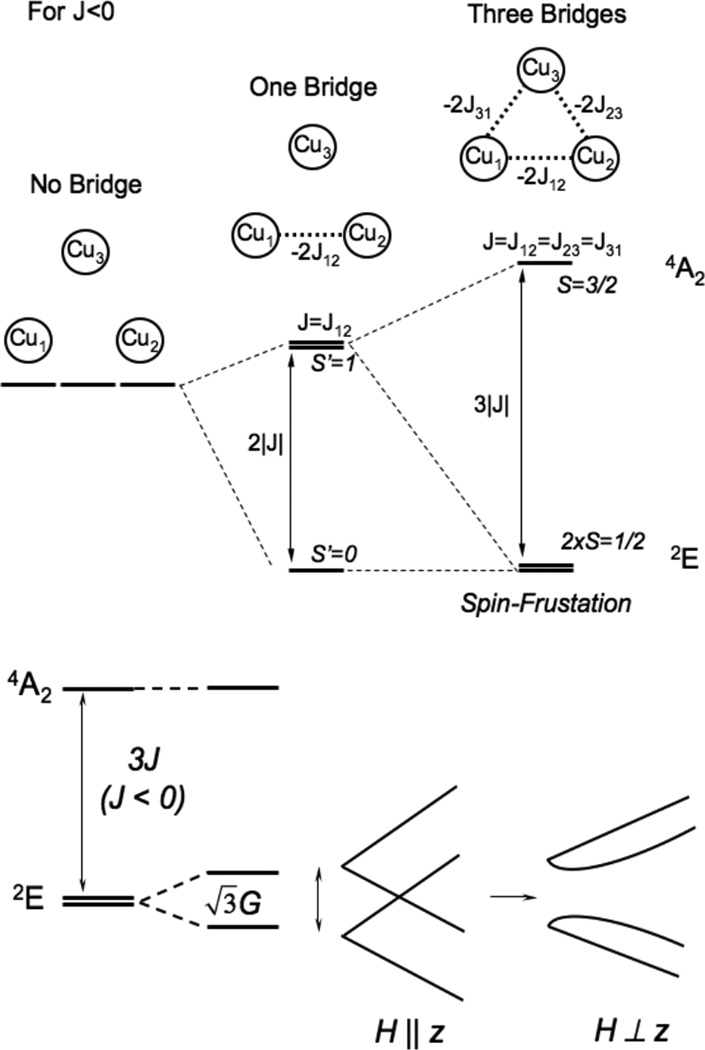
(top) Energy diagram of an antiferromagnetically coupled Cu(II) trimer (all J<0) with zero, one and three equivalent bridging ligands. (bottom) The ZFS of the spin frustrated 2E ground state due to antisymmetric exchange and the effects of a magnetic field on these ground state sublevels. (Reprinted from Ref. , with permission from Elsevier.)
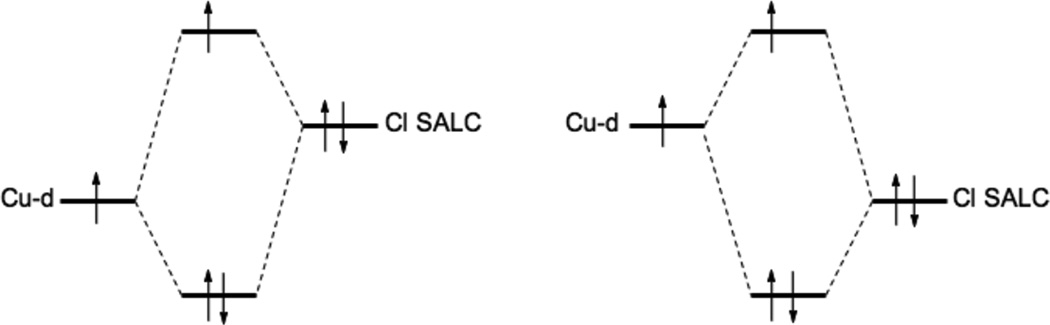
Molecular Orbital diagram of the CuII-Cl− bond. Left, too covalent description of the pure BP86 functional. Right, d-manifold destabilized through a more ionic bond description. Cl SALC abbreviates the Chloride symmetry adapted molecular orbitals.
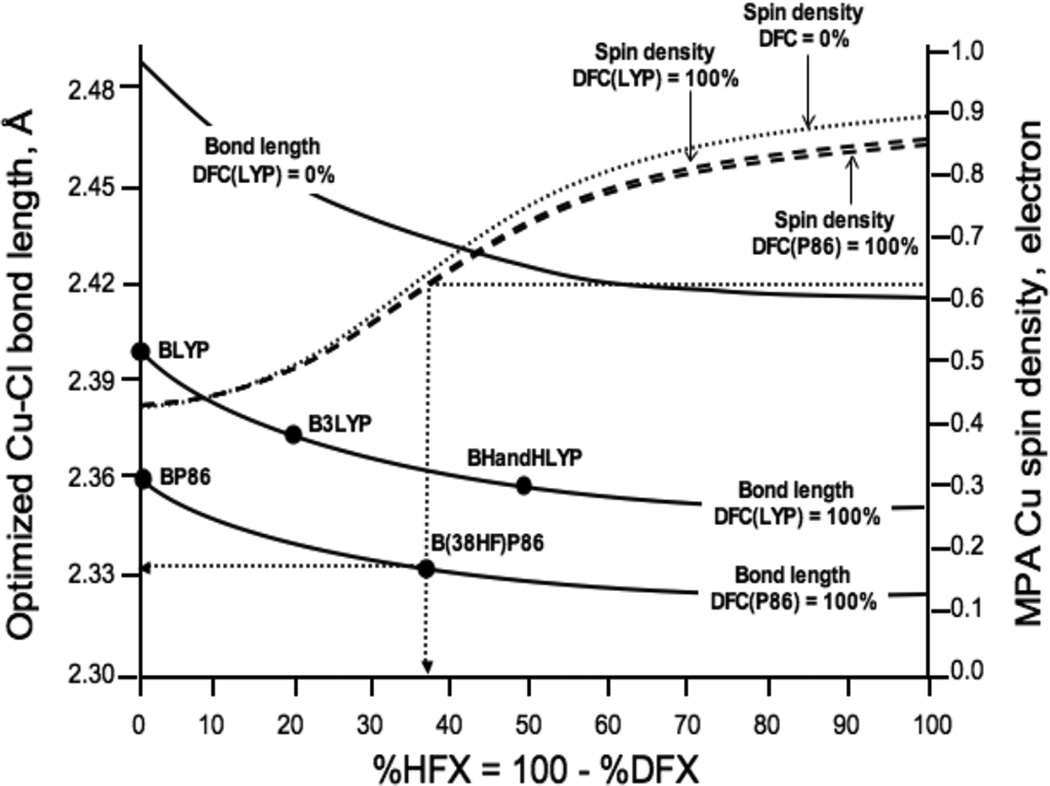
Optimized Cu-Cl bond lengths (Å) and Mulliken Population Analysis (MPA) Cu spin densities (electron) in D4h [CuCl4]2− at maximal and minimal density functional correlation limits using saturated triple-ζ basis set.
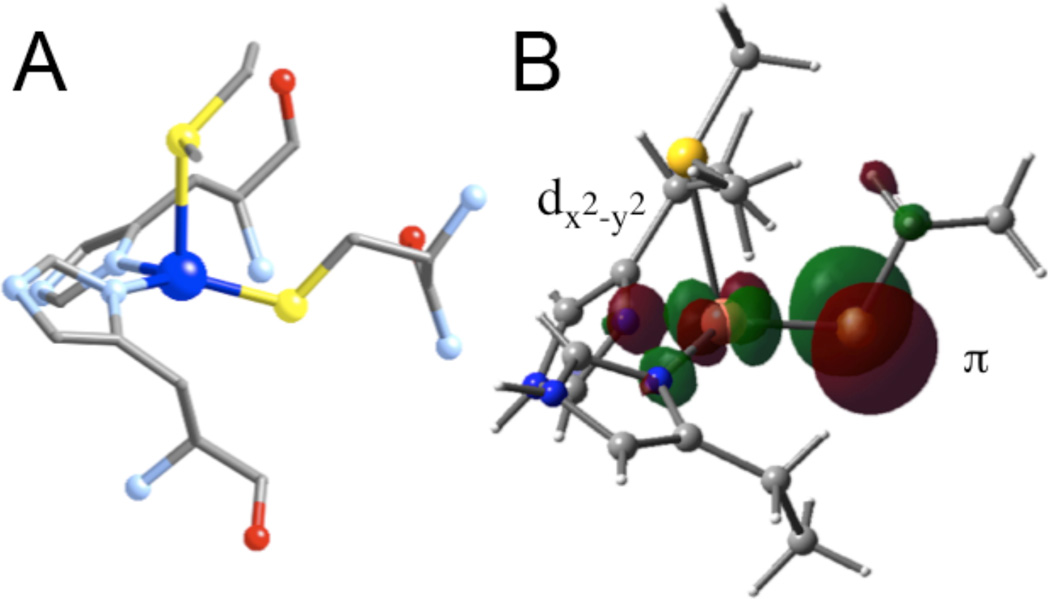
A. Active site of Plastocyanin, showing the short Cu-S bond (equatorial) and the long Cu-S bond from the thioether (axial). B. Ground state wavefunction (β-LUMO) of a blue Cu site.
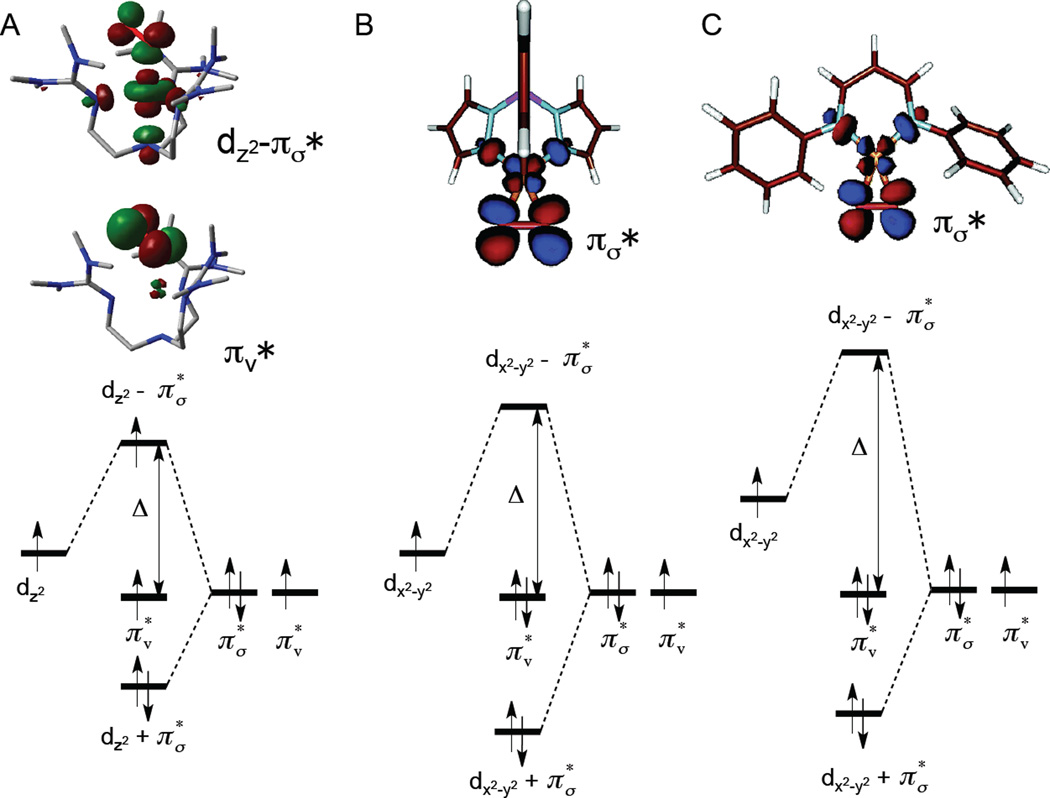
Molecular orbital diagrams. A and B, Cu(II)-superoxo; C, Cu(III)-peroxo. A, end-on triplet; B and C side-on singlet. Representative MO’s are shown at the top.
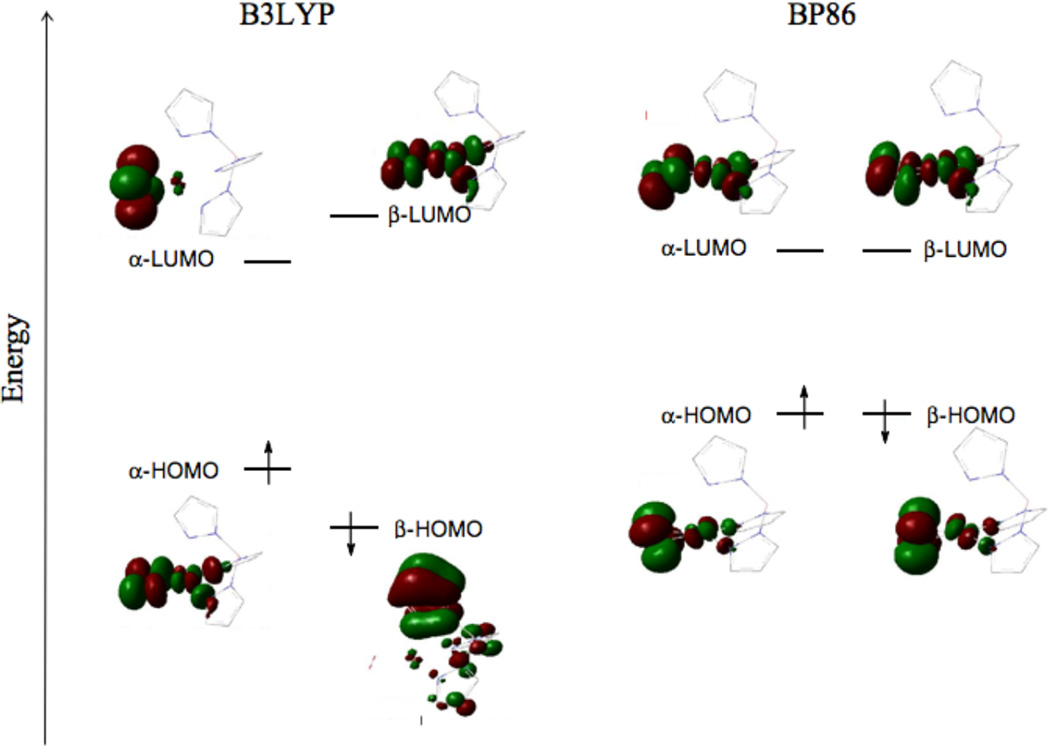
Isocontours for the lowest singlet state, side-on bound superoxo-Cu(II), hydrotris(3-tertbutyl-5-isopropyl-1-pyrazolyl)-borate CuO2 with B3LYP (left) and BP86 (right) functionals.
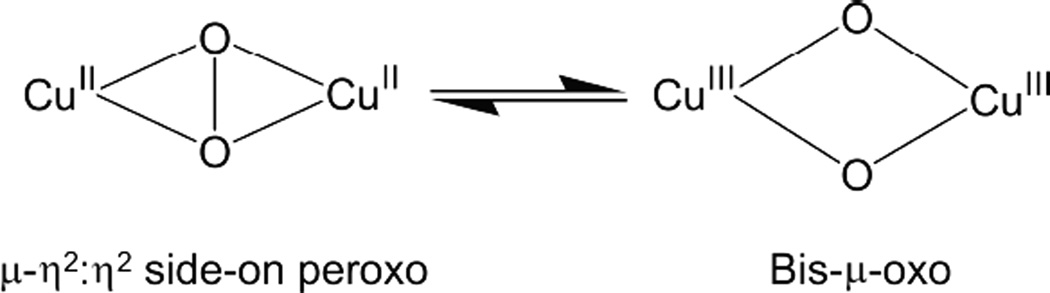
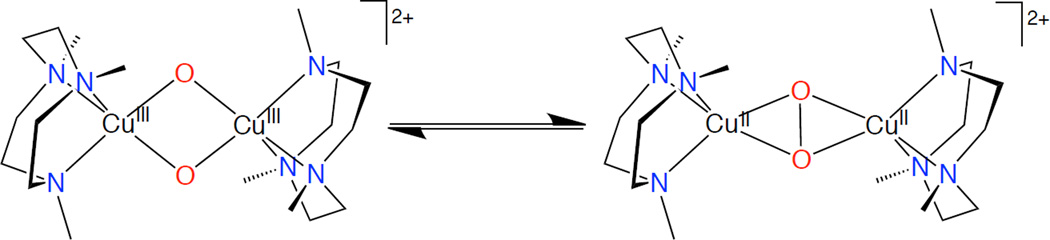
Equilibrium between μ-η2: η2 side-on peroxo Cu(II)2 and bis-μ-oxo species Cu(II)2
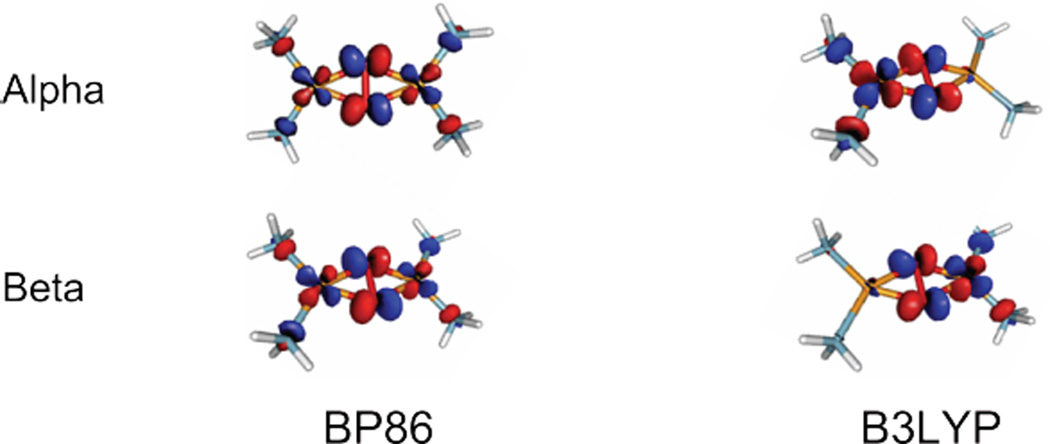
Isocontours (0.05) of μ-η2: η2 side-on peroxo Cu(II)2 LUMO calculated using BP86 (left) and B3LYP (right).
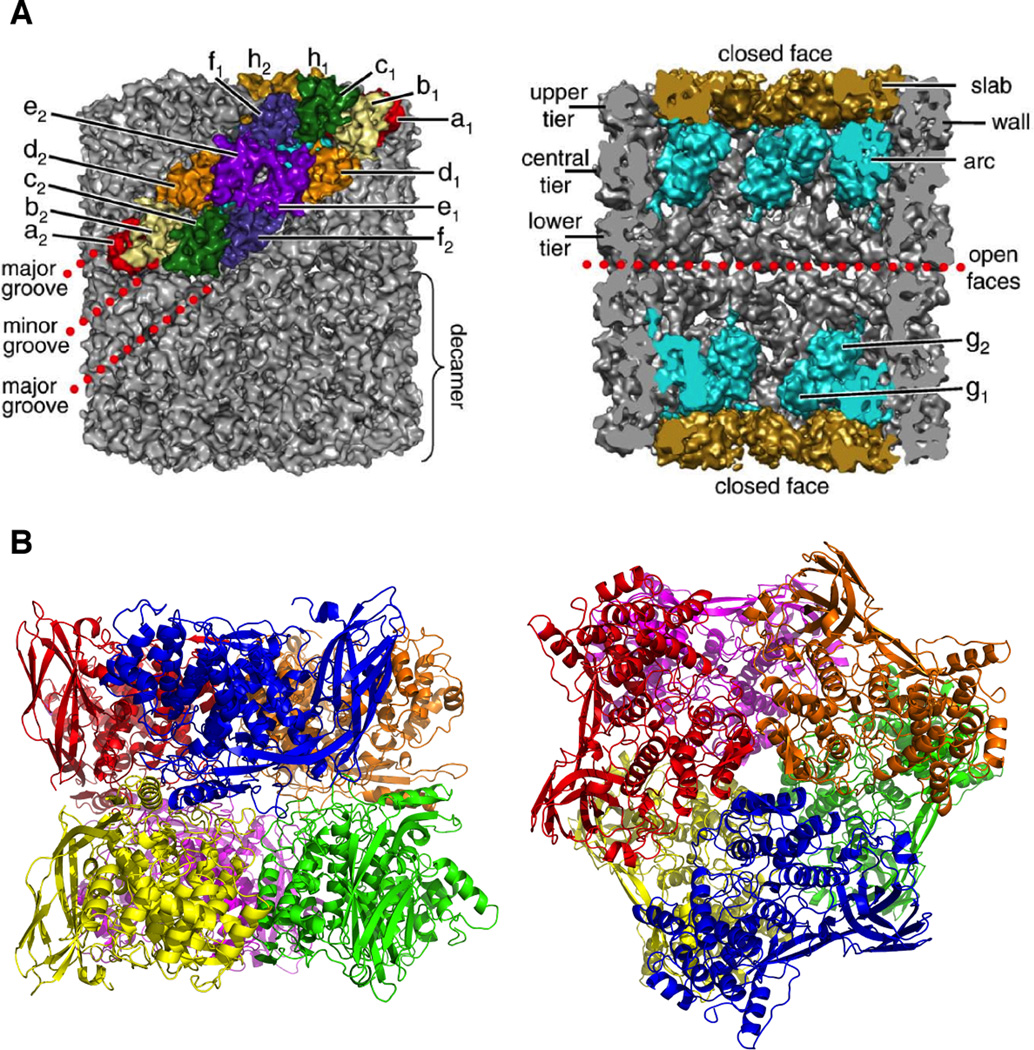
Quarternary structure of mollusc and arthropod Hc. A molecular model determined from cryo-electron microscopy of a decamer of Keyhole Limpet Hc (A) illustrates the subunit order within the wall of the cylinder. A cutout from the center of the cylinder (right) reveals the position of subunit g (light blue) in the arc and subunit h (gold) in the slab. The hexameric structure of arthropod Hc (B) is arranged as a trimer of dimers (viewed from the top on right) with each functional unit as a unique color. The tight dimmer interface (viewed from the side-on the left) is between the blue and yellow subunit while the loose dimmer interface is between the blue and green subunit. (Reprinted from Ref. , with permission from Elsevier.)
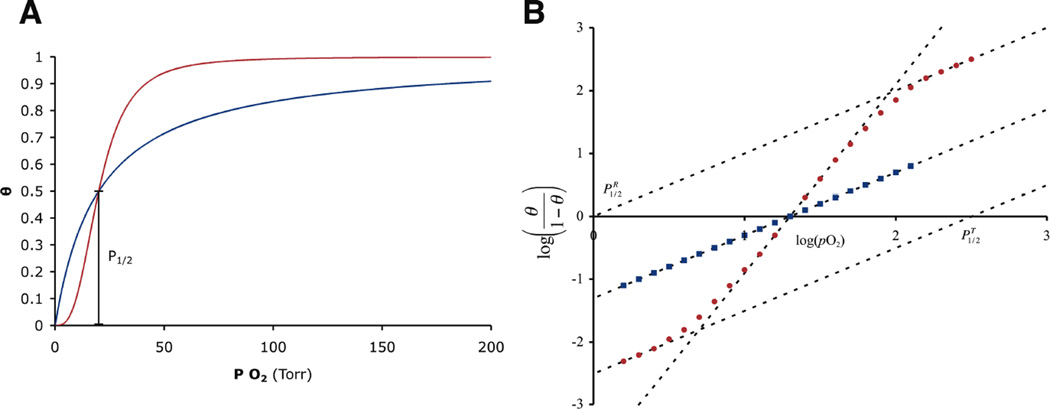
(A) The fraction of bound sites (θ) is plotted as a function of the O2 pressure for a cooperative (red, n = 3) and non-cooperative (blue) protein that both have the same O2 affinity. (right) An example Hill plot (B) for a Hc with a P1/2 of 20 torr that lacks cooperativity and a cooperative protein with the same affinity and n = 3.
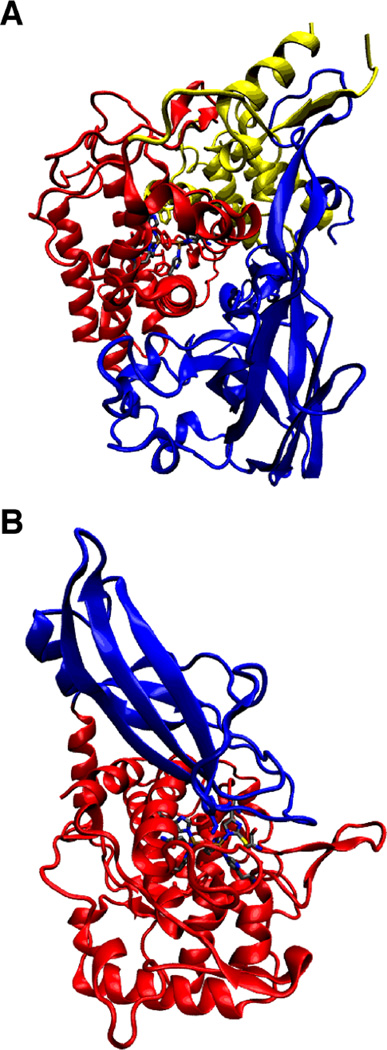
The tertiary structure of the Hc functional units for the arthropod L. polyphemus (A) with the α-helical domain one that shields the four helix bundle of domain two (in red) and the β-barrel of domain three in blue. The mollusc tertiary structure from E. dofleini (B) is divided into two domains: the copper binding domain one in red and the β-barrel of domain two in blue (PDB 1NOL (A) and 1JS8 (B)).
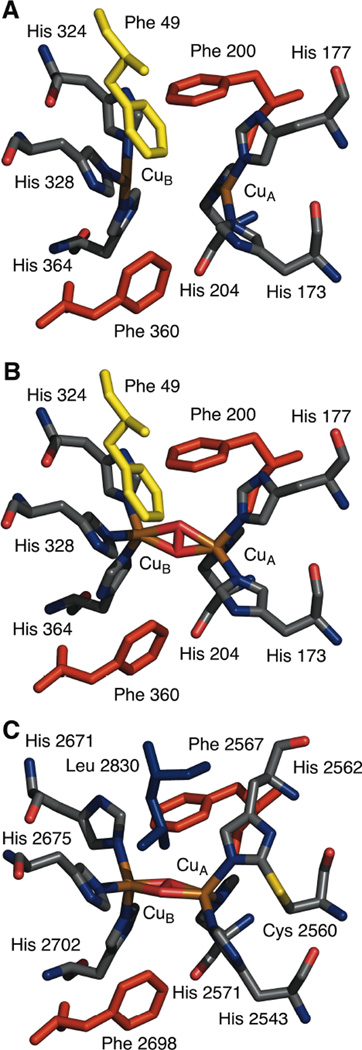
A comparison between the deoxy (A) and oxy (B) Hc from L. polyphemus show a large geometric change at the active site upon oxygen binding (the Cu-Cu distance shortens by 1.0 Å). While the overall topology of the active site in Hc is conserved, differences between oxy-Hc from the arthropod L. polyphemus (B) and the mollusc E. dofleini (C) can be observed especially at the CuA site. (PDB 1LLA (A), 1NOL (B), and 1JS8 (C))
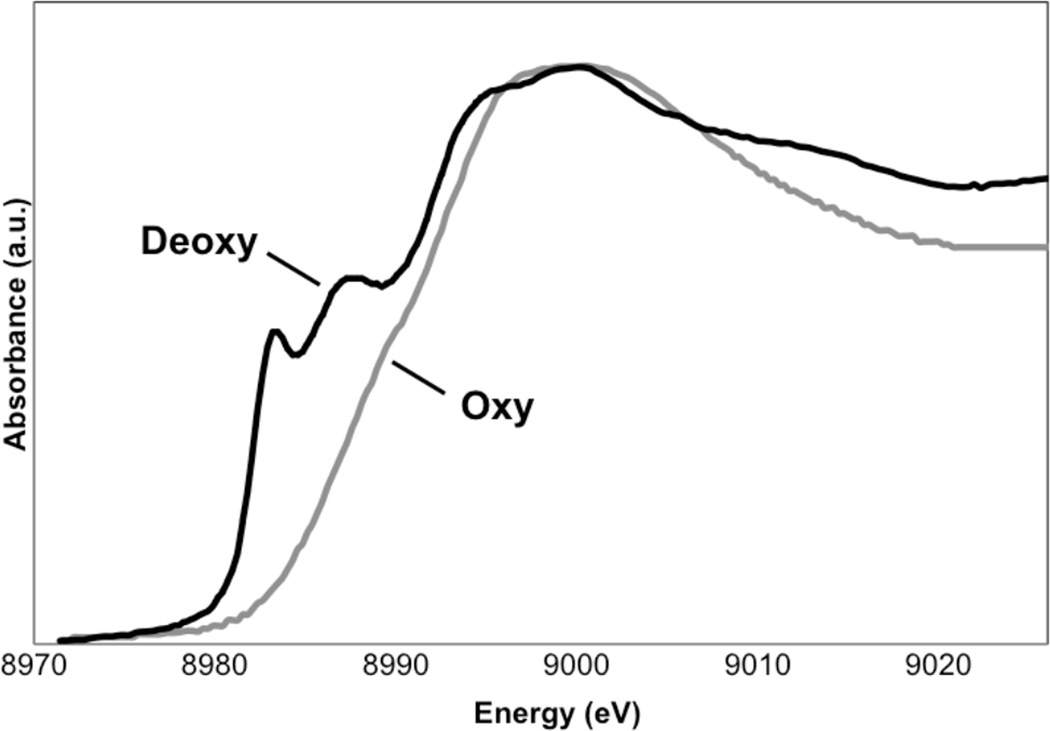
Cu K-edge XAS of deoxy-Hc (black) and oxy-Hc (gray).
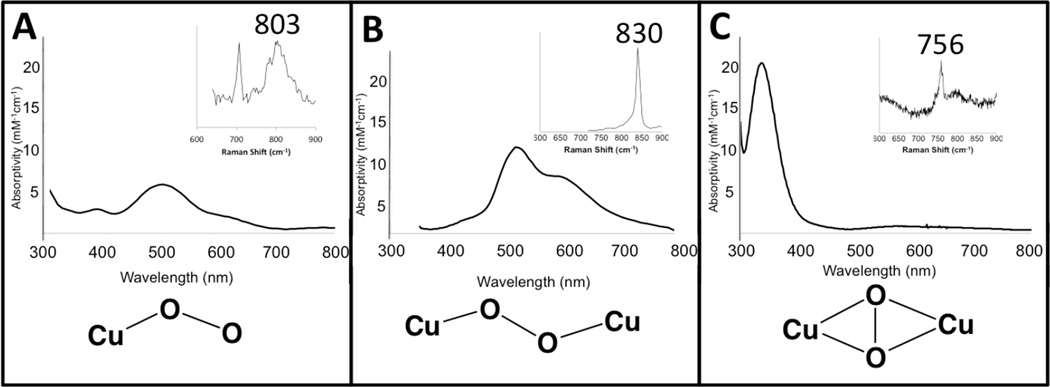
Comparison of the electronic absorption spectra and resonance Raman spectra (inset) among copper-dioxygen adducts.
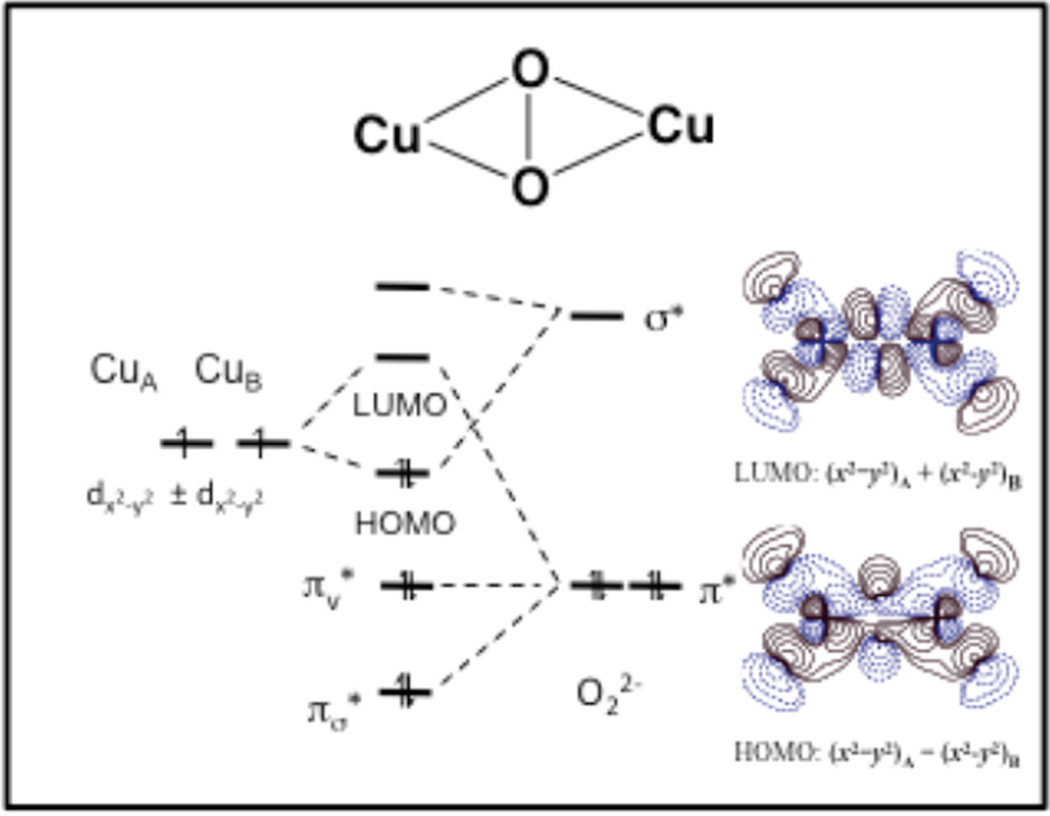
Molecular orbital diagram depicting the valence interaction between copper and dioxygen in a side-on Cu2(μ-O2) adduct. The contours of the HOMO and LUMO are shown on the left.
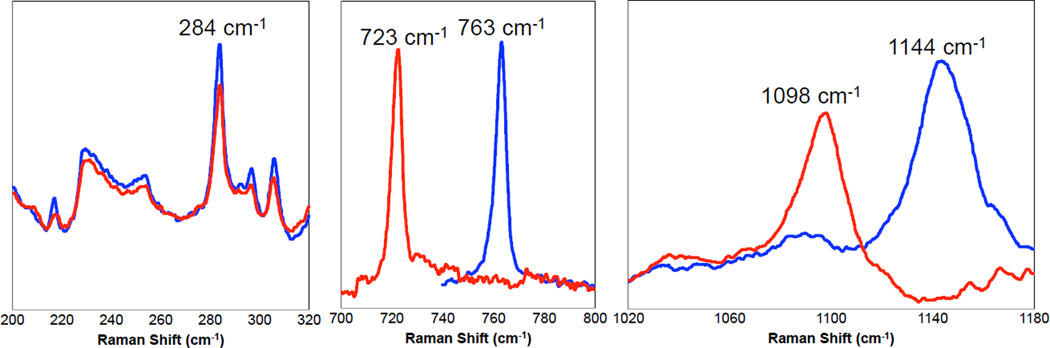
Resonance Raman spectrum of {[(Tp)Cu]2-(μ-η2:η2-O2)}.
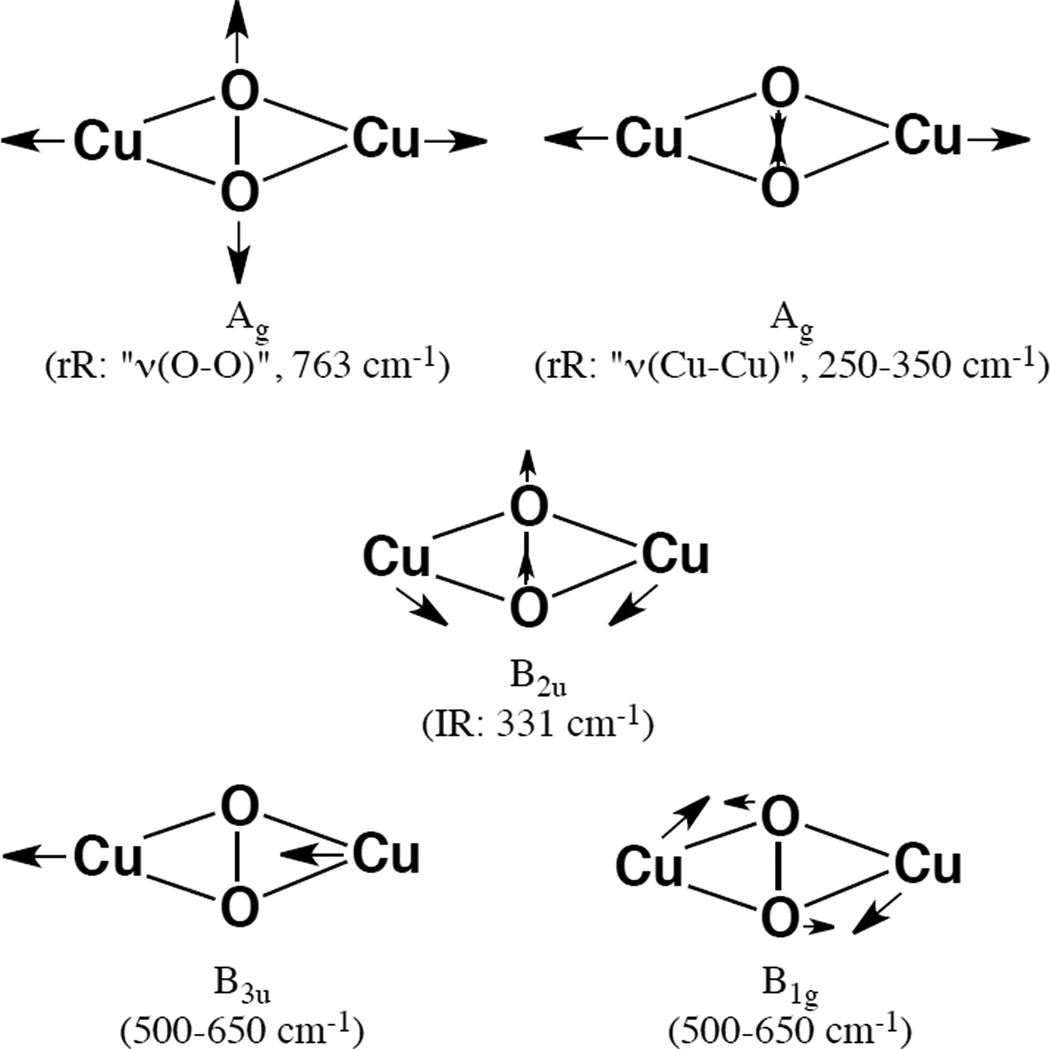
In plane normal vibrational modes of a side-on Cu2(μ-O2) dimer. Arrows represent the motion of the respective atoms in the normal mode.
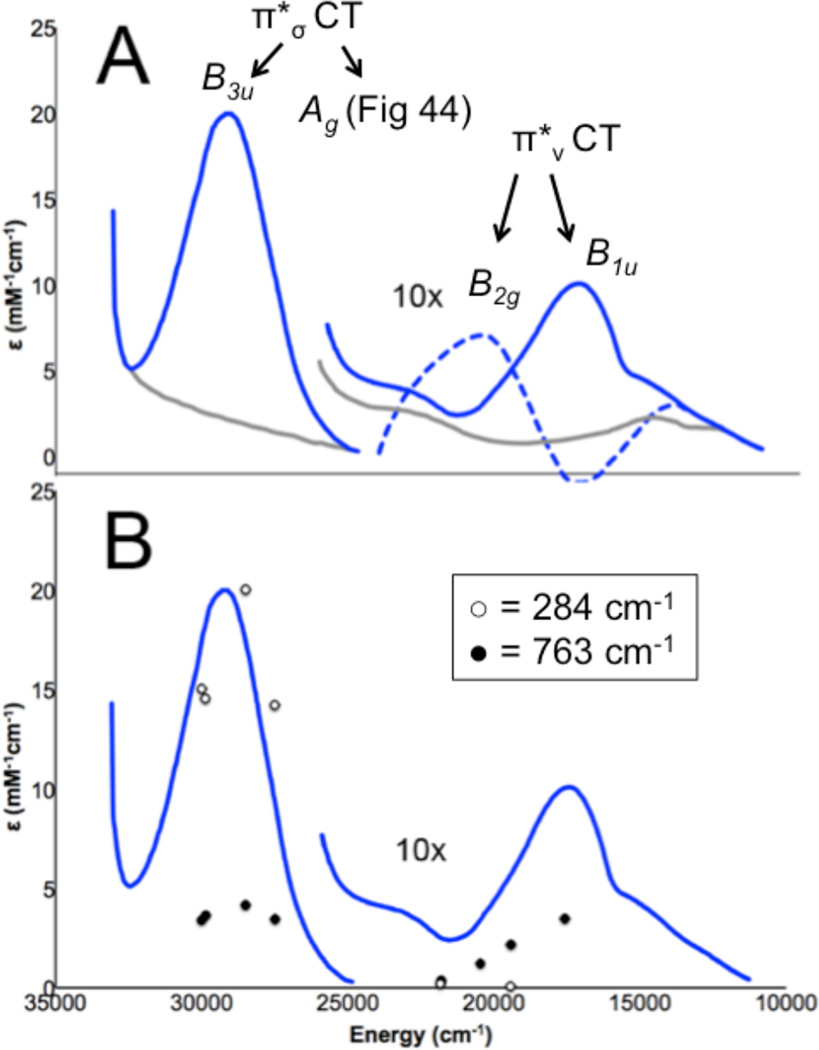
A) Absorption spectra of oxy-Hc ( ) and met-Hc (—), circular dichroism spectrum of oxy-Hc (
 ) (15K, acetate pH 5.0), B) Resonance Raman excitation profile of 765 cm−1 (○) and 287 cm−1(●) vibrational features of oxy-Hc superimposed over its absorption spectrum.
) and met-Hc (—), circular dichroism spectrum of oxy-Hc () (15K, acetate pH 5.0), B) Resonance Raman excitation profile of 765 cm−1 (○) and 287 cm−1(●) vibrational features of oxy-Hc superimposed over its absorption spectrum.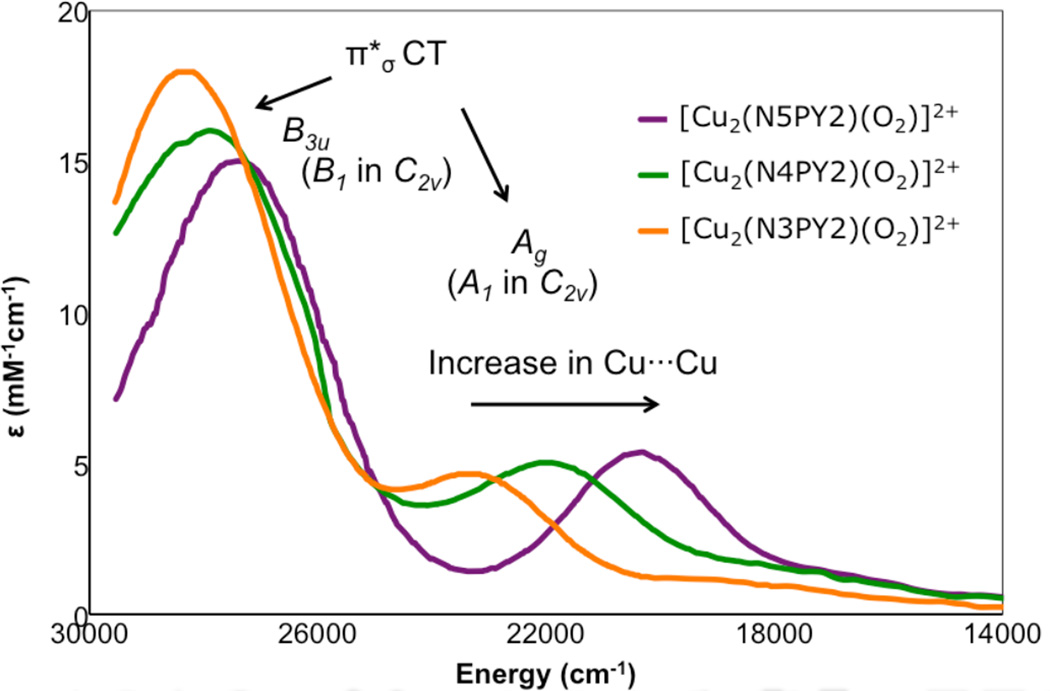
UV-Visible absorption spectra of a series of side-on peroxide-bridged binuclear copper complexes in which the Cu2O2 geometry contains a progressively larger “butterfly” distortion due to the ligand architecture where the most distorted complex is N3PY2.
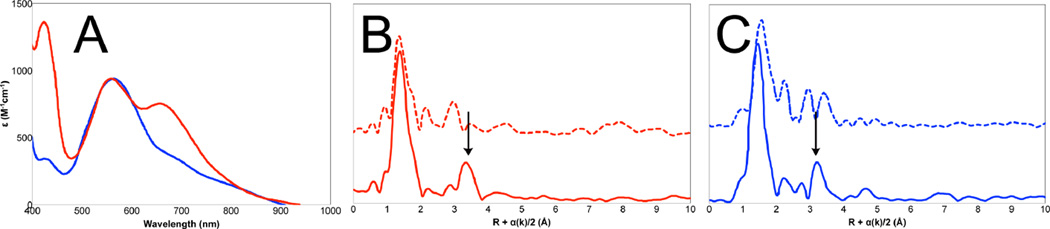
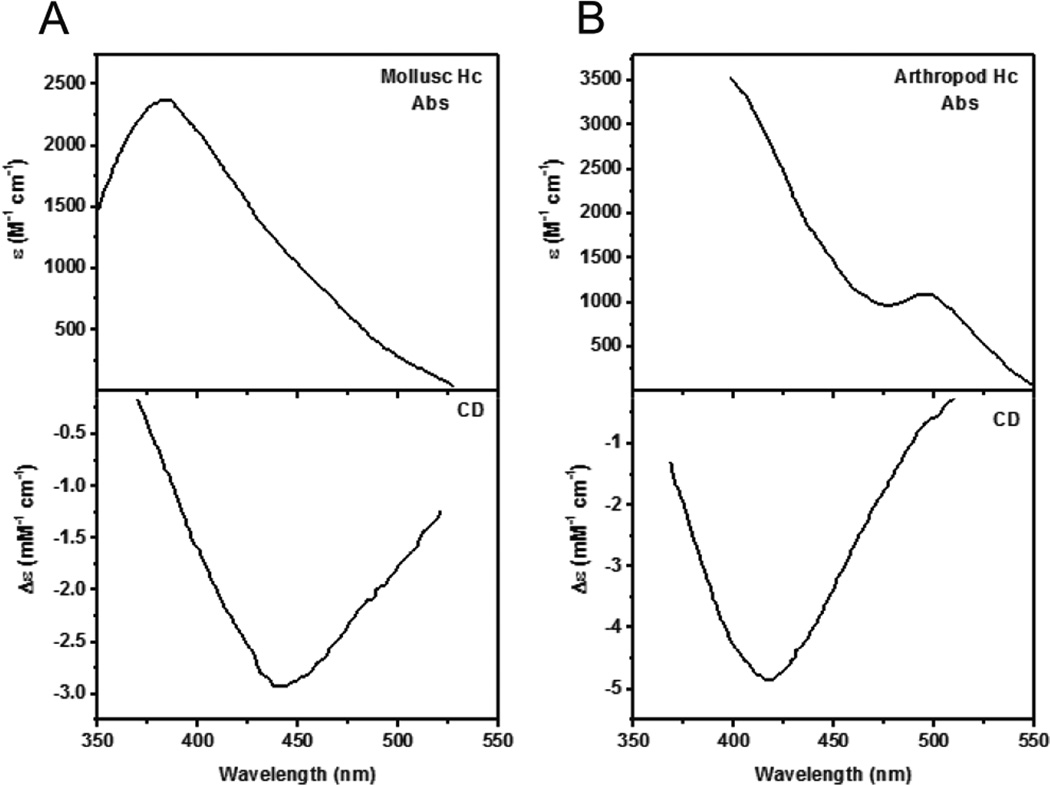
Comparison of the spectral features of arthropod and mollusc hemocyanins. A: UV-Visible absorption spectra of Cancer Irroratus ( ) and Busycon canaliculatum () oxy-Hc; B: Fourier transform EXAFS of deoxy-Hc (
 ) and oxy-Hc () from Cancer Irroratus; C: Fourier transform EXAFS of deoxy-Hc () and oxy-Hc () from Busycon canaliculatum.
) and Busycon canaliculatum () oxy-Hc; B: Fourier transform EXAFS of deoxy-Hc () and oxy-Hc () from Cancer Irroratus; C: Fourier transform EXAFS of deoxy-Hc () and oxy-Hc () from Busycon canaliculatum.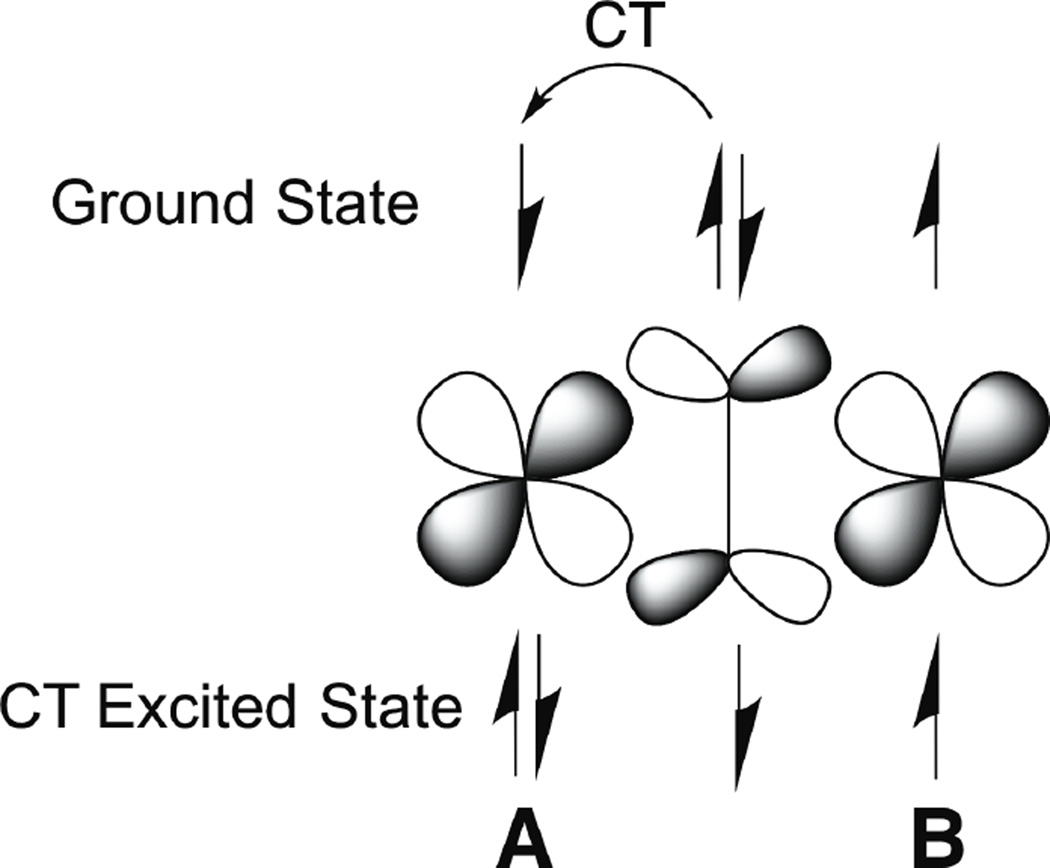
Charge transfer from a bridging peroxide to CuA (top) results in an excited state with a hole on the peroxide (bottom). In the excited state, the singly occupied peroxide and CuB orbitals strongly couple as a result of their direct overlap.
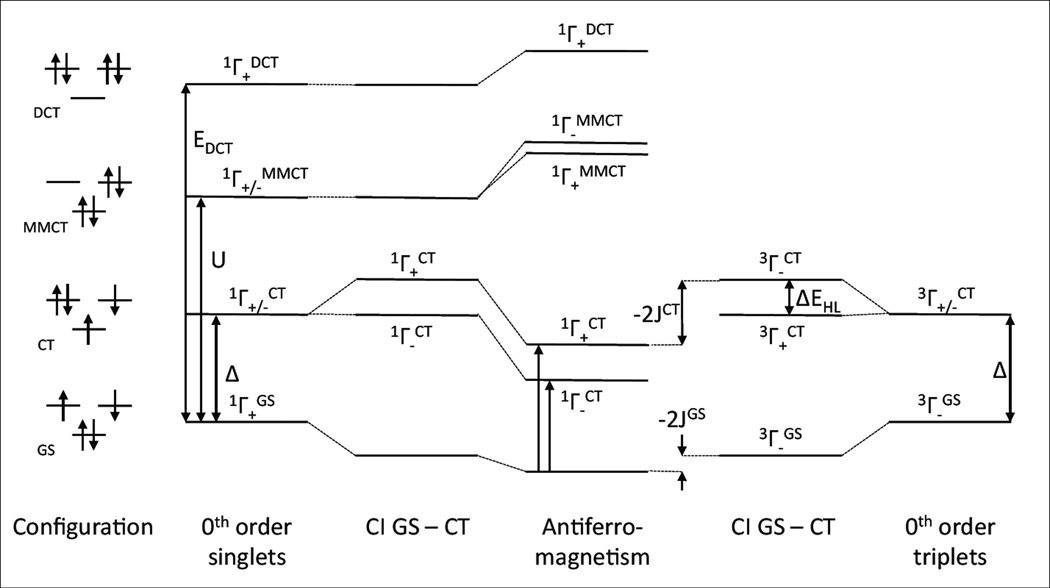
Configuration interaction diagram for mixing between valence bond states: left singlets, right triplets; in order of increasing energy the ground configuration, the LMCT configuration at an energy of Δ, the Cu to Cu CT configuration energy and the double CT (two-electrons from the ligand to the 2 Cu) at the energy of EDCT
UV-Visible absorption and CD spectra of Busycon () and Cancer () met-Hc with azide bound.
) and Cancer () met-Hc with azide bound.
Spectral changes observed upon addition of azide to nitrite bound half-met-Hc results in significant spectral changes. A. UV-Vis absorption of NO2− bound half-met-Hc () and N3− bound half-met-Hc (); B: EPR spectra of NO2− bound half-met-Hc () and N3− bound half-met-Hc ().
) and N3− bound half-met-Hc (); B: EPR spectra of NO2− bound half-met-Hc () and N3− bound half-met-Hc ().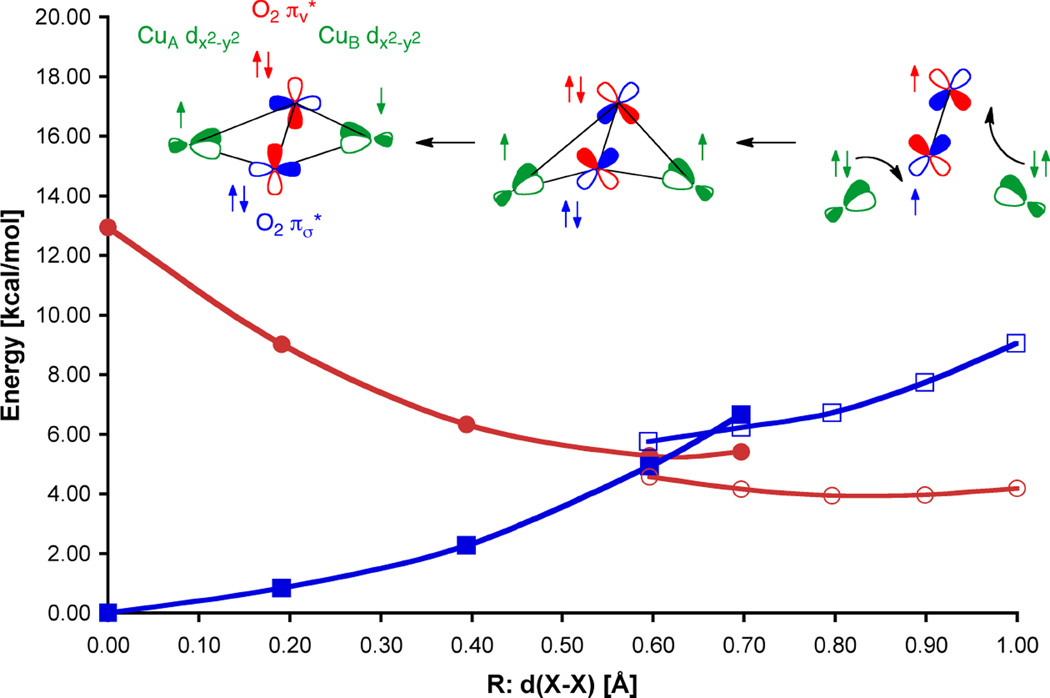
The distance d(X-X) between the center of mass of dioxygen and the Hc active site model [{(NH3)Cu}2]2+ for the singlet (blue squares) and triplet surfaces (red circles) shows the reaction coordinate of O2 binding (open symbols signify asymmetric coordination geometries while closed symbols are symmetric). The figure illustrates the simultaneous transfer of two electrons with parallel spin to dioxygen (right) forming peroxide. The ferromagnetically coupled butterflied μ-η2-μ2 peroxo (center) then undergoes an inter system crossing to form the antiferromagnetic singlet (left).
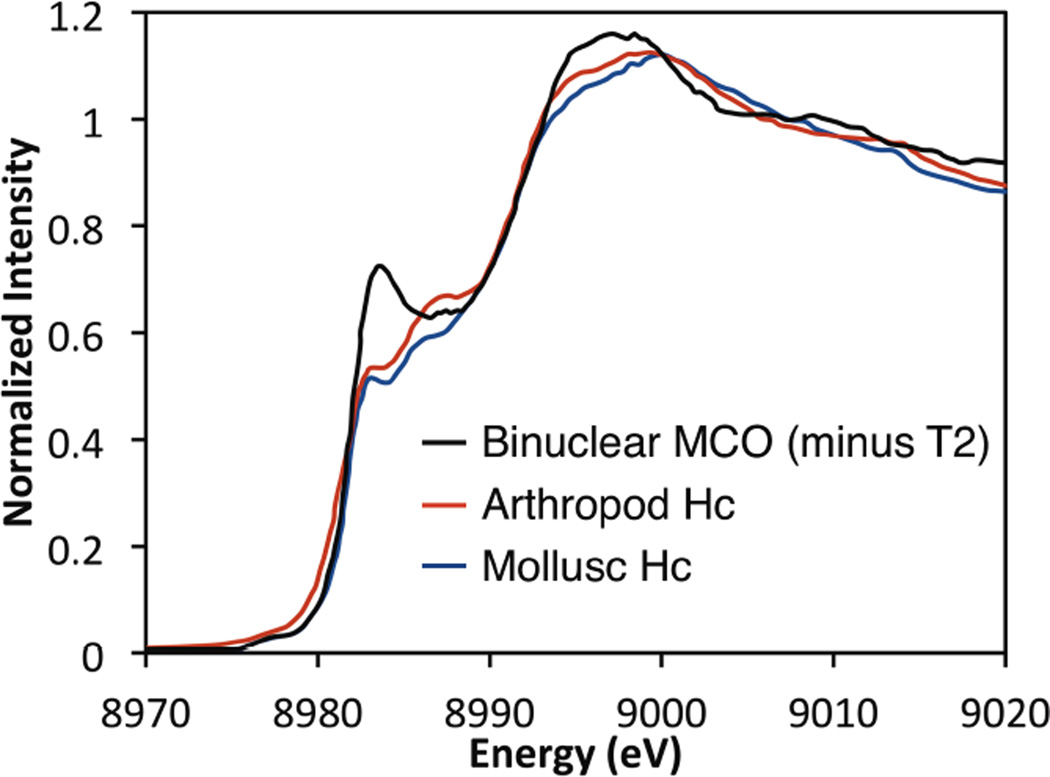
The spectral differences of the normalized XAS of arthropod, mollusc, and the binuclear MCO reflect a changing coordination environment from trigonal in Hc to more planer in the MCO.
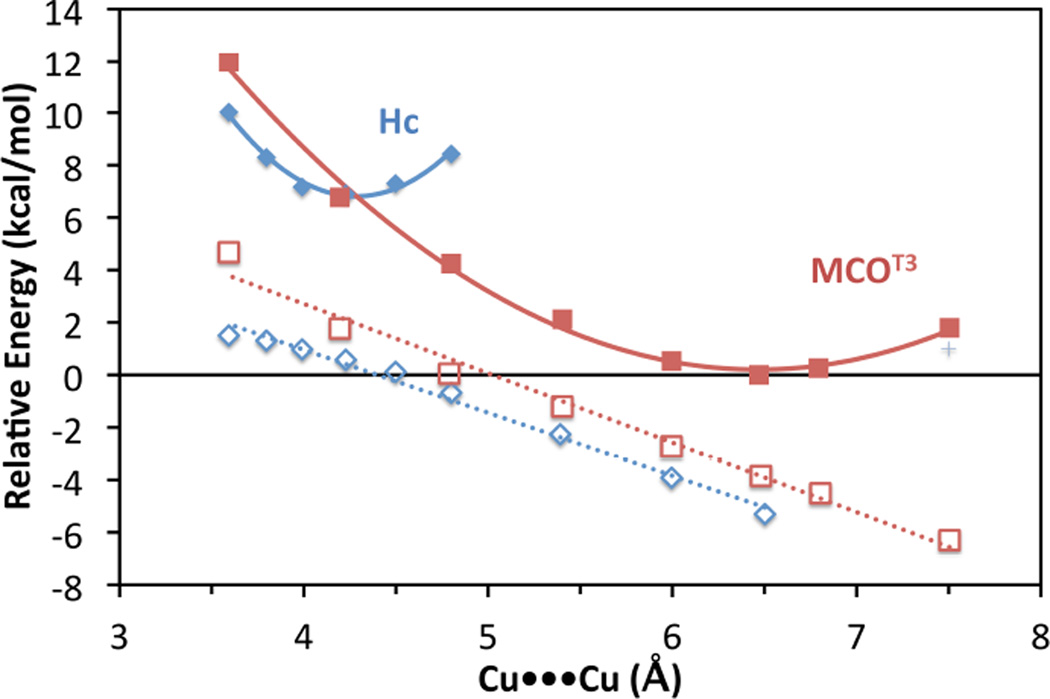
A Cu•••Cu potential energy surface for deoxy-Hc (blue diamonds) and deoxy-T3 MCO (red squares, MCOT3). A comparison of the constrained surface (frozen α-carbons represented by filled symbols) and the unconstrained surface (open symbols) indicate that the energy difference between deoxy-Hc and the deoxy T3 site is due to electrostatic repulsion between the coppers.
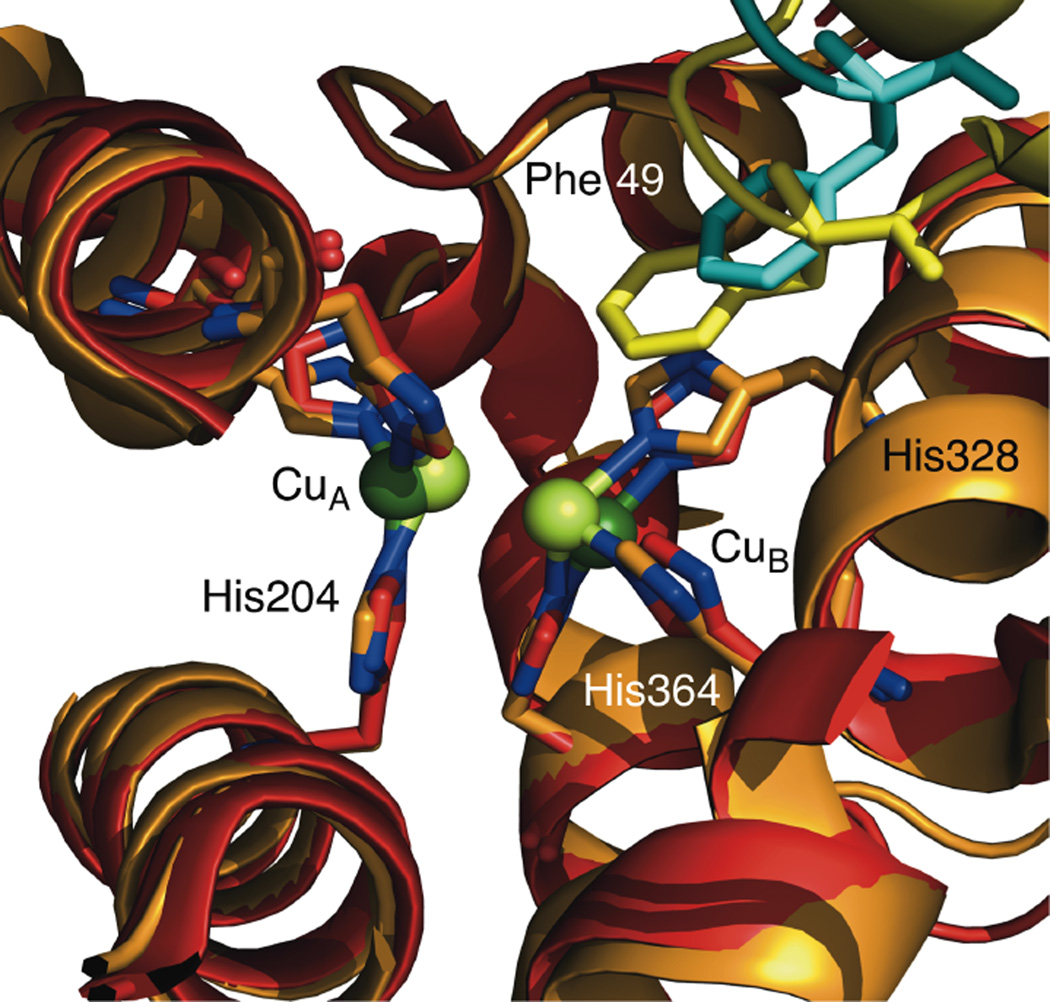
An overlay of structural models for the tense (domain 1 in yellow and domain 2 in red, PDB 1LLA) and relaxed (domain 1 in light blue and domain 2 in orange, PDB 1HC1) states of arthropod Hc show a large rotation in domain 1. This rotation is translated to the active site via the formation of a π-π interaction between Phe 49 and His328, which increases the Cu•••Cu separation (residues numbers are from L. polyphemus 1LLA).
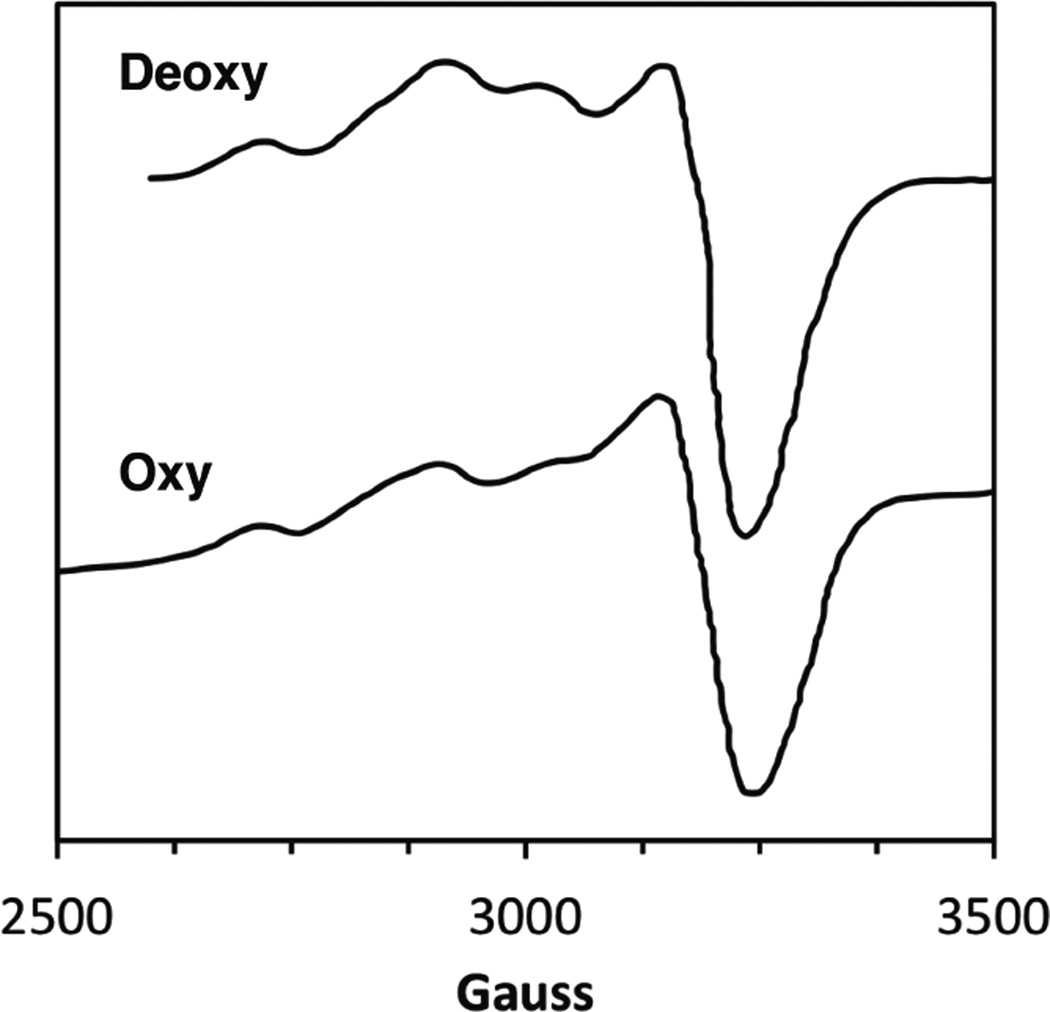
The EPR spectra of the half-met spectral probe of mollusc Hc (Busycon canaliculatum) directly probes geometric changes at the active site when the oxygenation state of the adjacent subunits is altered.

Ty is a monooxygenase that converts L-tyrosine to L-DOPA by incorporating labeled oxygen before oxidizing L-DOPA to L-DOPAquinone.
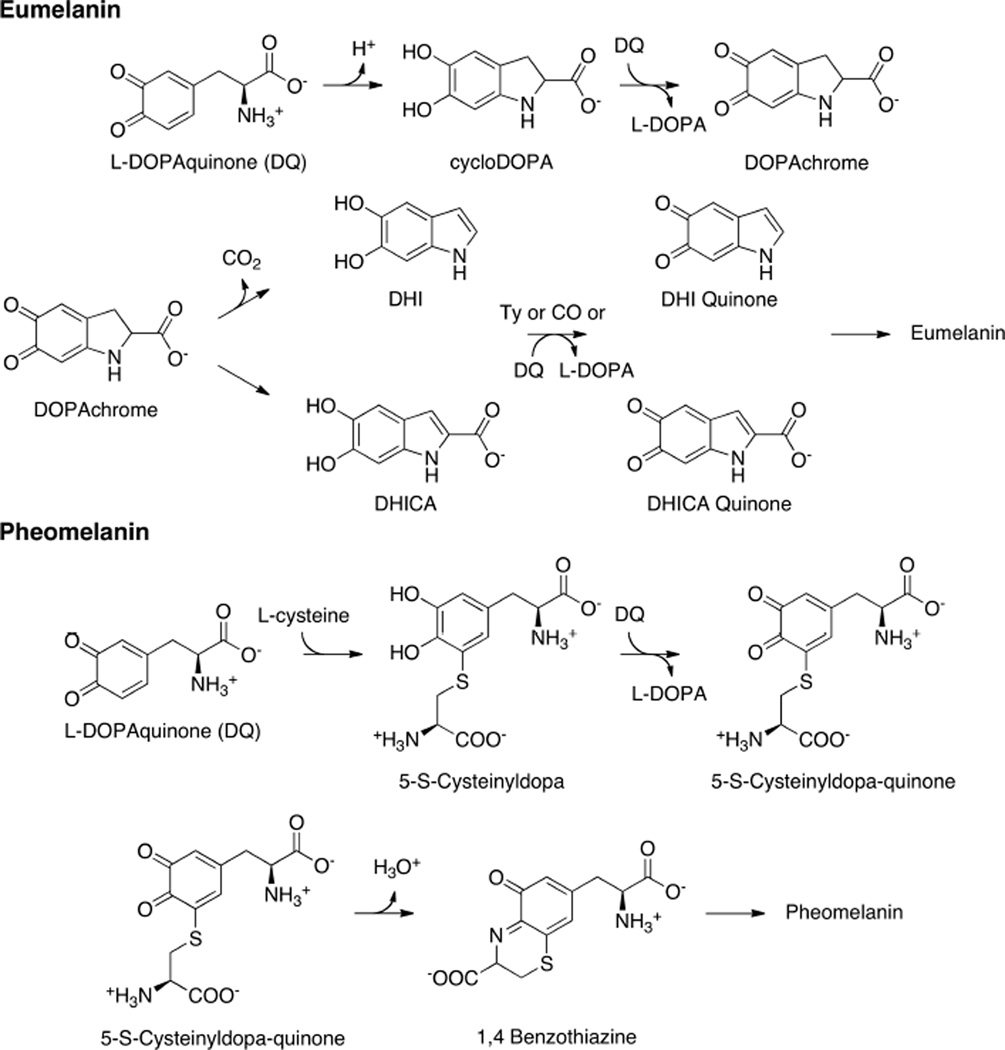
The initial steps of melanin monomer formation for eumelanin via the Mason-Raper pathway and the formation of phenomelanin via the 5-S-Cysteinyldopa pathway.
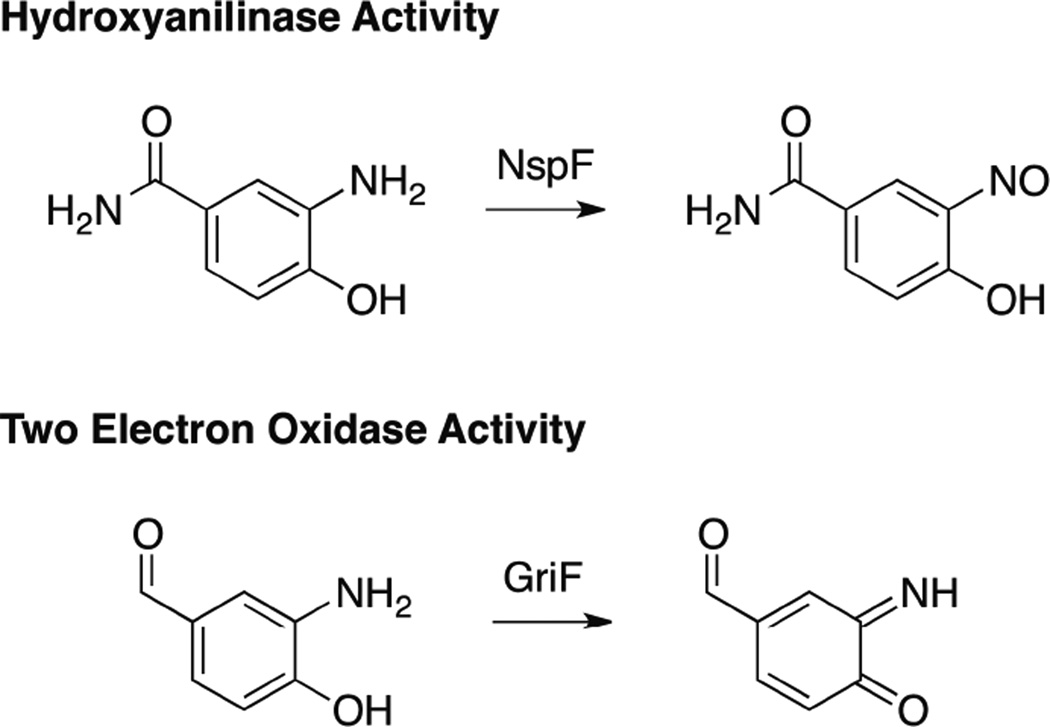
In vivo, GriF converts 3-amino-4-hydroxybenzaldehide to the corresponding iminoquinone while NspF converts 3-amino-4-hydroxybenzamide to a nitrosophenol.
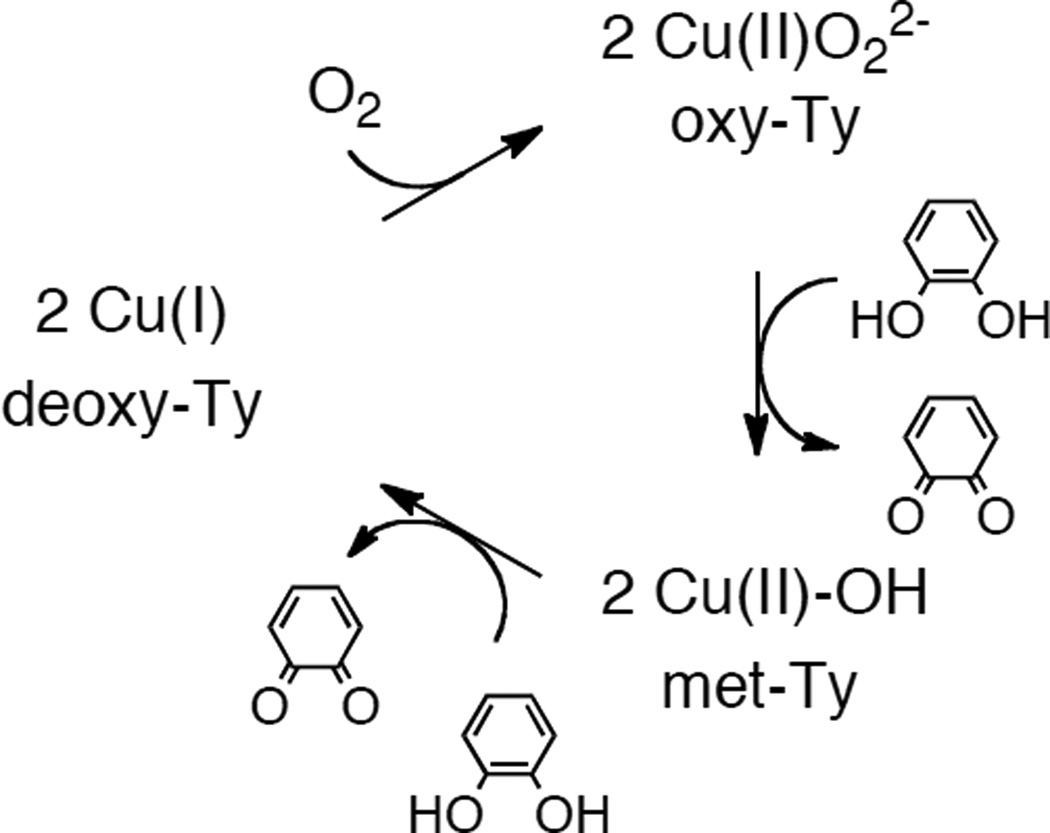
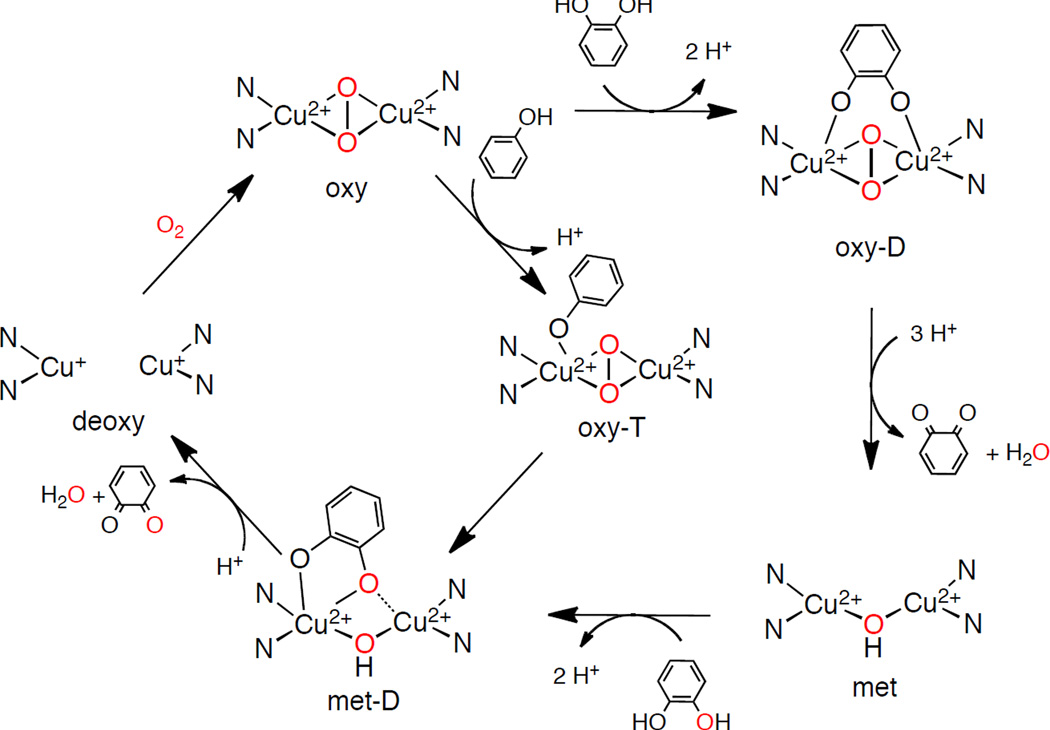
The catalytic cycle for catechol oxidase activity in Ty.

The catalytic cycle of Ty. Red arrows indicate the preferred, steady state turnover pathway for the monooxygenase activity.

A Hammett correlation between σ+ and the log(kcat) (s−1) is shown for mushroom Tyrosinase in red squares and O. vulgaris Hemocyanin (functional unit g) in blue circles.
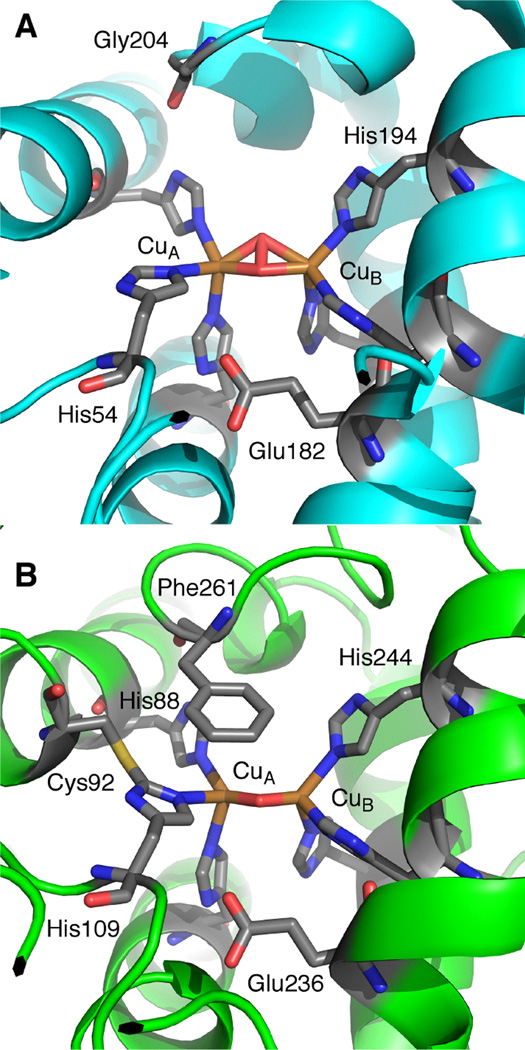
The active site of oxy-Tyrosinase (A) from the bacteria S. castaneoglobisporus and a structure of met-Catechol Oxidase from I. batatas (B).

An overlay of phenylthiourea (PTU) bound to Catechol Oxidase and met-Catechol Oxidase (green) from I. batatas (A). The structure of met B. megaterium Ty crystals soaked with kojic acid (KA) (B) and met A. bisporus Ty crystals soaked with tropolone (TP) (C).
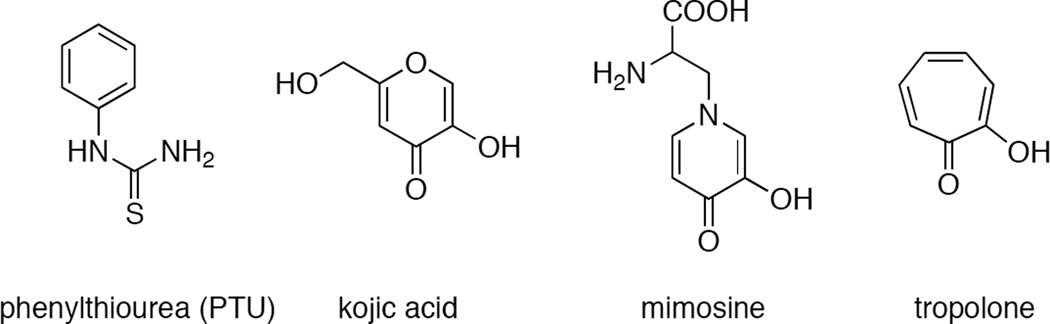
The structure of various small molecule inhibitors.
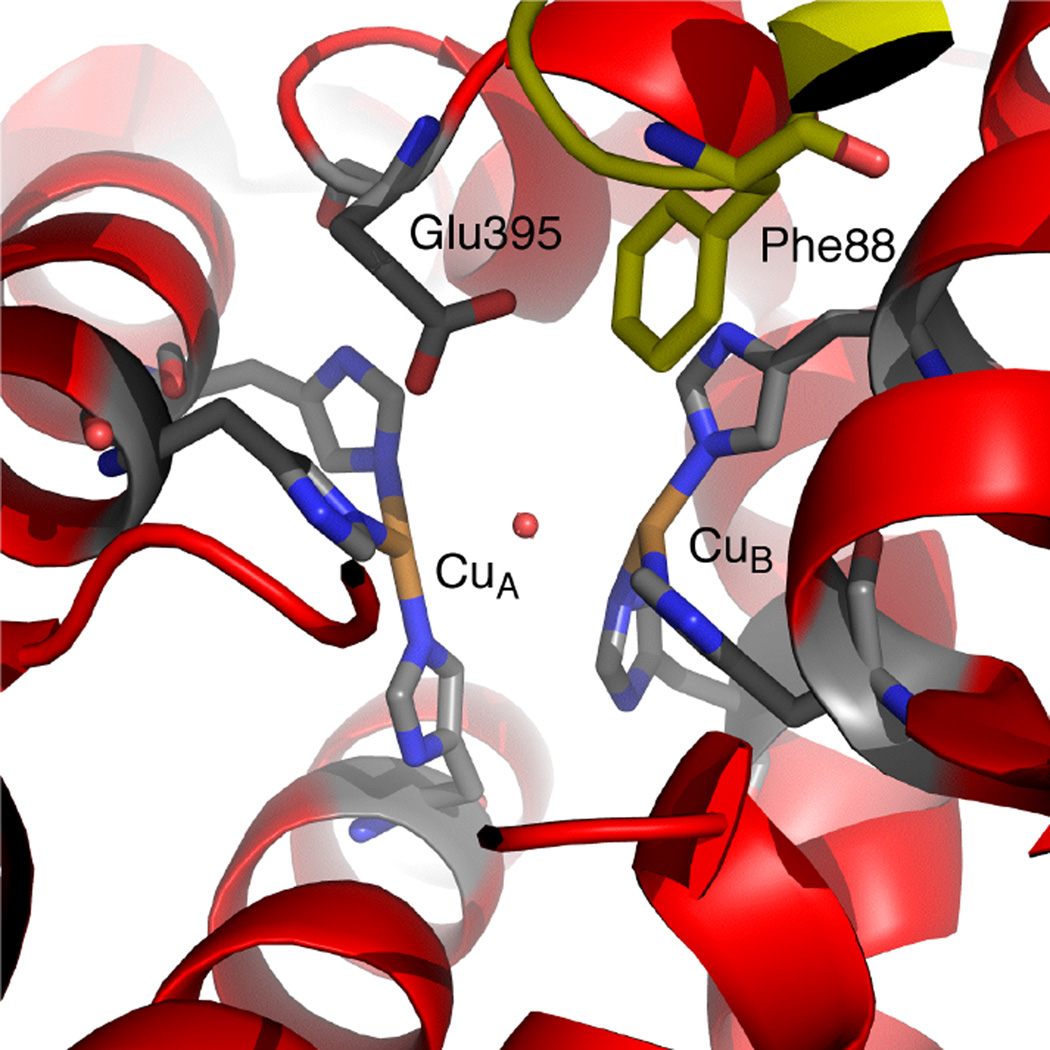
The structure of inactive, met-Tyrosinase PPO2 from the insect M. sexta has a unique base in the actives site (Glu 395) as well as Phe88 from domain 1 (in yellow) that restricts access to the active site.
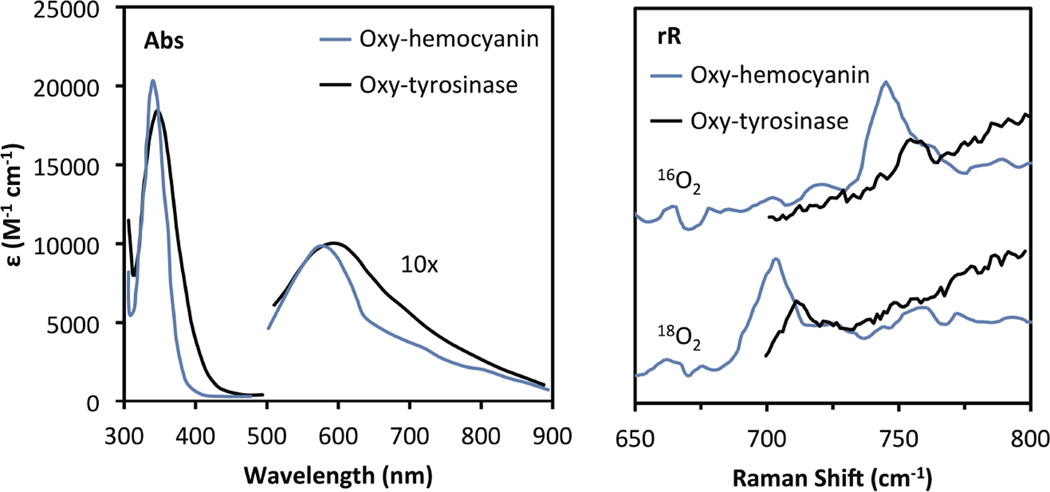
Comparison of the spectral features of oxy-Tyrosinase and oxy-Hemocyanin. Left: UV-Vis absorption; Right: resonance Raman (364 nm excitation).
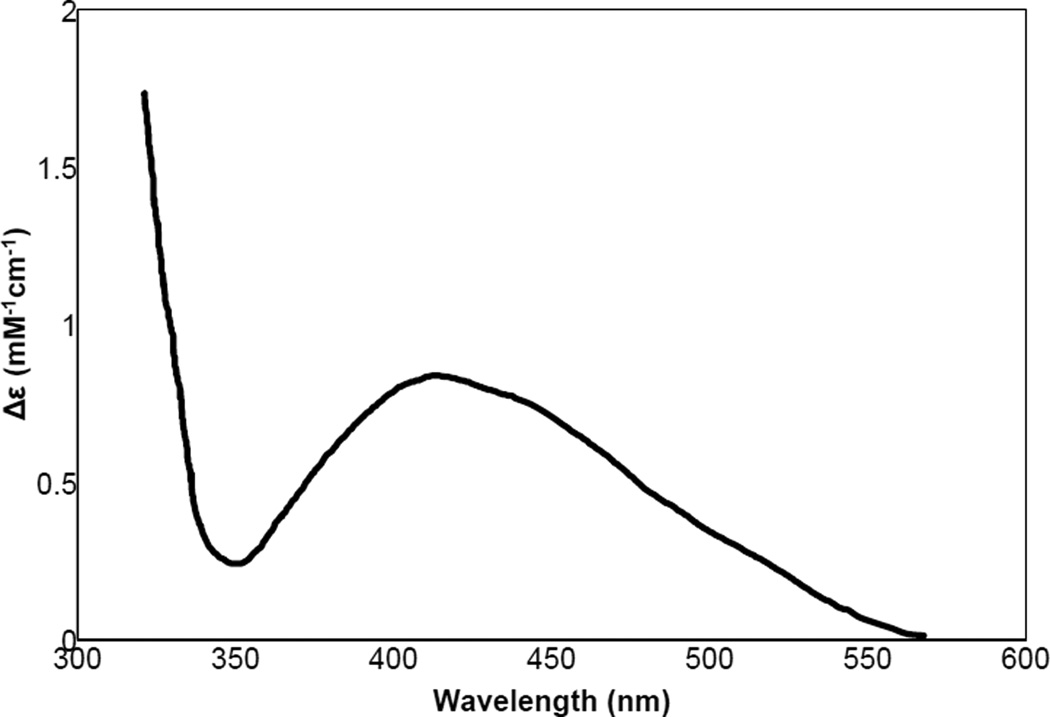
The addition of mimosine to met-Ty leads to observation of a CT transition in the absorption spectrum.
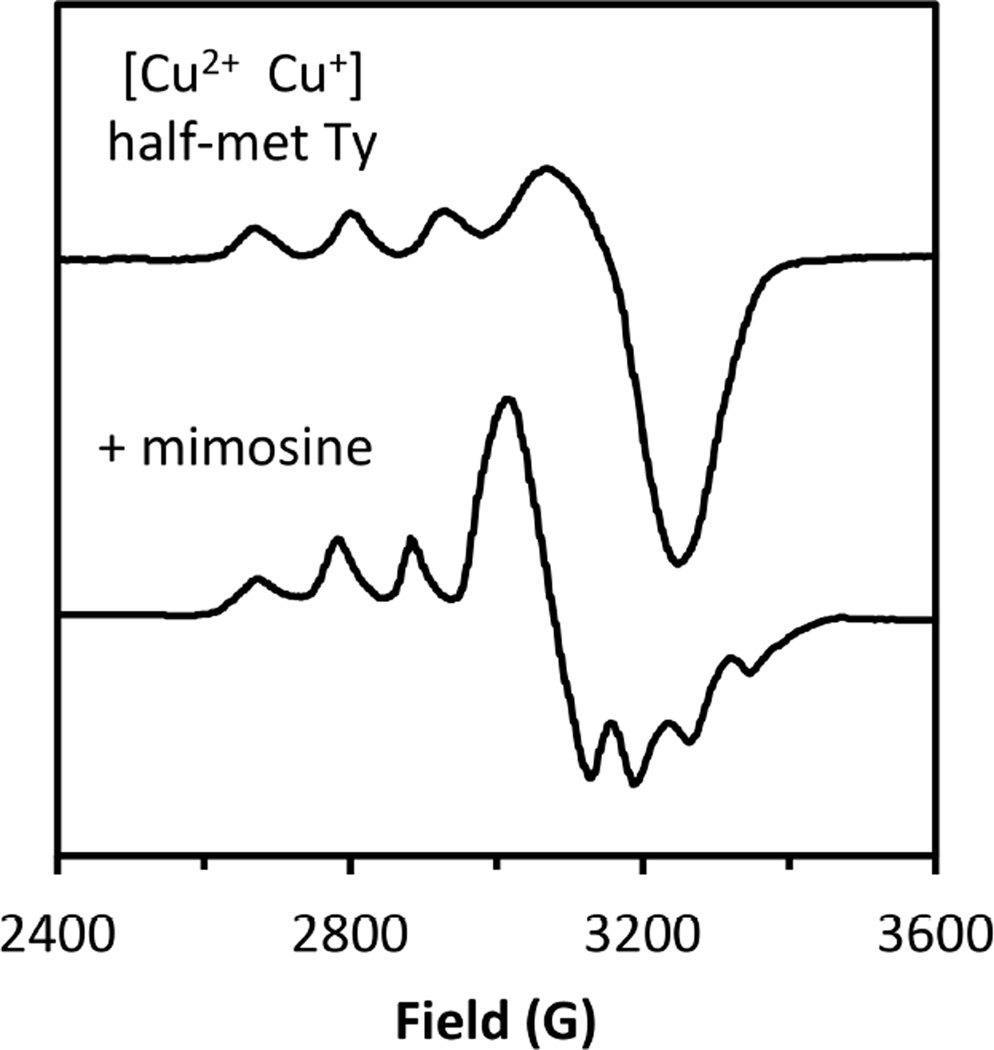
Changes observed in the EPR spectrum of half-met Ty upon addition of mimosine.
Interpenetrating mono and diphenolase catalytic cycles.
Peroxo & bis-oxo equilibrium.
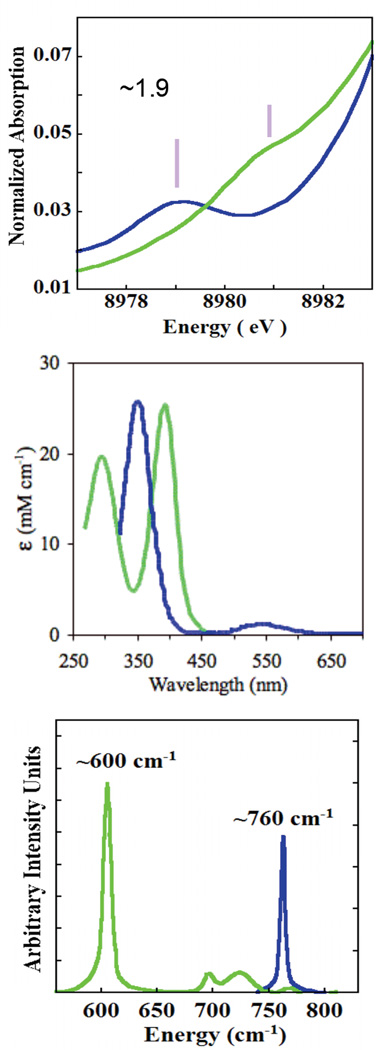
Spectral changes accompanying peroxo (blue) to bis-μ-oxo (green) equilibrium in X-ray Absorption Spectra (top), absorption (middle), and resonance Raman (bottom) spectra.
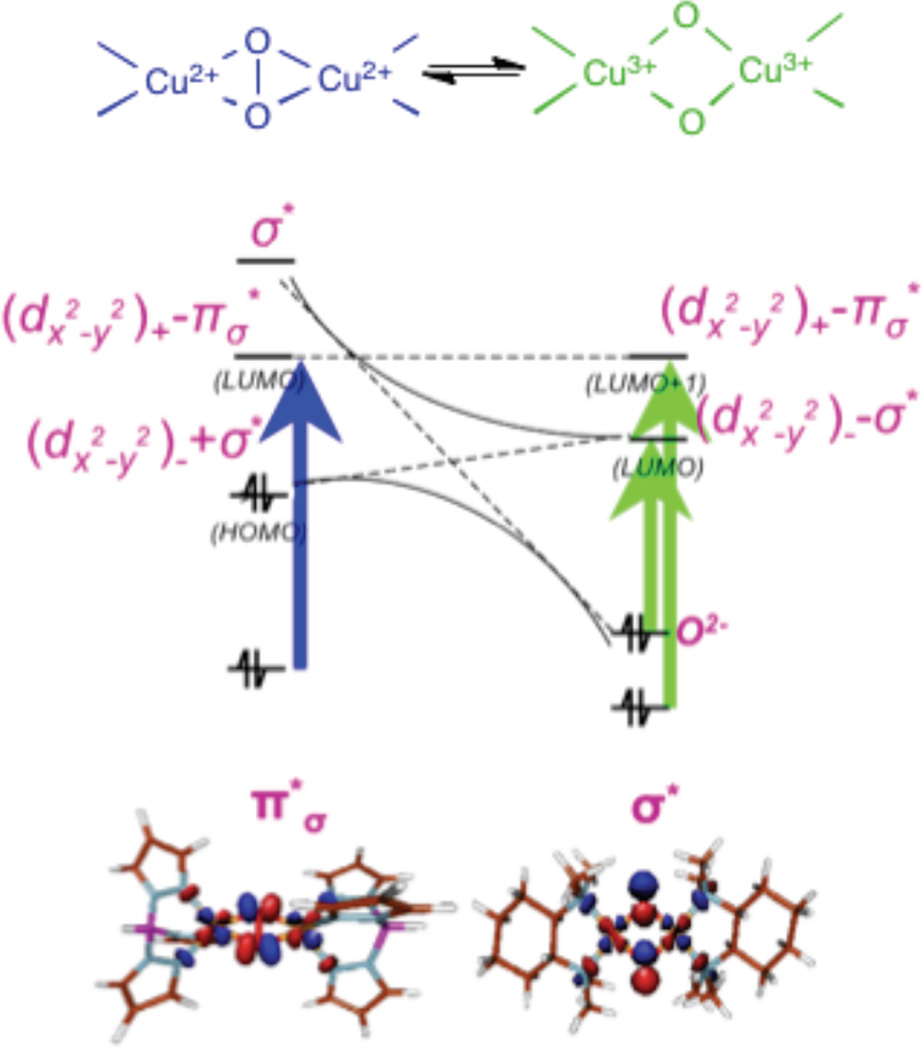
Correlation of the frontier molecular orbitals between a Cu2(O2) (left) and Cu2(O)2 (right).
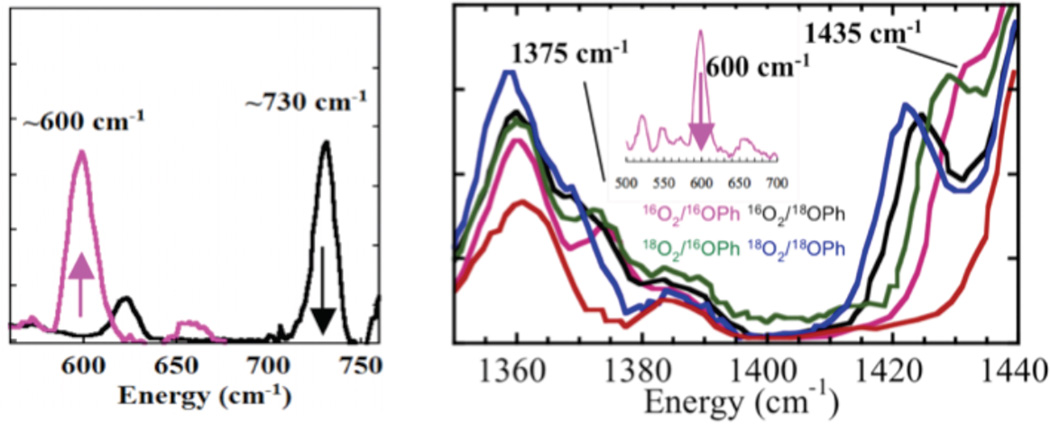
Resonance Raman spectra (left) showing conversion of formation of a bis-μ-oxo upon phenolate binding to the peroxo and (right) monooxygenated phenolate product, with oxygen isotopic substitutions, bound to copper that is formed from the decay of the bis-μ-oxo complex (inset).
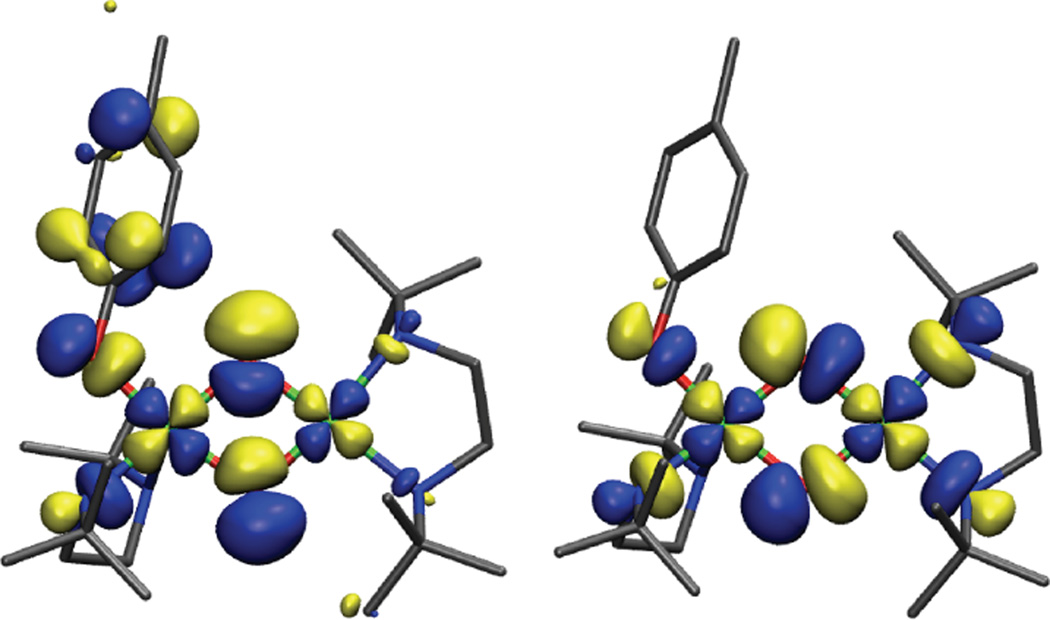
Reactive frontier molecular orbitals (LUMO and LUMO+1) of {[(dbed)Cu(OPhMe)]-(O)2-[Cu(dbed)]}+1 which represent σ and π acceptor channels for electrophilic aromatic substitution of the phenolate ring.

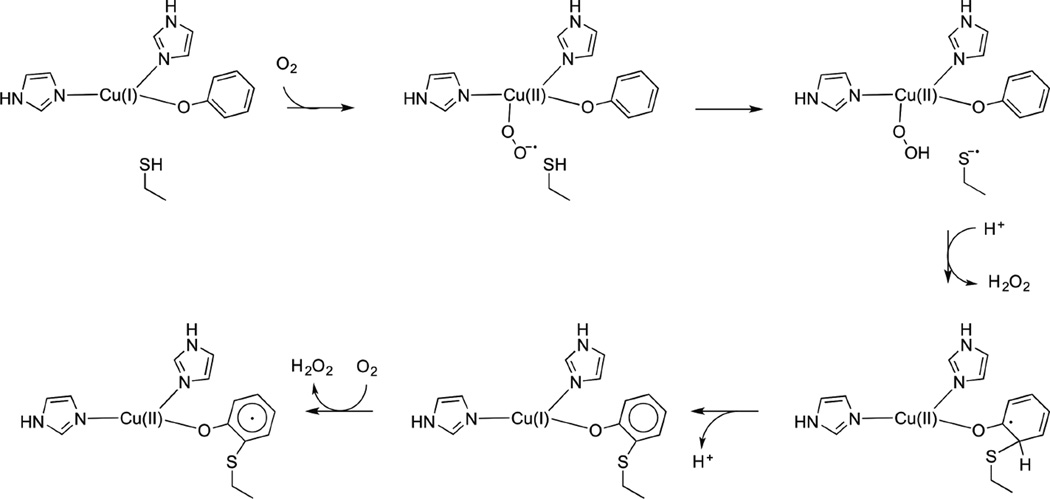
Mechanism of biomimetic tyrosinase model complex
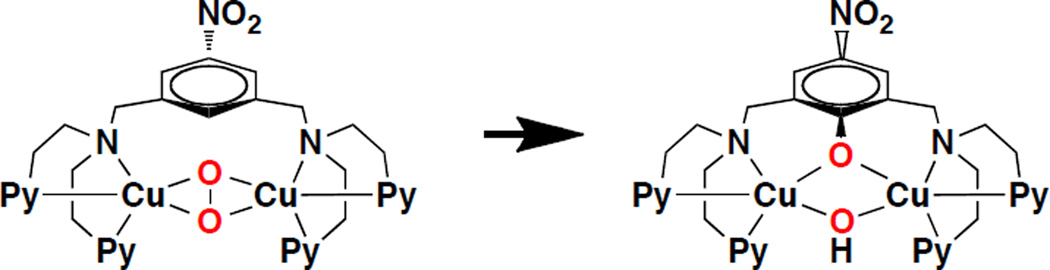
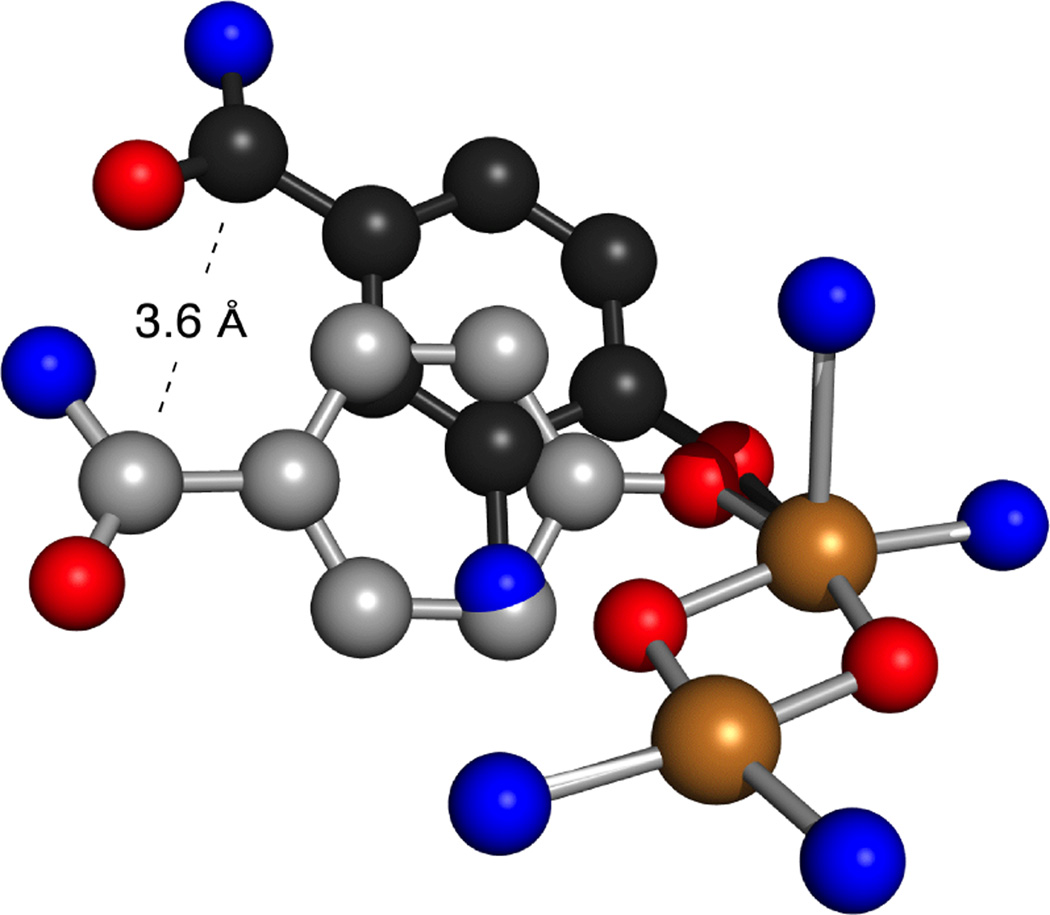
Thermal decay of [Cu2(NO2-XYL)(O2)]2+ results in an intramolecular ligand oxidation product.
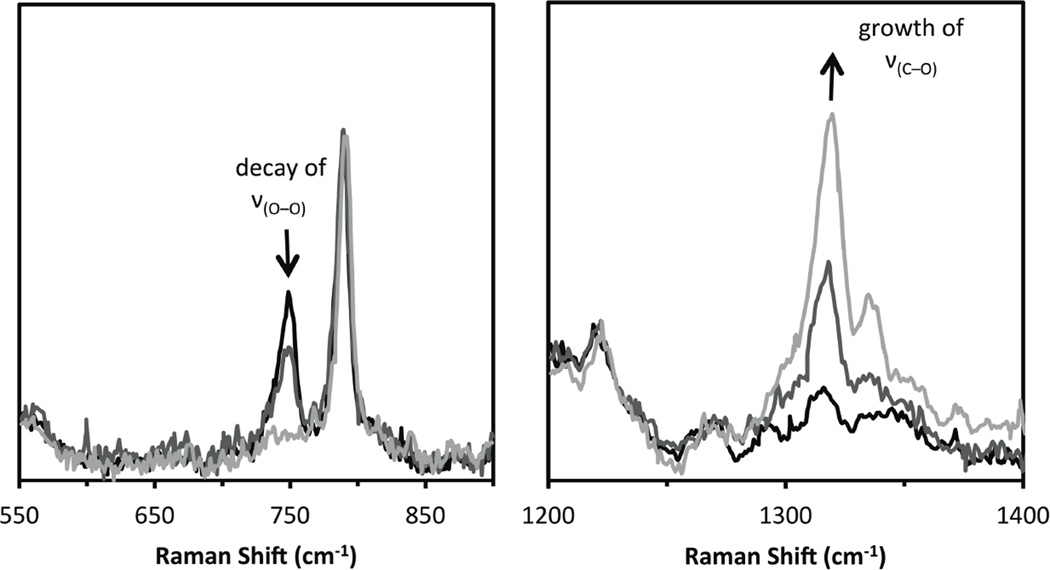
Resonance Raman spectra of the decay of a 4 mM solution of [Cu2(NO2-XYL)(O2)]2+ in acetone which demonstrates the loss of the ν(O—O) band of the peroxide adduct concomitant with the growth of a ν(C=O) of the product without presence of a Cu2(O)2 adduct (to a 0.005 mM detection limit).
Overlay of the transition states of monophenylase and phenylanilinase with similar Cu2O2 cores
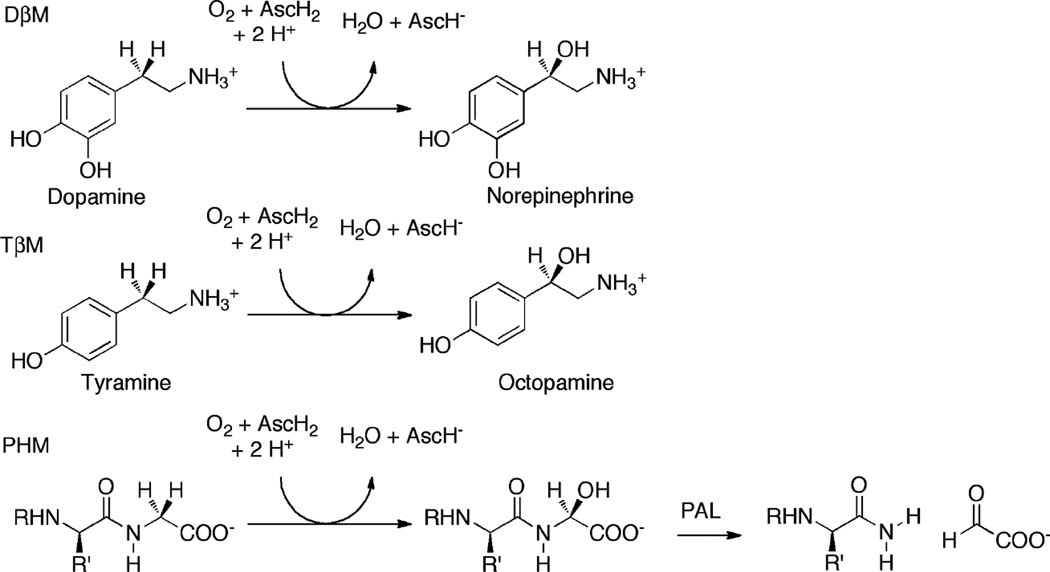
Respective reactivity of the non-coupled binuclear copper enzymes
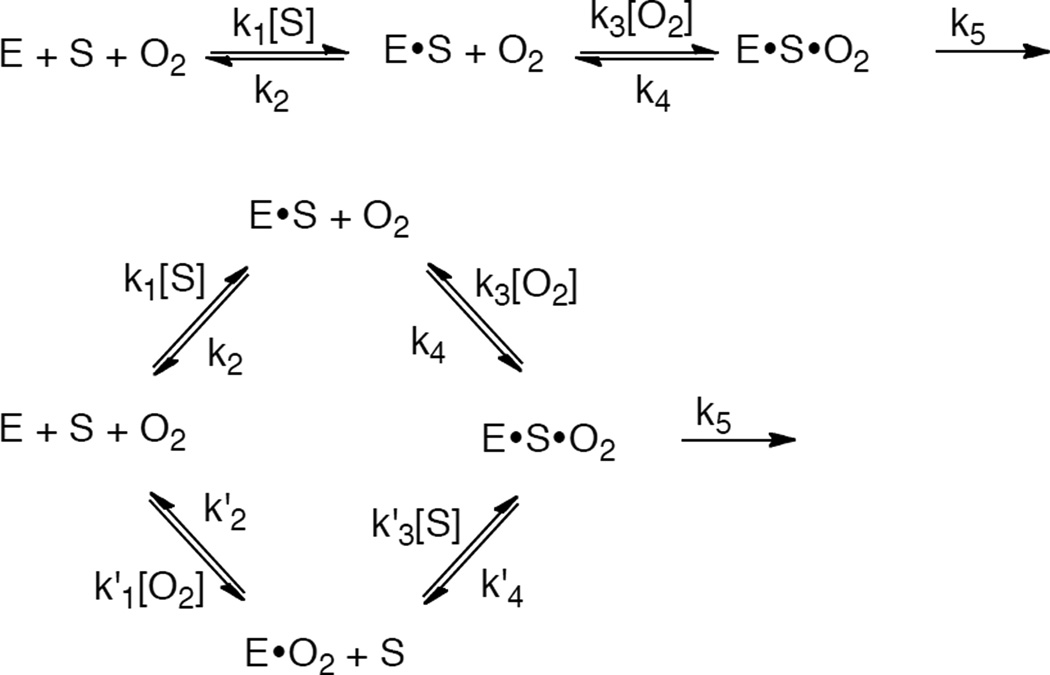
(top) Random mechanism for the formation of the ternary complex for DβM and TβM. (bottom) Equilibrium ordered mechanism for formation of the ternary complex for PHM.
Mechanistic summary of the coupled binuclear copper enzymes
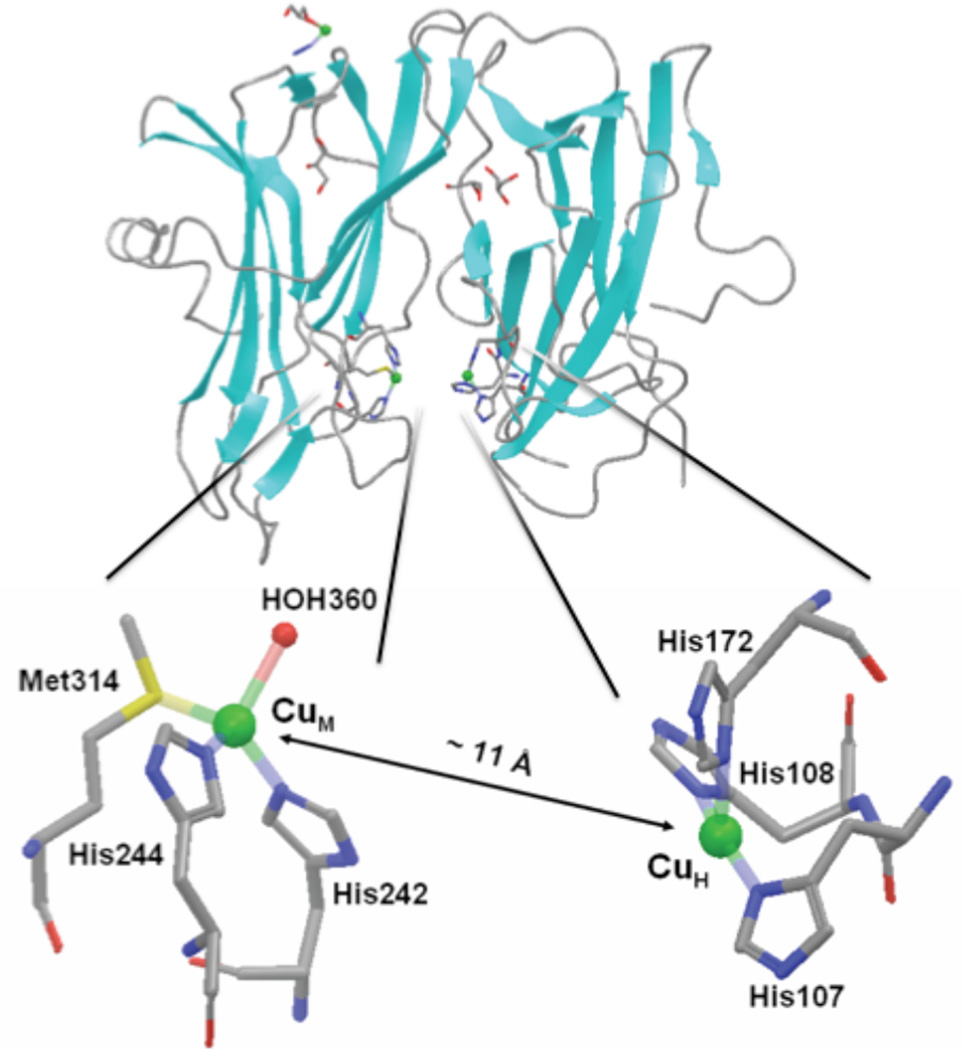
Top. A representation of secondary structure of PHMcc, PDB code 1PHM. The backbone is in gray, the strands are in cyan and the coppers are shown as green spheres. The ligands to the two catalytic coppers are colored by element (carbon is gray, nitrogen is blue, sulfur is yellow, and oxygen is red). Bottom. Coordination ligands of CuH and CuM sites. Coppers are shown by green spheres and ligands are colored by element.
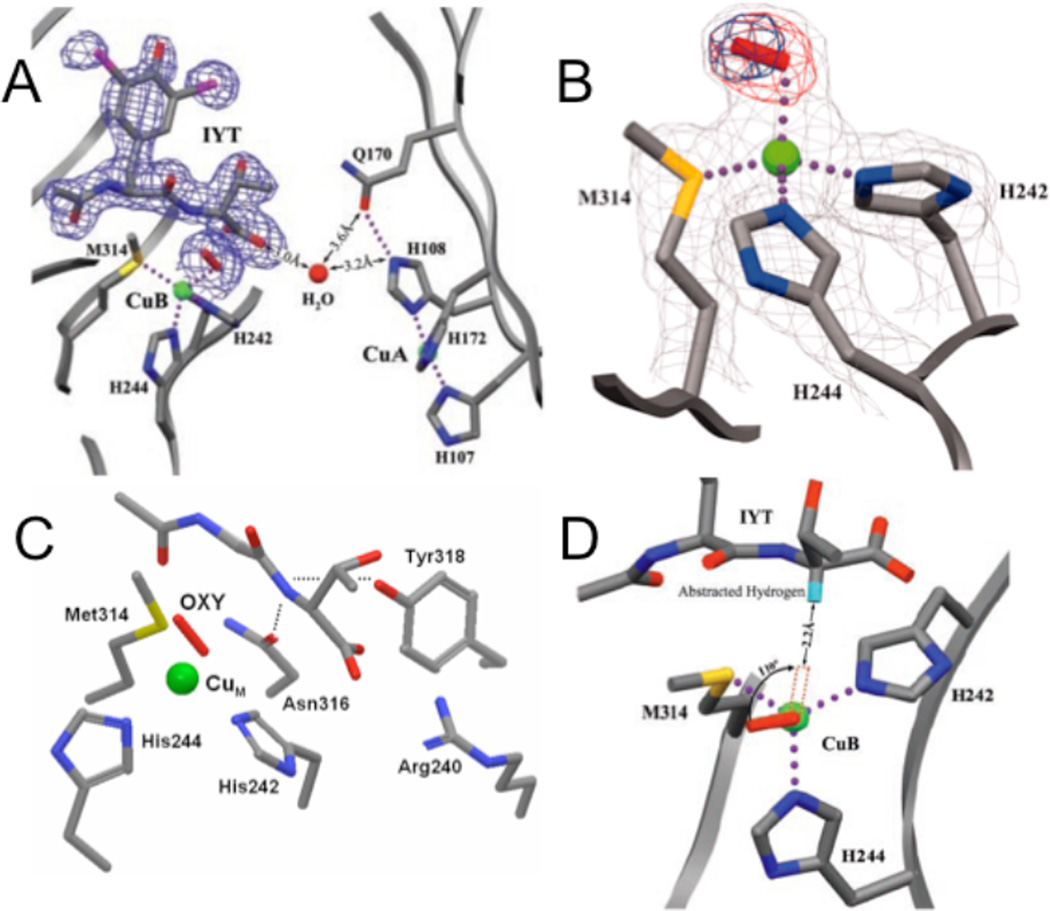
A. The precatalytic complex of PHM showing the relative position of bound substrate, N-acetyl-diiodotyrosyl-D-threonine (IYT), and dioxygen at CuM site. The 2Fo-Fc electron density is shown for dioxygen and the IYT peptide. Substrate and protein atoms are colored by atom type; iodine atoms are purple. The water molecule is represented by a red sphere and molecular oxygen by a red rod. Dotted lines indicate hydrogen bonds and bonds to the copper atoms (green spheres). B. The structure of the dioxygen binding site showing the precatalytic complex. Dioxygen (the red rod) is shown bound to CuM (the green sphere) in an end-on manner. Amino acid ligands to CuM are shown colored by atom type. Simulated annealing difference omit maps that leave out either both oxygen atoms (red mesh) or the distal oxygen atom of dioxygen (blue mesh) are shown contoured at 8σ. In this crystal structure, CuM-O-O angle is 110.2°, CuM-Oproximal is 2.106 Å, the O-O distance is 1.232 Å and the distance between the α-C in the substrate and the CuB-O-O is about 4-5 Å. C. The backbone of IYT and the anchor residuals are shown: Arg240 forming a salt bridge, the hydroxyl of Tyr318 and the side chain amide of Asn316 both in hydrogen bonds to the D-threonine main-chain amide. The hydrogen bonds are shown in dotted lines. D. A structure-based model of substrate dioxygen interaction. The structure of the PHM active site is oriented looking down the copper-oxygen bond. The modeled position of the substrate hydrogen atom that is abstracted during the PHM reaction is shown in turquoise. Rotating the copper-oxygen bond by 110° brings the terminal oxygen of dioxygen within 2.2 Å of the substrate hydrogen, a position consistent with hydrogen abstraction by an activated oxygen species. (From Ref. . Reprinted with permission from AAAS.)

Optimized geometries by density functional theory of reduced CuM and CuH sites, based on spectroscopic studies. A. Reduced CuM site. B. Reduced CuH site. . C. Oxidized CuM site. D. Oxidized CuH site. Relevant bond lengths (Å) are indicated. Color codes: Cu, green; N, blue; C, gray; O, red; S, yellow; H, light blue. (Reprinted with permission from Ref. . Copyright 2004 American Chemical Society.)

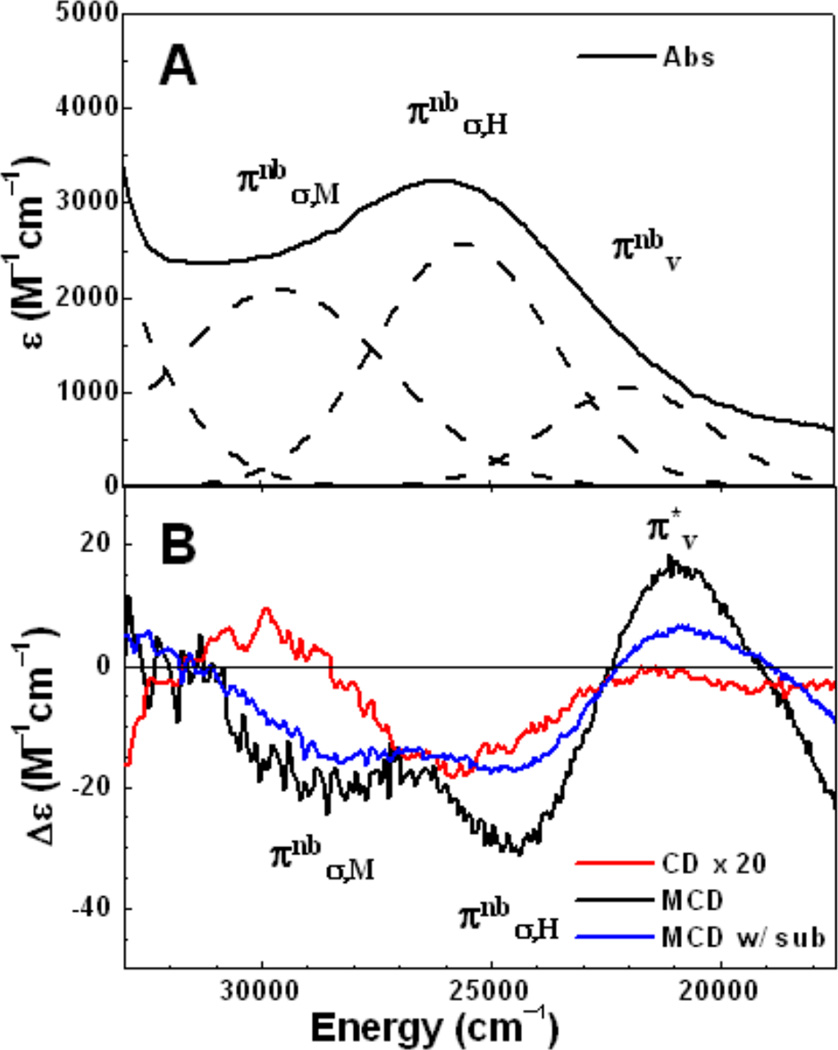
A. Ligand field 5 °C CD and 5 K, 7 T MCD spectra of the resting PHMcc and 5 K, 7 T MCD spectrum of the resting PHMcc with 2-3 equiv of AcYVG substrate; C. ligand field 5 °C CD and 5 K, 7 T MCD spectra of resting PHMcc with 350 mM N3− and the 5 K, 7 T MCD spectrum with an additional ~4 equiv of AcYVG substrate; E. ligand field 5 K, 7 T MCD spectrum of resting PHMcc with 300 mM NO2−; B., D., F. experimental (77 K) and simulated X-band EPR spectra for the resting PHMcc (9.321 GHz), resting PHMcc with 350 mM N3− (9.319 GHz), and resting PHMcc with 300 mM NO2− (9.394 GHz) samples, respectively. In panel B, “*” denotes a cavity signal. The sharp signal at g ≈ 2.0 is due to a radical signal of the quartz tube used in the EPR measurement. In panel E., the weak derivative shaped spectral feature at ~24,500 cm−1 (“*”) is due to a small heme contaminant. (Reprinted with permission from Ref. . Copyright 2004 American Chemical Society.)
A. Charge-transfer absorption spectrum (5 °C) of resting PHMcc with 350 mM N3− (dashed lines are Gaussian fitted bands); B. Charge-transfer region (5 °C) CD and 5 K, 7T MCD spectra of resting PHMcc with 350 mM N3− and 5 K, 7 T MCD spectrum with ~ 4 equiv of substrate AcYVG added to PHMcc + N3−. (Reprinted with permission from Ref. . Copyright 2004 American Chemical Society.)
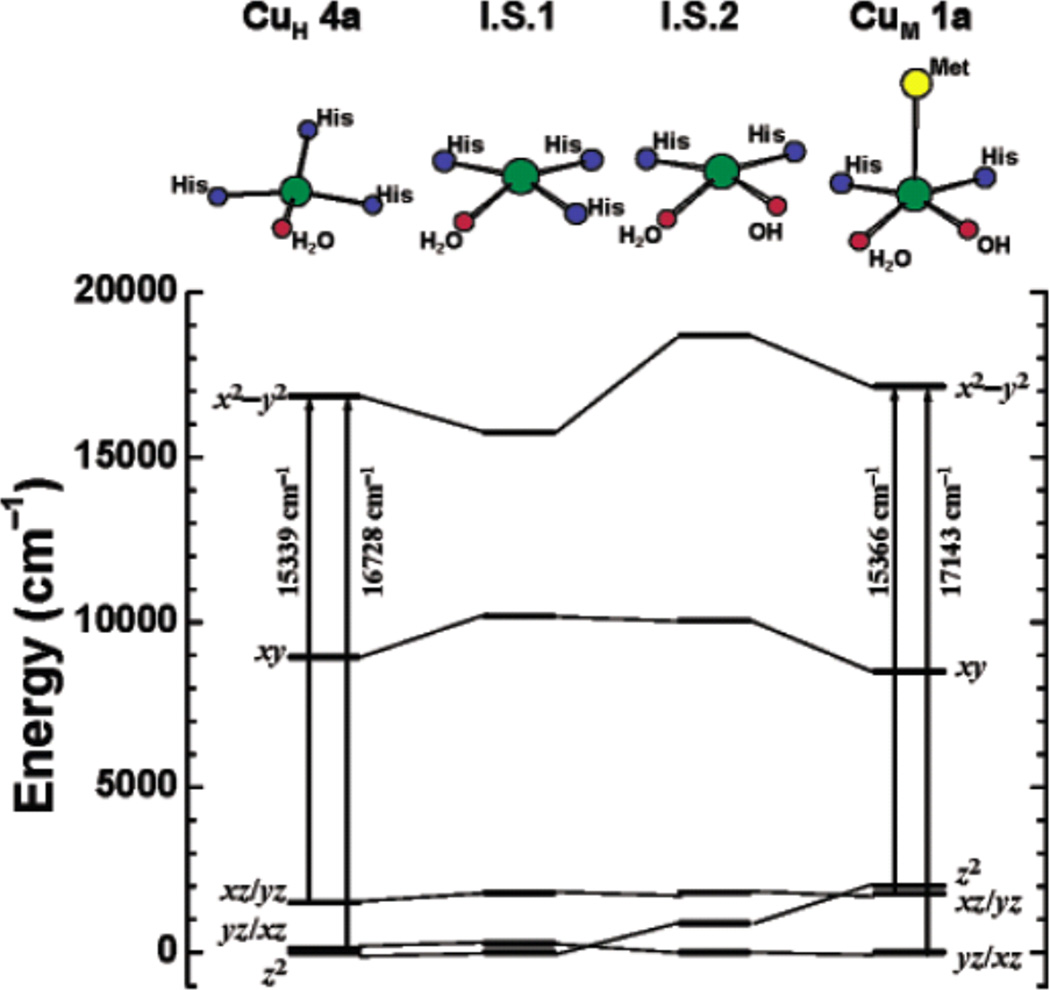
Structural correlations of ligand field splitting patterns. Ligand field calculated d-d orbital energy diagrams for CuH (oxidized, left) and CuM (oxidized, right). I.S.1 is an intermediate structural model derived from CuM
1a where the axial methionine is removed and the equatorial OH- is replaced by a histidine ligand. I.S.2 is an intermediate structural model with the axial methionine removed from CuM
1a. All energies are referenced to the lowest d orbital, which is set to zero. Geometries of first coordination sphere atoms are shown on the top. (Reprinted with permission from Ref. . Copyright 2004 American Chemical Society.)

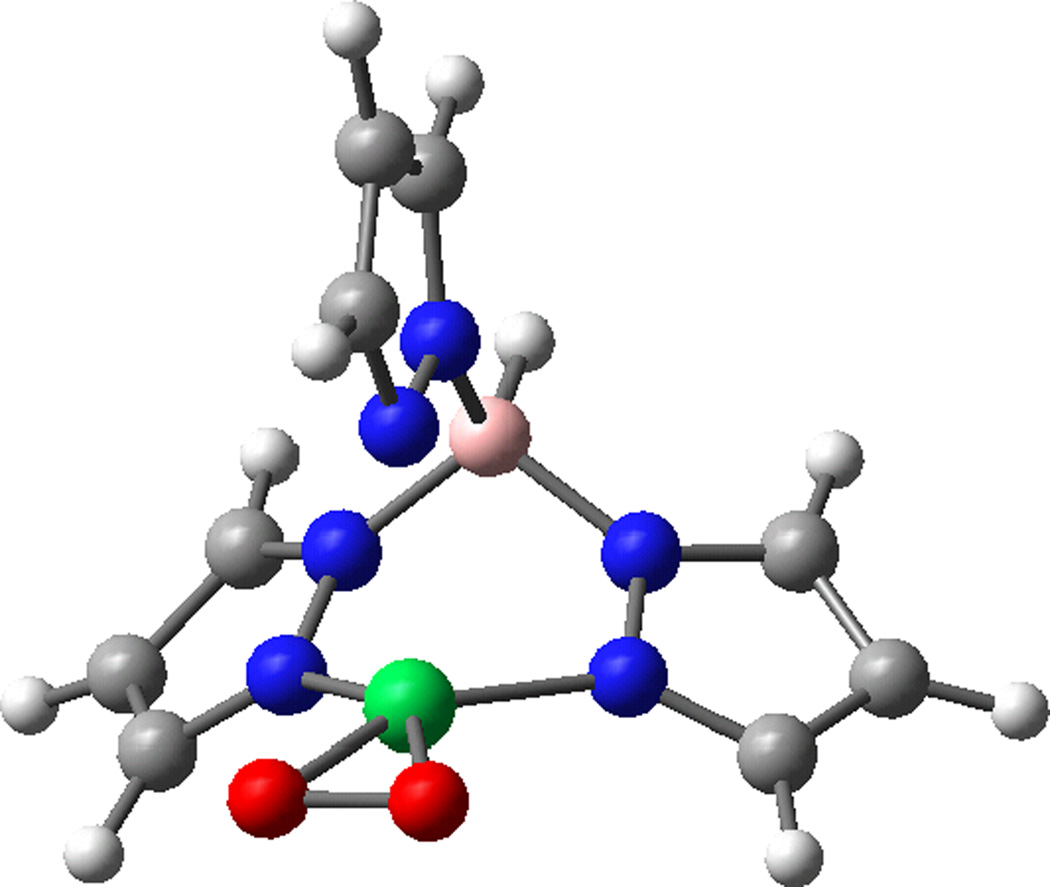
Density functional theory optimized geometry of tris-pyrazolborate Cu(II) hydroperoxo model complex. Color codes: Cu, green; B, light pink; N, blue; C, gray; O, red; S, yellow; H, light blue.
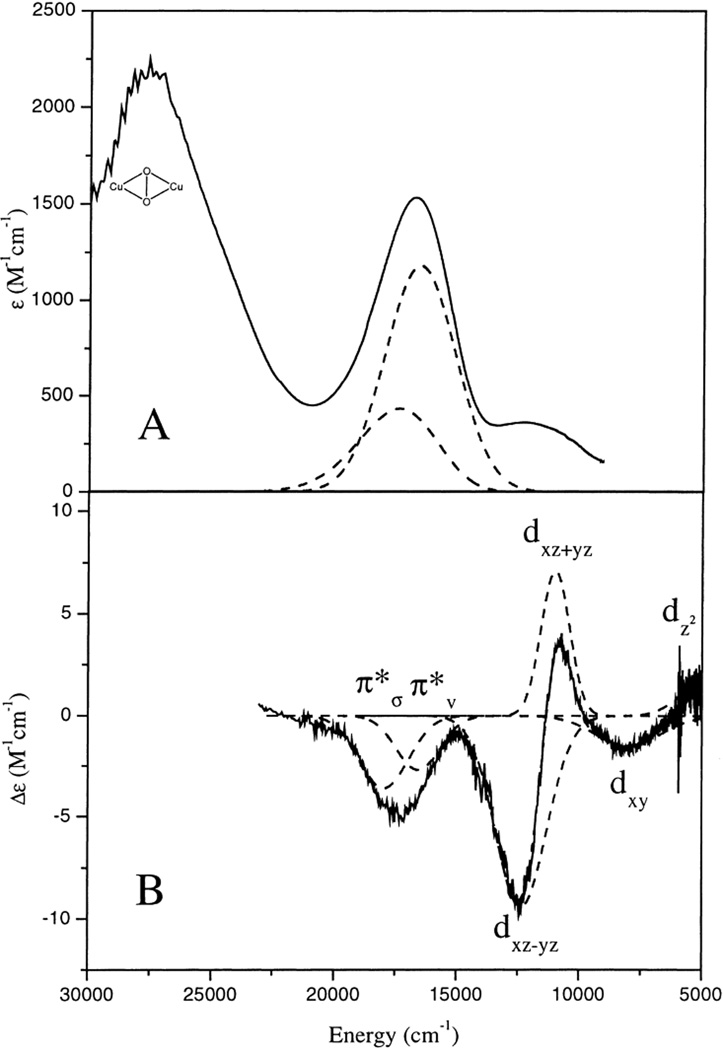
A. 220 K solution absorption spectrum of hydrotris(3-tert-butyl-5-isopropyl-1-pyrazolyl)borate Cu(II)-hydroperoxo (referred as L3CuOOH) in tert-butylbenzene. B. 5 K, 7 T MCD spectrum of L3CuOOH in a toluene glass. The Gaussian-resolved bands are shown in dashed lines along with their spectral assignments. (Reprinted with permission from Ref. . Copyright 2000 American Chemical Society.)
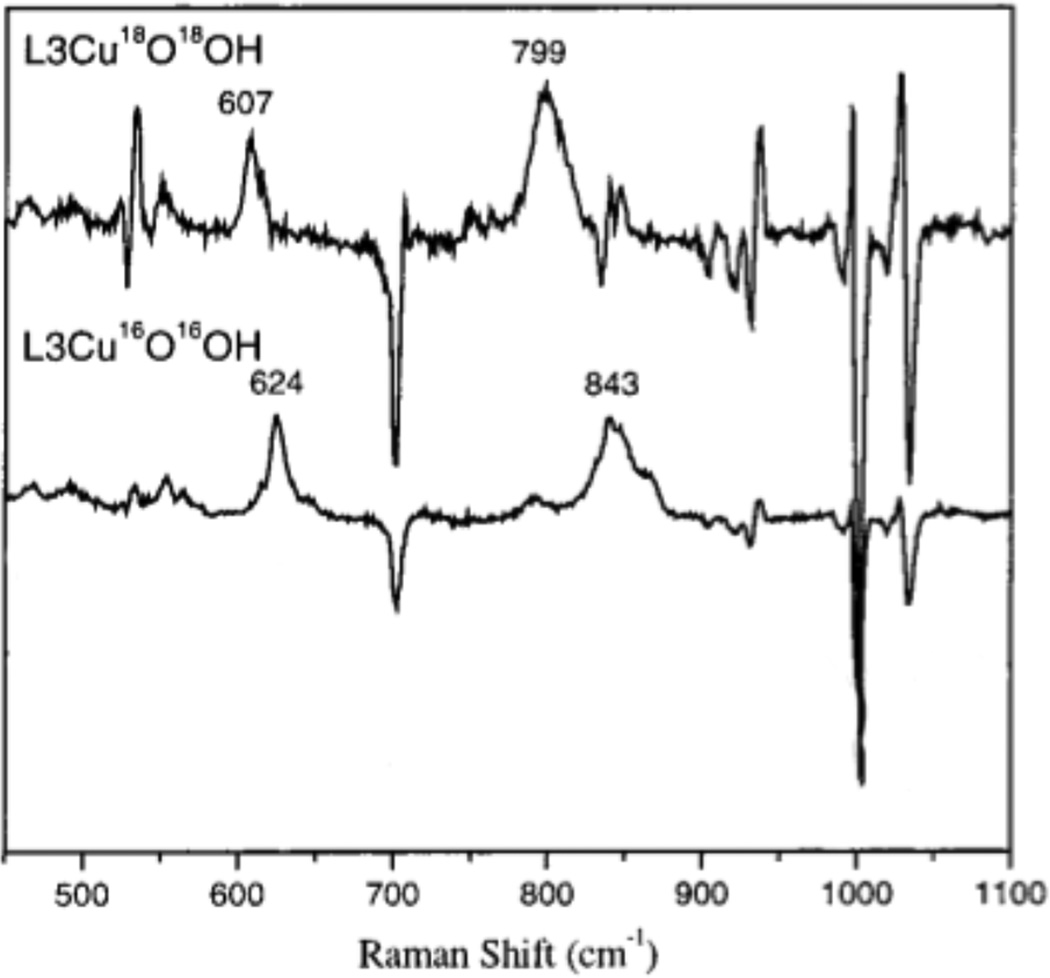
77 K Resonance Raman spectra of L3Cu18O18 OH and L3CuOOH excited at 568.2 nm in a tert-butylbenzene glass. (Reprinted with permission from Ref. . Copyright 2000 American Chemical Society.)

Energy optimized geometry of oxidized putative hydroperoxo intermediate CuIIM-OOH, [CuIIM(Met)(His)2(H2O)(OOH)]+, relevant bond lengths (Å) are indicated. Color codes: Cu, green; N, blue; C, gray; O, red; S, yellow; H, light blue. Surface contour plot of frontier molecular orbital LUMO of the CuIIM-OOH model. Orbital decompositions (%) are given. (Reprinted with permission from Ref. , copyright 2004 National Academy of Sciences, USA.)
DFT optimized geometry of tris-pyrazolborate Cu(II)-superoxo model complex. The atoms are colored by atom type, the copper is green and the boron is pink.
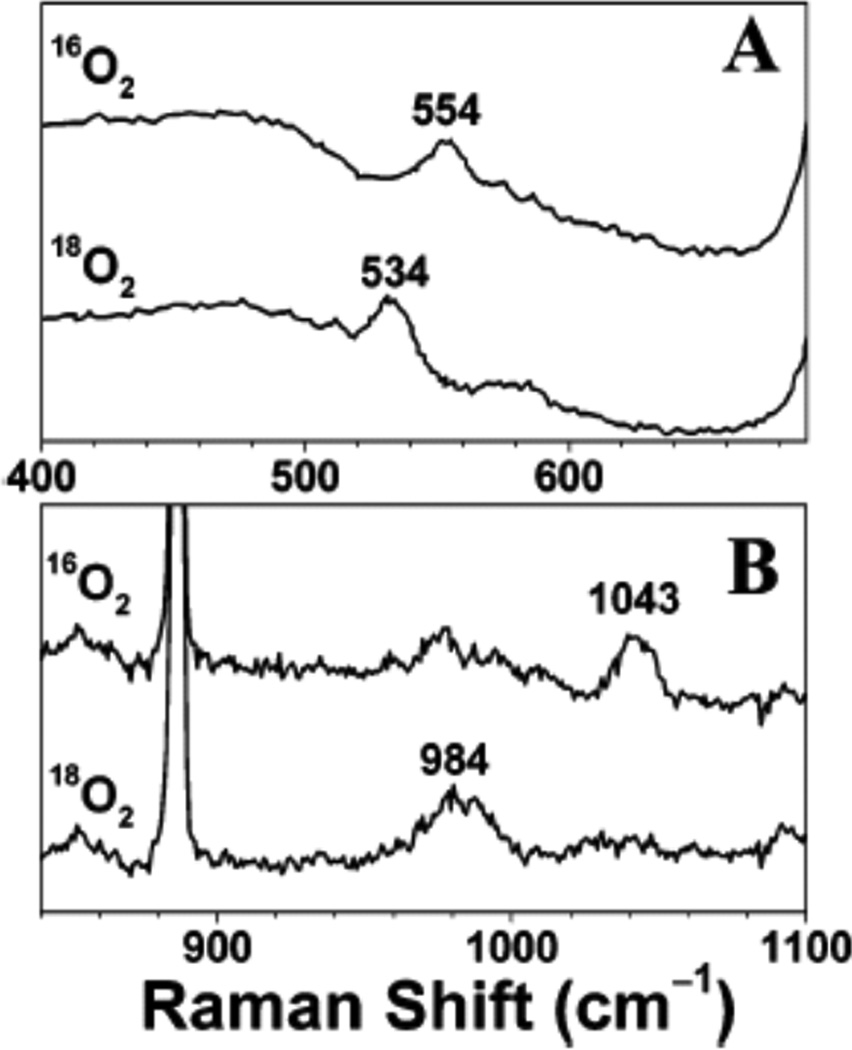
A. Resonance Raman spectra of hydrotris(3-tert-butyl-5-isopropyl-1-pyrazolyl)borate Cu(II)-superoxo (referred as L3CuO2) excited at 406.7 nm (~24,590 cm−1). B. hydrotris(3-adamantyl-5-isopropyl-1-pyrazolyl)borate Cu(II)-superoxo (referred as L10CuO2) excited at 482.5 nm (~20,725 cm−1) in CH2Cl2. (Reprinted with permission from Ref Copyright 2003 American Chemical Society.)
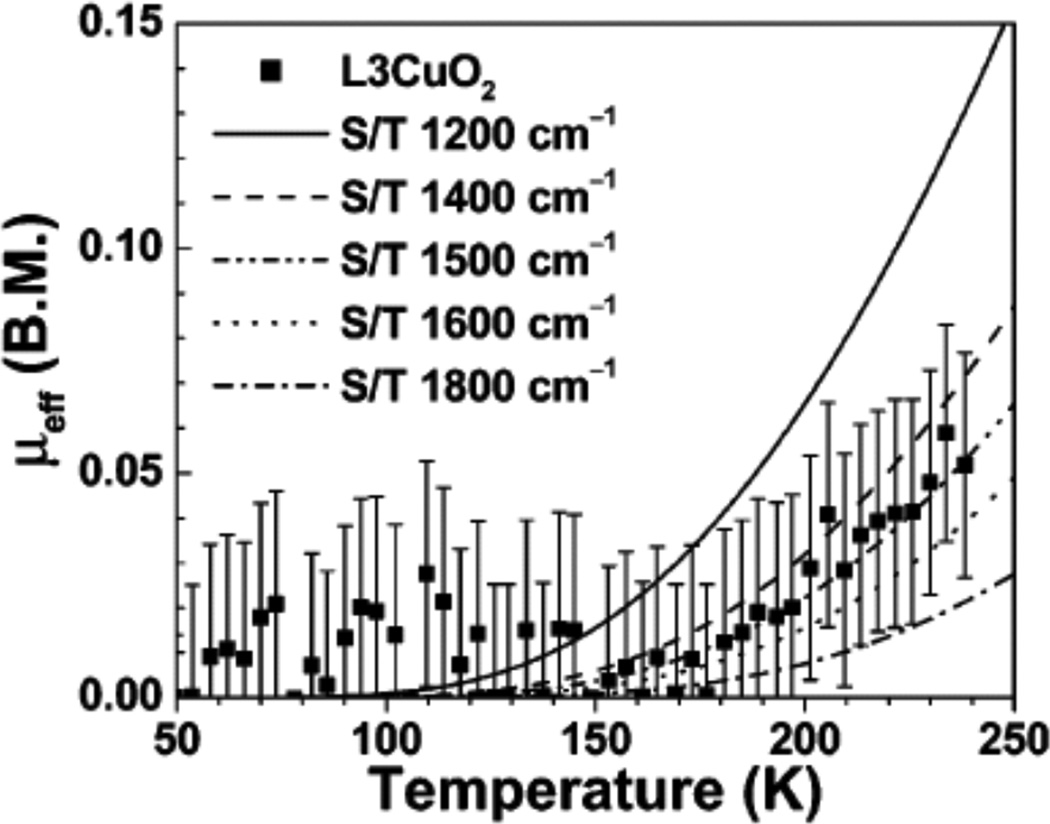
SQUID measured effective magnetic moment μeff (B.M. = Bohr magneton) of L3CuO2. Lines are the simulated curves assuming the S/T energy splitting (ES=1 – ES=0) = 1800, 1600, 1500, 1400, or 1200 cm−1. (Reprinted with permission from ref Copyright 2003 American Chemical Society.)
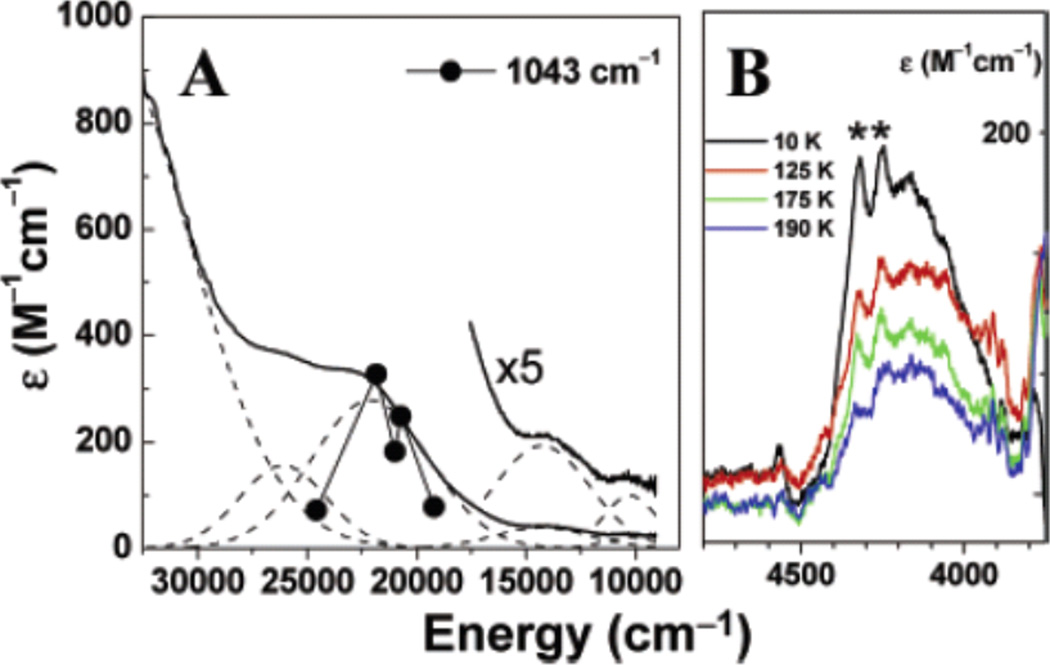
A. UV/vis absorption spectrum of L10CuO2 in CH2Cl2 at −70 °C (solid line) with Gaussian resolved individual transitions (dashed lines). Overlaid is the rR profile of the 1043 cm−1 vibrational mode of L10CuO2 (•). B. Variable temperature near-IR mull absorption spectra of L10CuO2. Vibrational overtones of the mulling agent are labeled as “*”.(Reprinted with permission from ref Copyright 2003 American Chemical Society.)
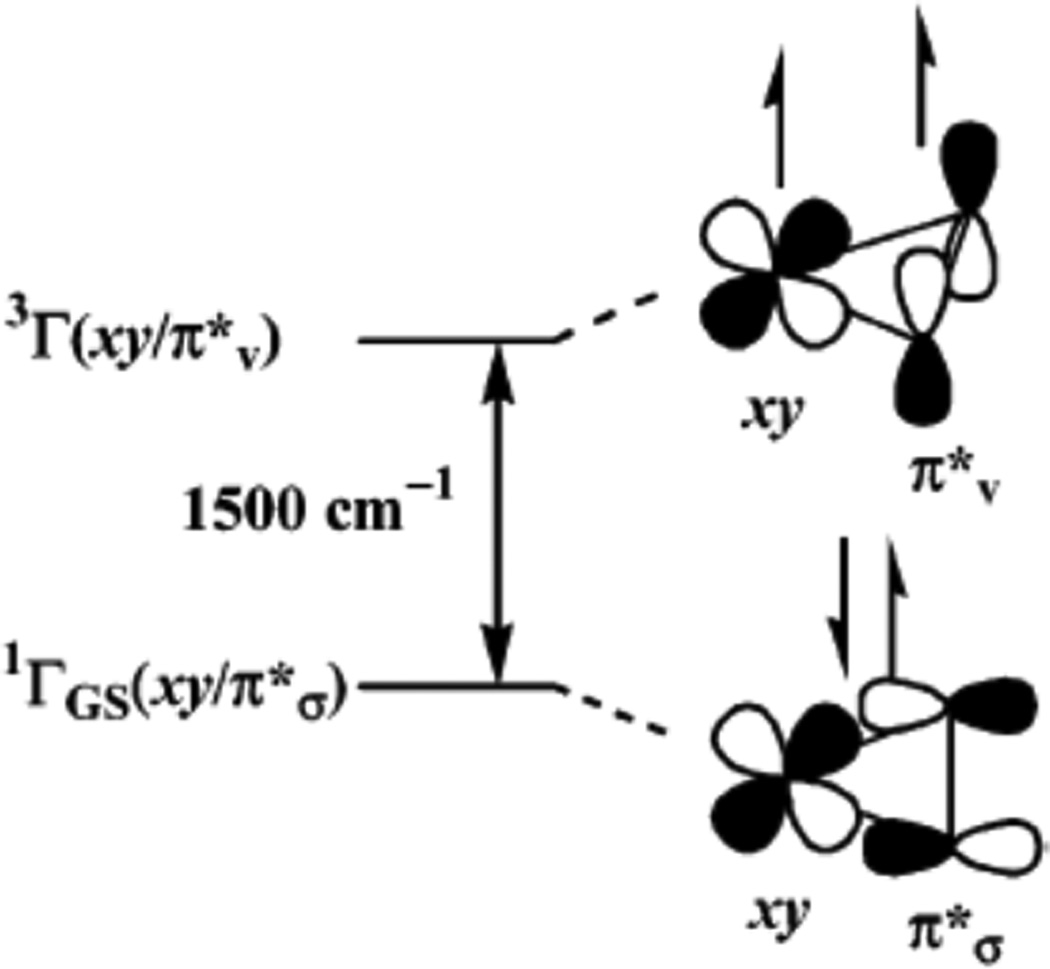
Schematic diagram bonding interaction of the singlet ground state and the lowest triplet state. (Reprinted with permission from ref Copyright 2003 American Chemical Society.)
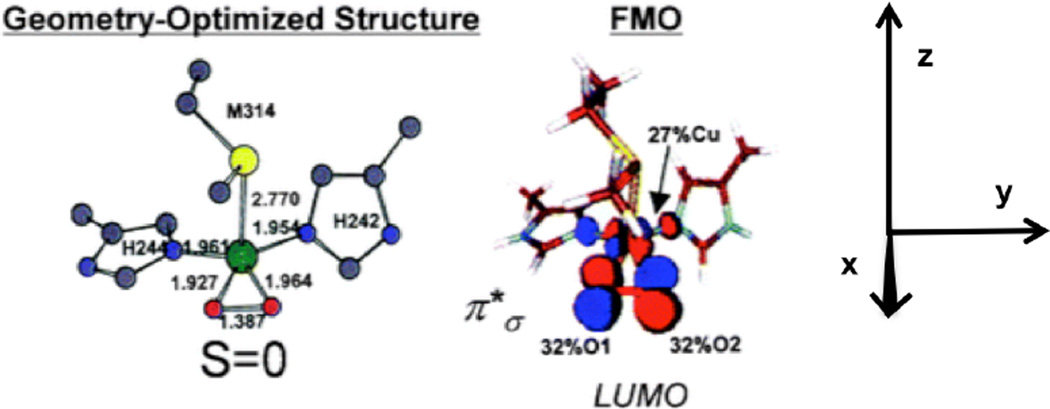
Energy optimized geometry of putative side-on CuIIM-superoxo, [CuIIM(Met)(His)2(O2)]+, relevant bond lengths (Å) are indicated. Color codes: Cu, green; N, blue; C, gray; O, red; S, yellow; H, light blue. Surface contour plot of frontier molecular orbital LUMO of the CuIIM-OO− model. Orbital decompositions (%) are given. (Reprinted with permission from Ref. , copyright 2004 National Academy of Sciences, USA.)
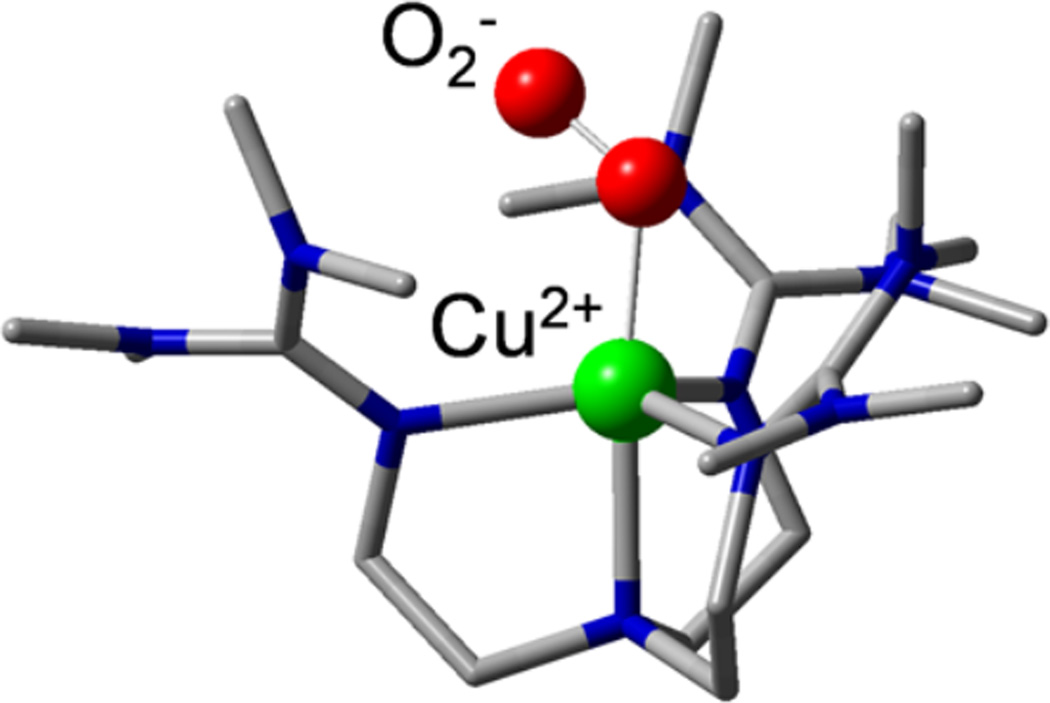
Crystal structure of the [TMG3trenCuO2]+ model complex .
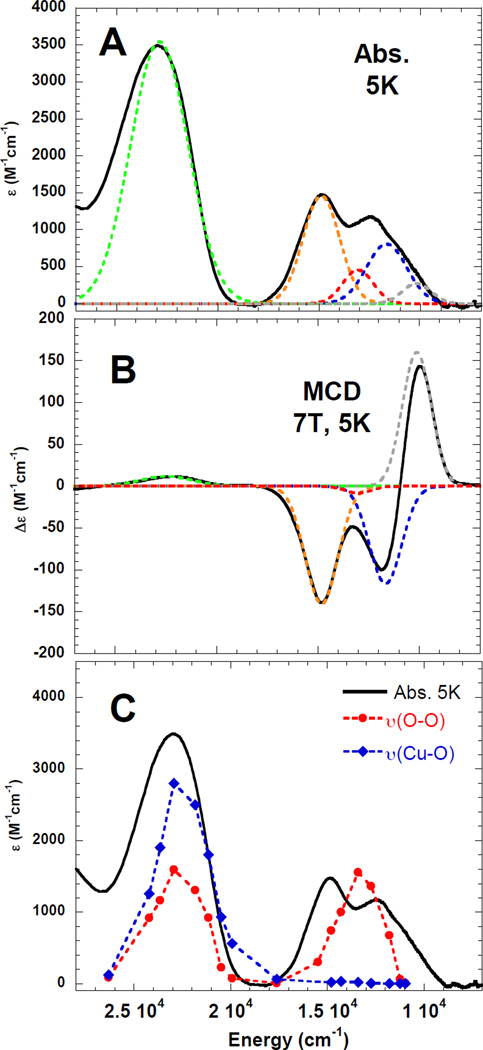
A. Low temperature absorption and B. MCD spectra of [TMG3trenCuO2]+
C. Low temperature (5K) absorption spectrum of [TMG3trenCuO2]+ (black) and rR profile for ν(Cu-O) (435cm−1, blue) and ν(O-O) (1120cm−1, red) (77K). (Reprinted with permission from ref Copyright 2010 American Chemical Society.))
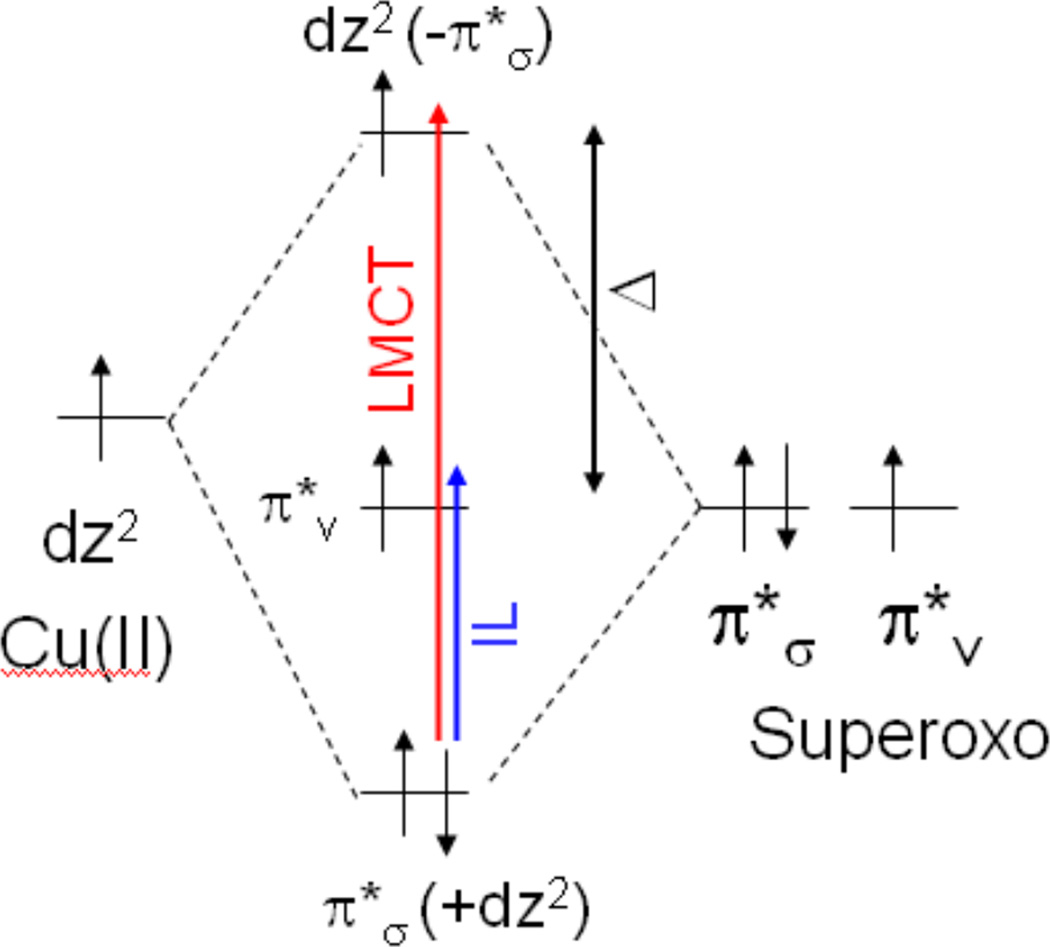
Schematic molecular orbital diagram of the copper-superoxo bonding in [TMG3trenCuO2]+. The LMCT (red) and IL (blue) transitions are shown, as are the orbital energy separations (Δ). The π*σ (+dz2) MO is dominantly superoxo-based and σ-bonding to dz2 and the dz2(−π*σ) MO is dominantly copper-based and σ-antibonding to π*σ. (Reprinted with permission from ref Copyright 2010 American Chemical Society.))
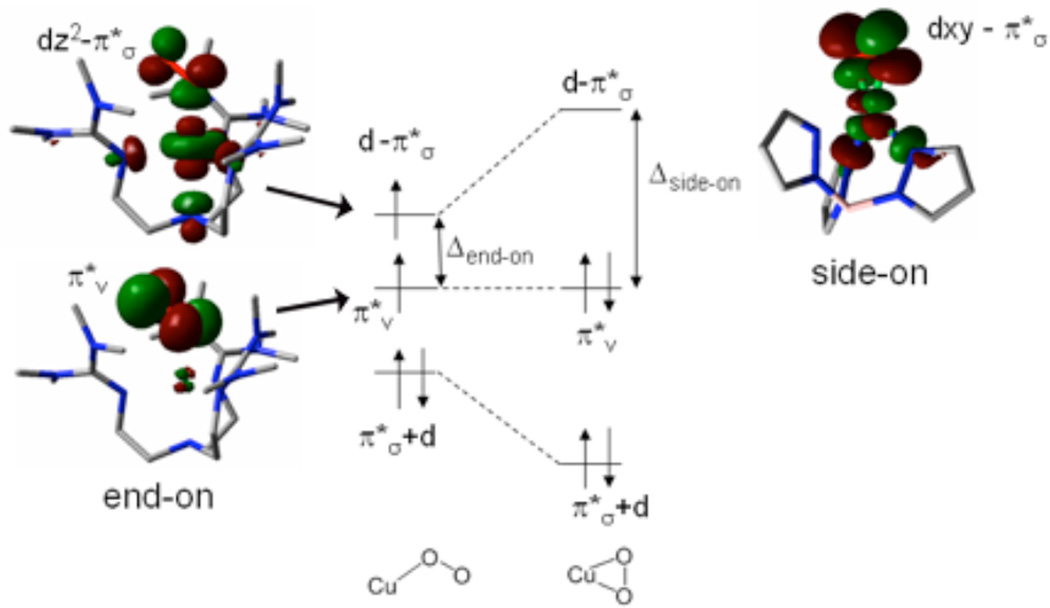
Diagram (middle) showing the transition between end-on and side-on with frontier molecular orbitals of [TMG3trenCuO2]+ as the end-on example and the frontier molecular orbital of tris-pyrazolyl borate Cu(II)-superoxo as the side-on example.
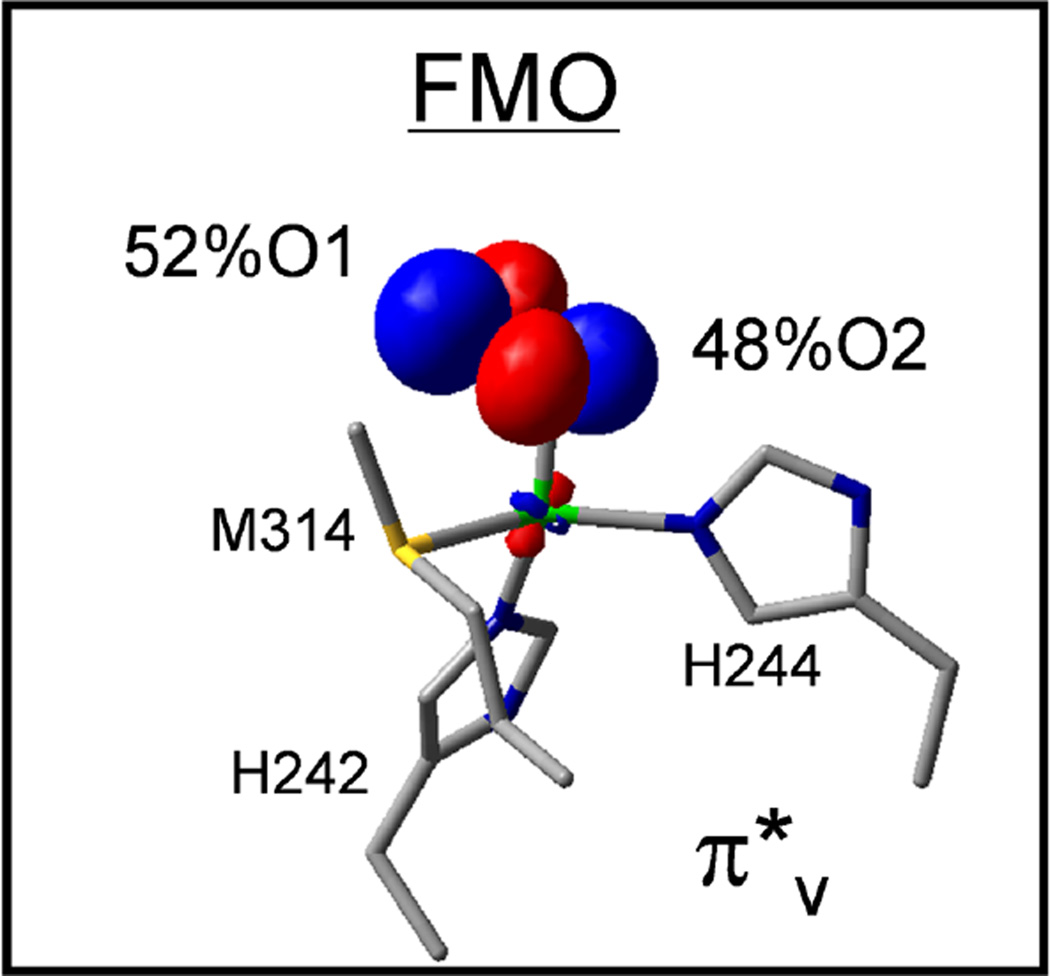
The frontier πv* molecular orbital of a Cu(II)-superoxo modeled in PHM, at CuM site. Reproduced by permission of The Royal Society of Chemistry (Reprinted with permission from ref .))
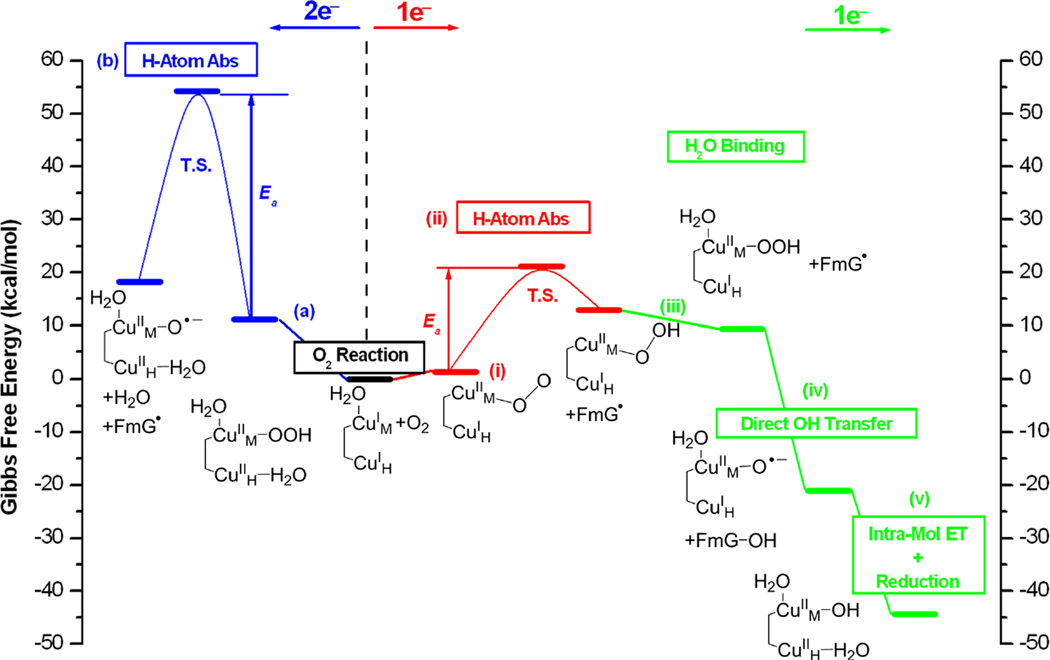
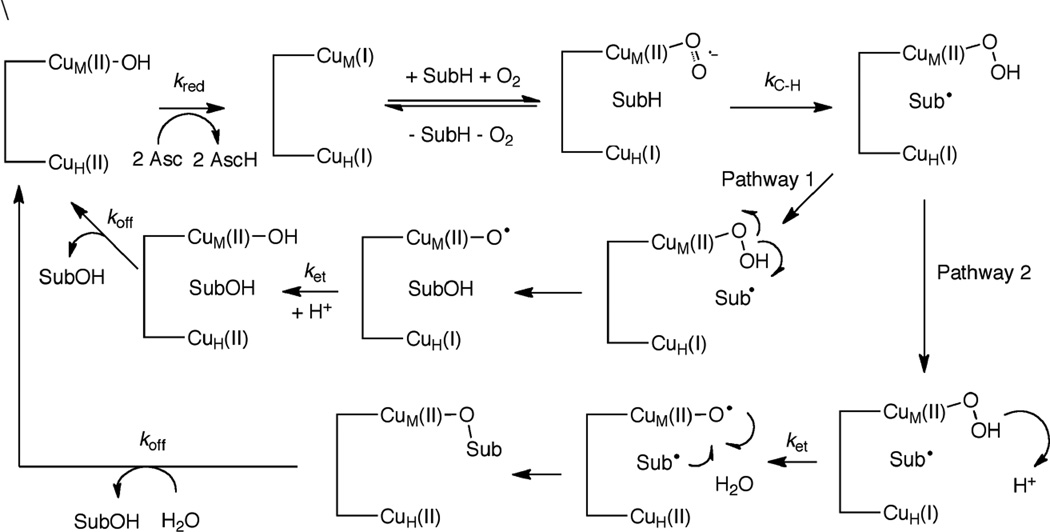
Summary of the 2e− (left, blue) and 1e− (right, red for H atom abstraction, green for subsequent steps) reaction pathways in PHM. For clarity, His and Met ligands are omitted in the structures. Only species that are essential to the reactions are indicated in the figure. Free energies are referenced to the initial reactions, which are set to zero. The proton and H2O ligand in steps (v) and (a) and the H2O ligand in step (iii) are from the solvent. Reproduced by permission of The Royal Society of Chemistry (Reprinted with permission from ref ))
Reactions catalyzed by Galactose Oxidase
Ping-pong mechanism for the radical cofactor in Galactose Oxidase.
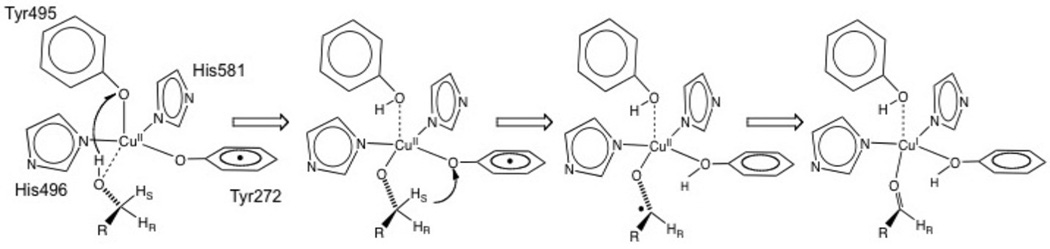
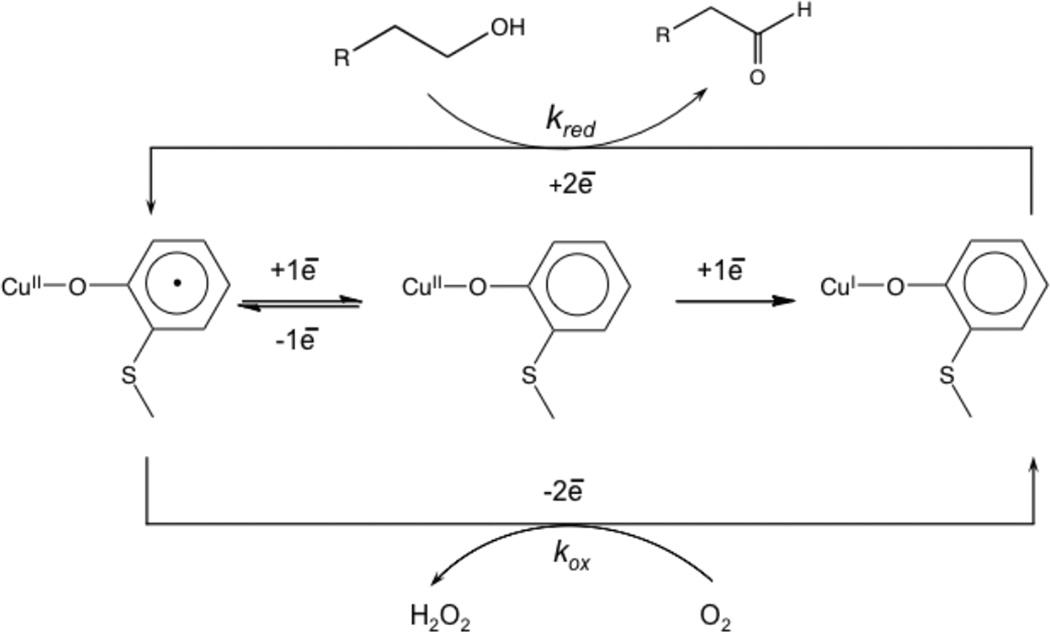
Proposed catalytic mechanism for substrate oxidation by Galactose Oxidase.
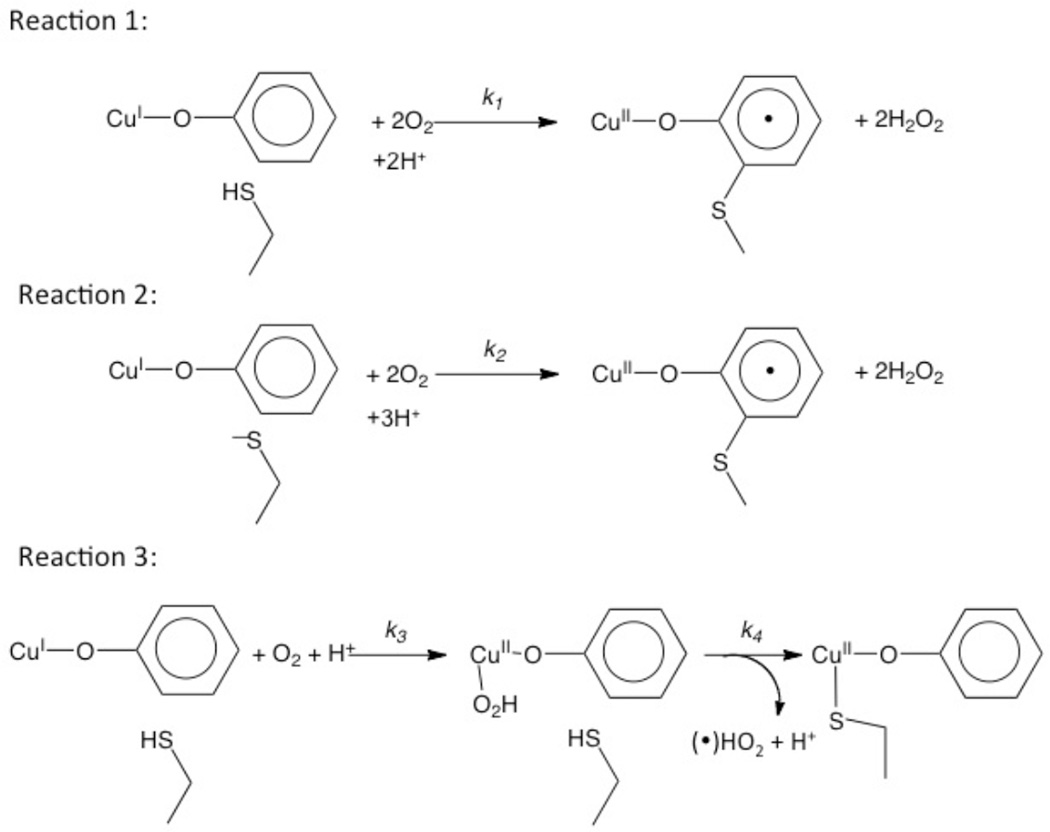
pH dependent reactions for the biogenesis of the cofactor in preprocessed GO-Cu(I).
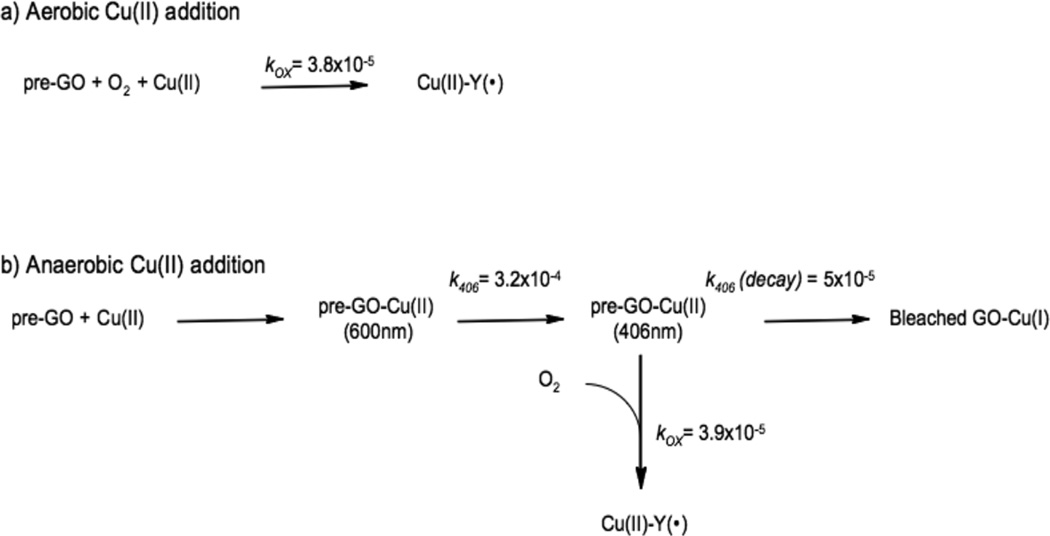
Kinetic rates for the stoichiometric Cu(II) aerobic (a) and anaerobic (b) loading with premature Galactose Oxidase. All rates are in s−1.
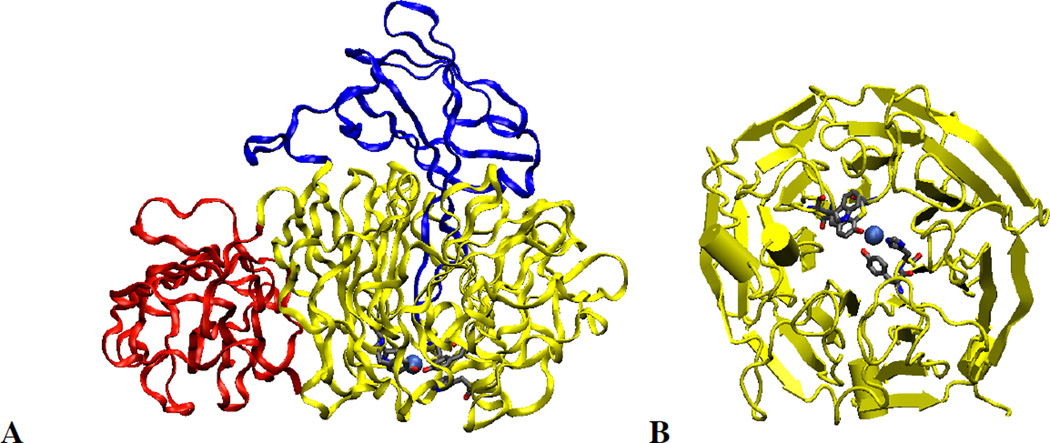
Molecular model of Galactose Oxidase, showing the three domains (red domain 1, yellow domain 2 and blue domain 3) (a). Computer generated model of the second domain showing the seven fold axis and the location of the copper ion inside the domain (b).
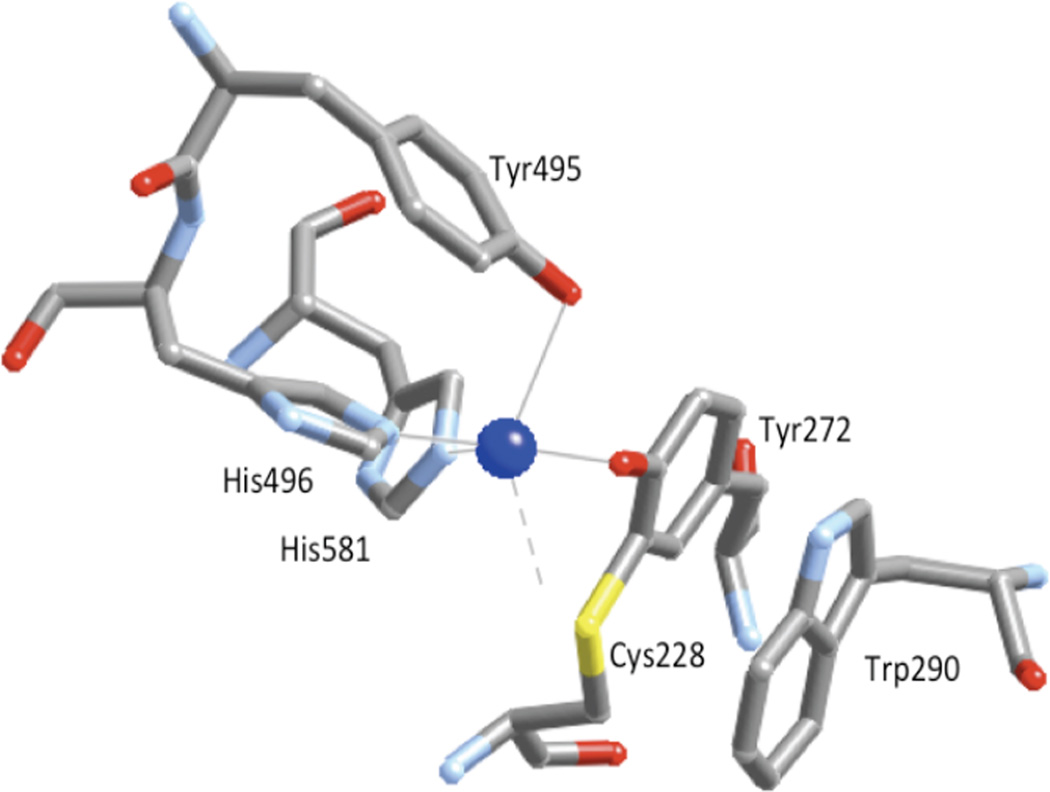
Active site of mature processed Galactose Oxidase showing residues Tyr272 (1.93 Å), Tyr495 (2.69 Å), His496 (2.11 Å), His581 (2.14 Å) and Trp290 and the open coordination position.
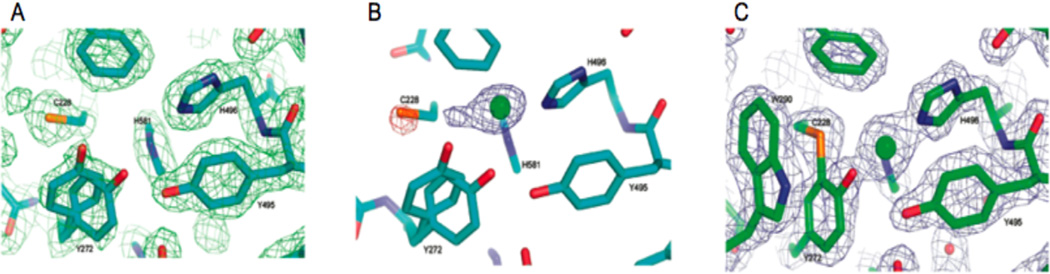
Crystal Structures of the active site of GO processing forms. (A) apo-GO, showing the disorder on Tyr272. (B) Crystal structure after 3 minutes soak on Cu(II) solution, indicating coordination of Cu(II) to the His in the active site. The negative peak on the Cys228 sulfur and the positive peak adjacent to copper are consistent with the rotation of the residue. (C) Crystal structure at 24h incubation with Cu(II), showing the thioeter bond and the Thr290 in its stacking position. (Reprinted with permission from Ref. , copyright 2008 American Chemical Society.)
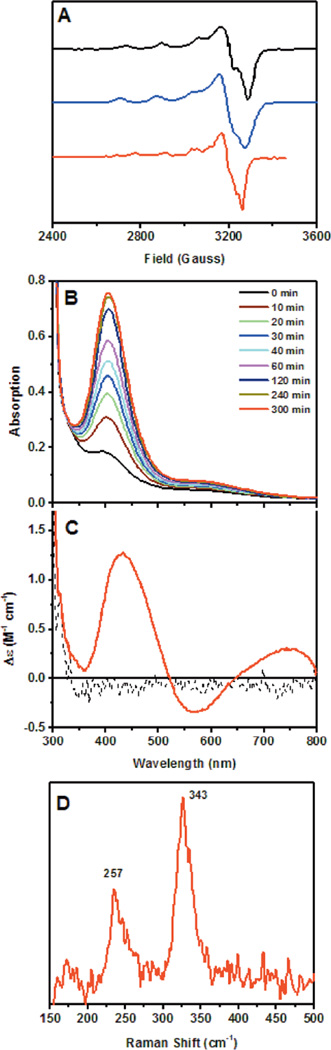
Spectral features of anaerobic Cu(II) loaded GO (406nm species). EPR from promptly made preprocessed GO-Cu(II) (A black) and 4 h incubation (A blue at 100K and A red at 305K). Absorption spectrum showing the formation of the 406 nm band (B). CD spectrum (C) and rR spectrum (D) of the 406 nm LMCT.
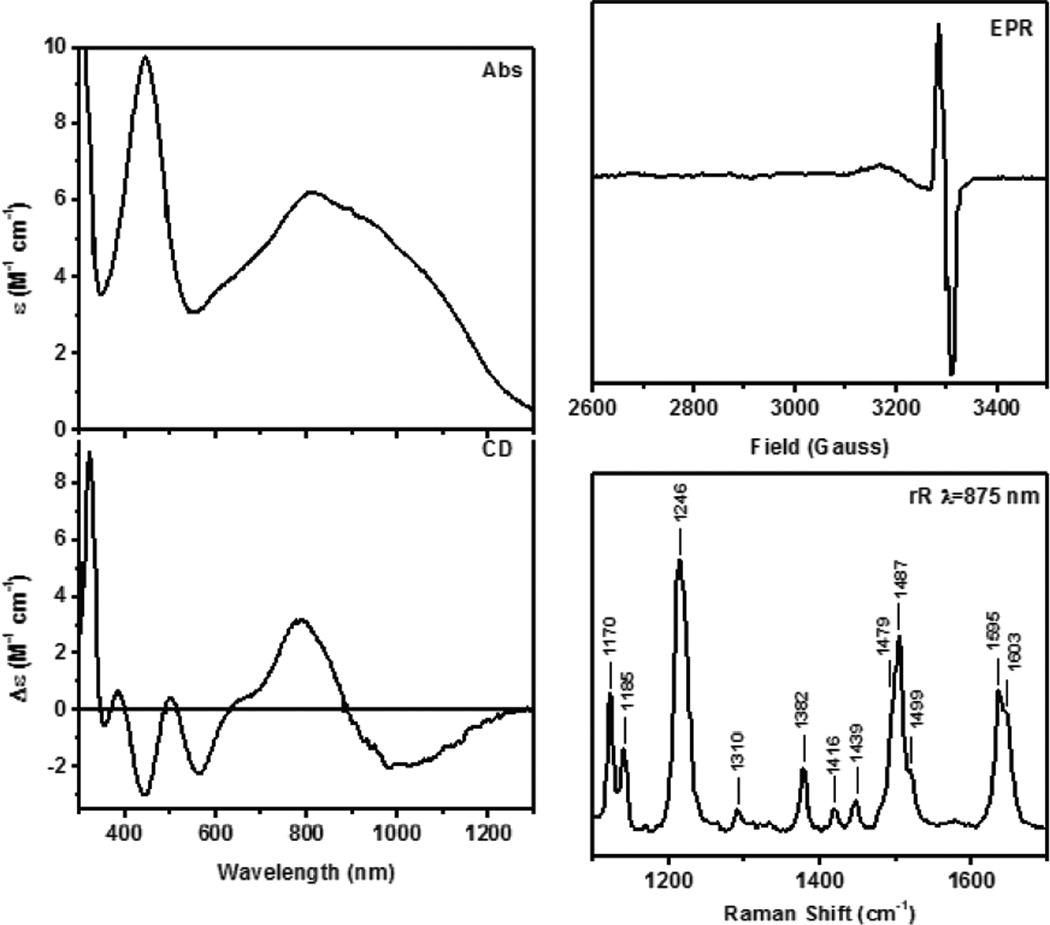
Spectral features of Cu(II)-Y(•). Absorption, Circular Dichroism, EPR and resonance Raman at 875nm.

Reaction mechanism for the aerobic copper(II) cofactor biogenesis. L has been reported to be water or a negative counterion from the crystallization buffer (see 3.5.3)

Reaction mechanism for the anaerobic copper(II) cofactor biogenesis
Reaction mechanism for the aerobic copper(I) cofactor biogenesis.
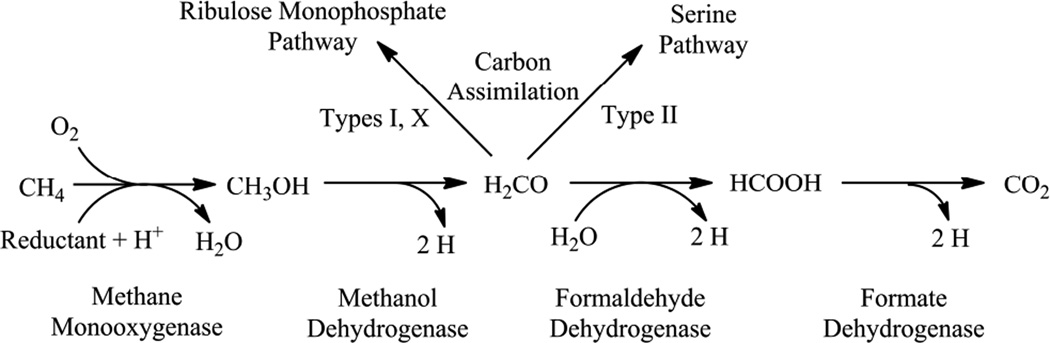
Methanotrophic bacteria metabolic pathway.
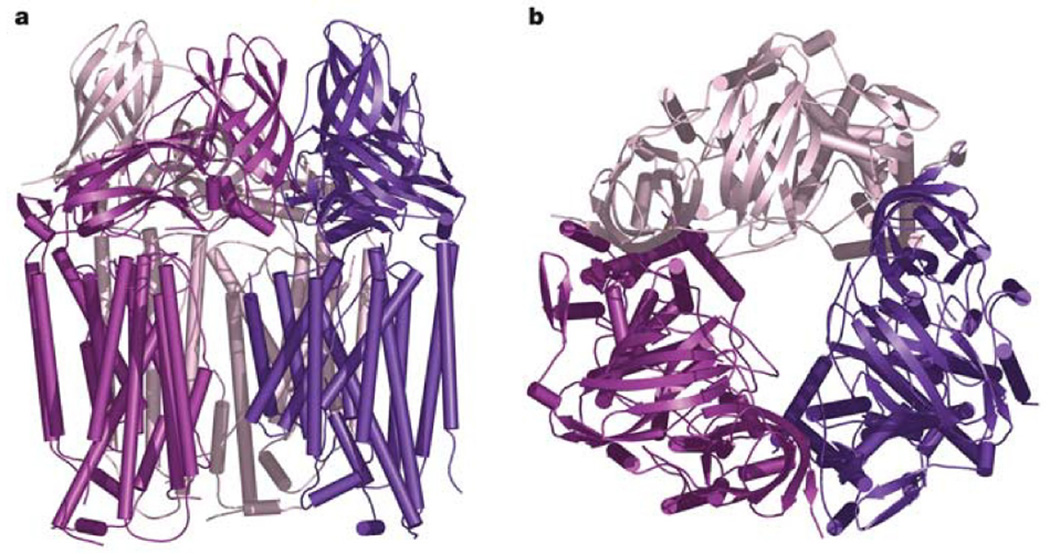
pMMO crystal structure. (a) Trimer viewed parallel to the membrane normal and (b) perpendicular to the membrane normal. The three protomers are shown in dark purple, magenta, and light pink. Helices are represented as cylinders and β strands are represented as arrows. The soluble domain is represented by the β-barrels. (Reprinted with permission from Macmillan Publishers Ltd: Nature Ref. , copyright 2005.)
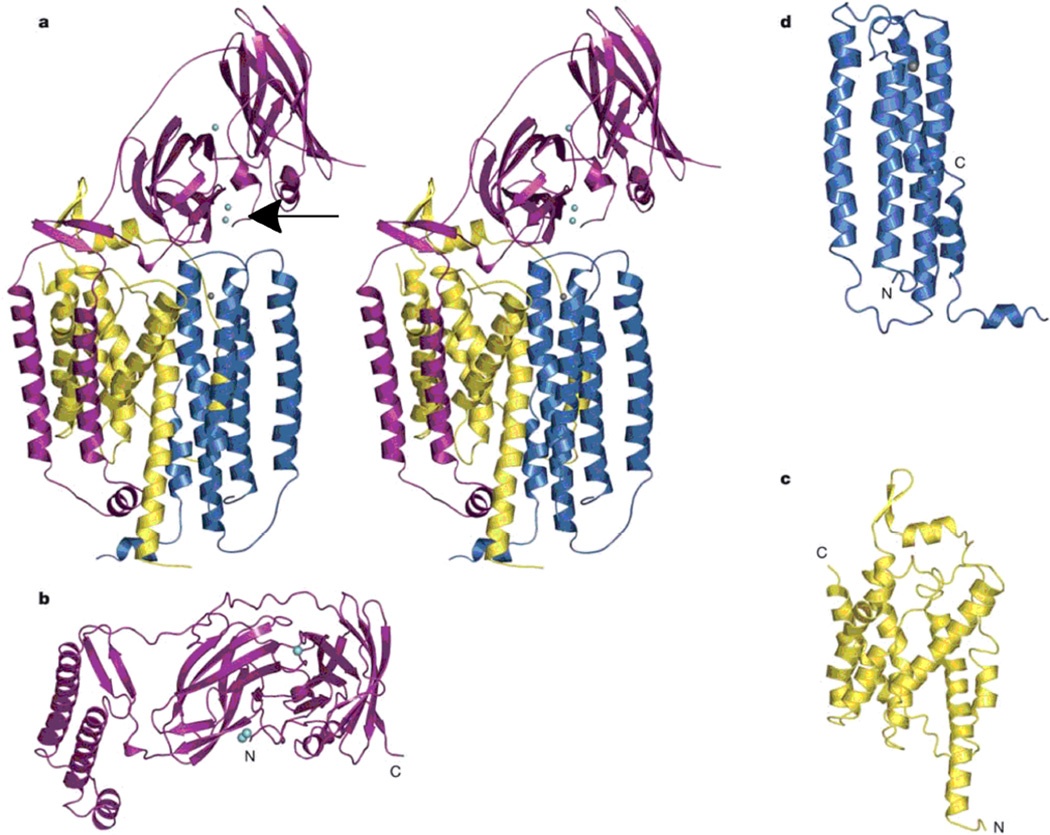
The pMMO subunits. (a) Stereoview of a single protomer with pmoB shown in magenta, pmoA shown in yellow, and pmoC shown in blue. Copper ions are shown as cyan spheres (the arrow points to the binuclear copper site), and a zinc ion is shown as a grey sphere. (b) The pmoB subunit viewed looking down the membrane normal. The N-terminal β-barrel is in the middle. (c) The pmoA subunit, and (d) the pmoC subunit. (Reprinted with permission from Macmillan Publishers Ltd: Nature Ref. , copyright 2005.)

The pMMO metal centers of the Bath enzyme. (a) Mononuclear copper center; (b) Binuclear copper center; and (C) ‘zinc center’, which contains copper in the OB3b enzyme. Ligand sets are color coded (Magenta (pmoB); Green (pmoC); and Blue (pmoA). (Reprinted with permission from Ref. . Copyright 2007 American Chemical Society.)

Proposed location of ‘Site D’ in the X-ray crystal structure of the pMMO Bath enzyme. (Reprinted with permission from Ref. . Copyright 2008 American Chemical Society.)
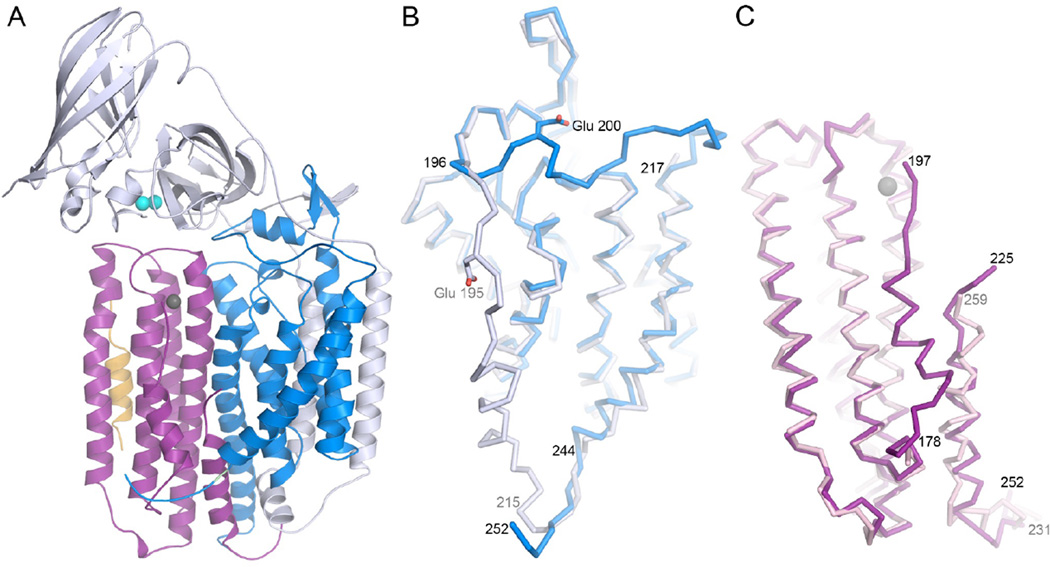
Structures of Methylocystis sp. strain M pMMO subunits. (A) One of the three protomers in the trimer. The pmoB, pmoA, and pmoC subunits are shown in gray, blue, and purple, respectively. Copper ions are shown in cyan and a zinc ion is shown in gray. The additional helix is shown in yellow. (B) Overlay of the pmoA subunits from the Methylocystis sp. strain M (blue) and the original M. capsulatus (Bath) (gray) structures. (C) Overlay of the pmoC subunits from the Methylocystis sp. strain M (purple) and the original M. capsulatus (Bath) structures. (Reprinted with permission from Ref. . Copyright 2011 American Chemical Society.)
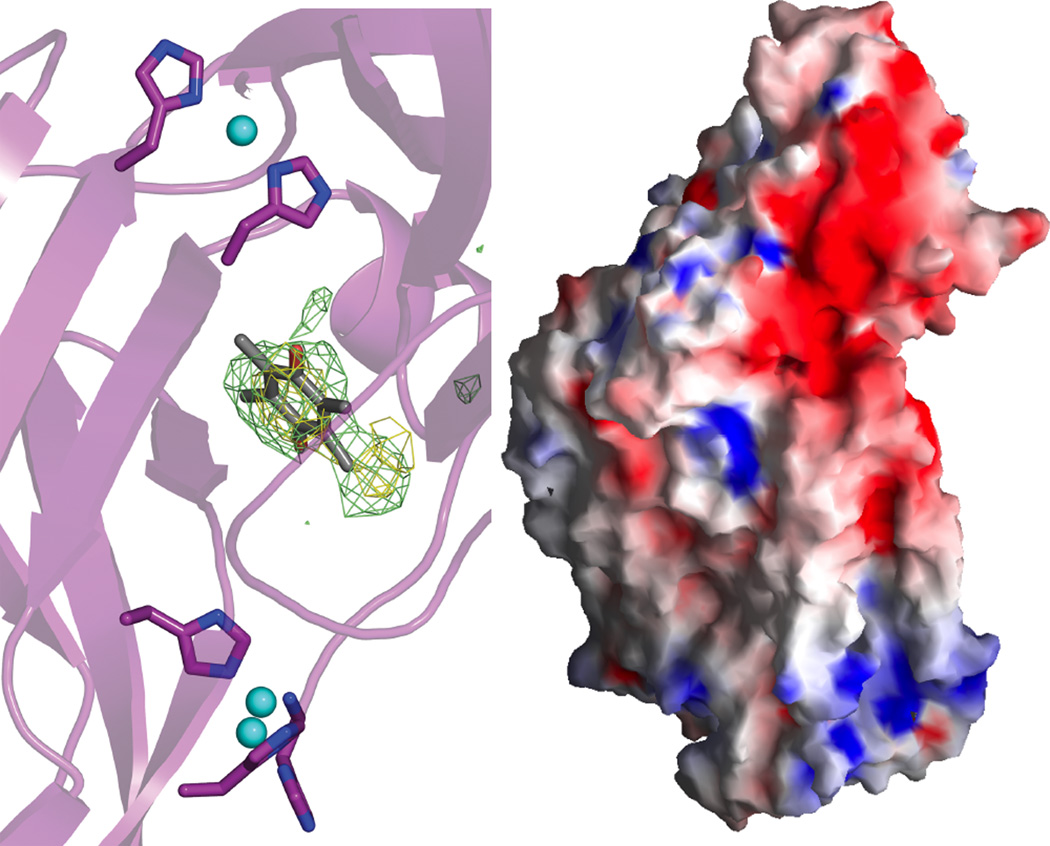
(Left) Unmodeled electron density located at the interface of the pmoB β-barrels. The 2Fo–Fc density (contoured at 1σ) is colored light green and the Fo–Fc density colored yellow (contoured at 3σ). A duroquinone molecule (HIC-up ID DQN) is superimposed on the density. (Right) Surface representation of the pMMO protomer colored according to electrostatic potential: red, −12 kT; white, 0 kT; blue, +12 kT. (Reprinted with permission from Macmillan Publishers Ltd: Nature Ref. , copyright 2005.)

Structure of Cu(I) full length-mb.. (Reprinted with permission from Ref. . Copyright 2011 American Chemical Society.)
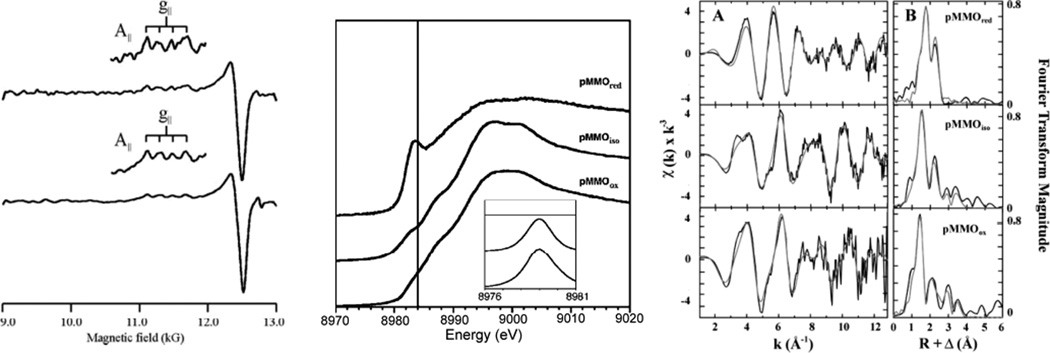
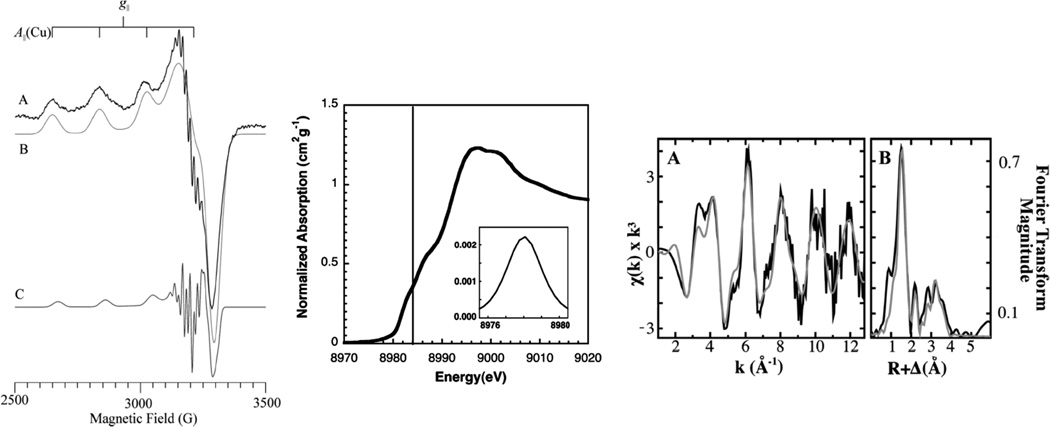
(Left) Q-band EPR spectra (2 K) of purified (upper) and membrane-bound (lower) pMMO. (Reprinted with permission from Ref. , copyright 2003 National Academy of Sciences, USA.) (Middle) Cu XANES spectra for pMMO from the Bath enzyme. (Right) Cu EXAFS fitting analysis. (Panel A) Raw unfiltered EXAFS data and fits. (Panel B) Fourier transforms and simulated fits. Empirical data are in black and fits are in gray. (Fit over a k range of 1–12.85 Å−1.) (Reprinted with permission from Ref. . Copyright 2006 American Chemical Society.)
(Left) X-Band EPR of purified M. trichosporium OB3b pMMO. (A) Experimental data; (B) and (C) simulations of the major and minor components, respectively. (Middle) Copper XANES spectrum of purified M. trichosporium OB3b pMMO (solid line indicates 8984 eV). (Right) Copper EXAFS fitting analysis for purified M. trichosporium OB3b pMMO. (A) Raw unfiltered EXAFS data (Black) and simulations (Gray) for copper bound to pMMO. (B) Fourier transforms of the raw EXAFS (Black) and the best-fit simulations (Gray). (Reprinted with permission from Ref. . Copyright 2008 American Chemical Society.)
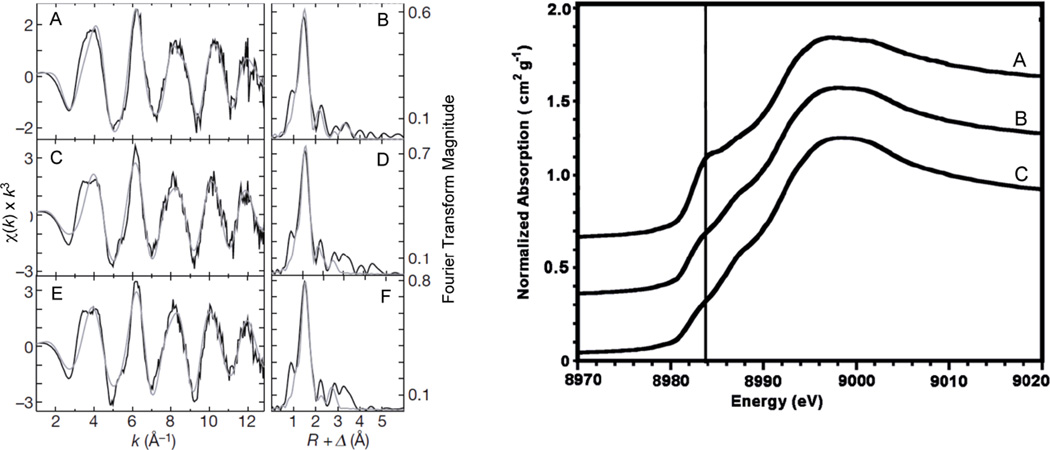
(Left) Copper EXAFS data and simulations for spmoB and spmoB variants. Raw k3-weighted EXAFS data and phase-shifted Fourier transforms are shown for spmoB (A,B), spmoB_H48N (C,D), and spmoB_H137,139A (E,F). Raw unfiltered data are shown in black and best-fit simulations are shown in grey. χ, EXAFS region of the XAS spectrum; Δ, apparent shift in Fourier transform displayed bond distance (by ~−0.5 Å) due to a phase shift during calculation of the transform; k, photoelectron wavevector; R, metal-ligand bond length. (Right) Normalized XANES spectra of spmoB (A), spmoB_H48N (B), and spmoB_H137,139A (C). Vertical line is drawn at ~8984 eV. (Reprinted by permission from Macmillan Publishers Ltd: Nature Ref. , copyright 2010.)
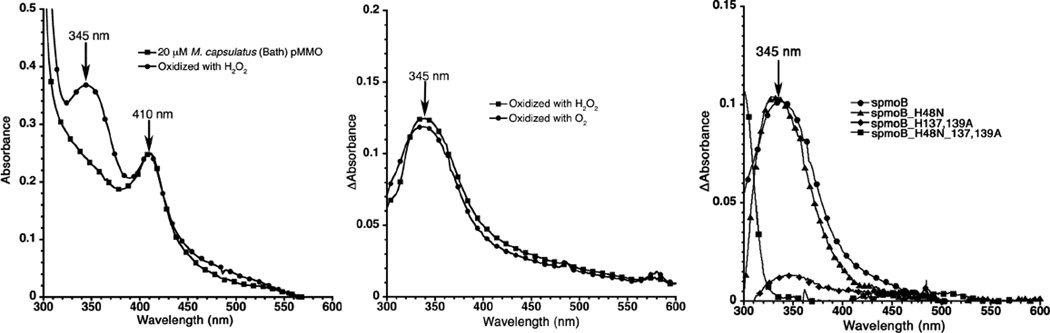
Absorption data for O2 and H2O2 binding in pMMO. (Left) H2O2 reacted with solubilized pMMO from M. capsulatus (Bath) (Heme contaminant absorbs at 410 nm). Difference absorption spectra for both H2O2 and O2 reacted with (Middle) spmoB and (Right) O2 with spmoB and the spmoB_H48N, spmoB_H137,139A, and spmoB_H148N_137,139A variants. All samples were anaerobically reduced before addition of oxidant. (Reprinted with permission from Ref. . Copyright 2012 American Chemical Society.)
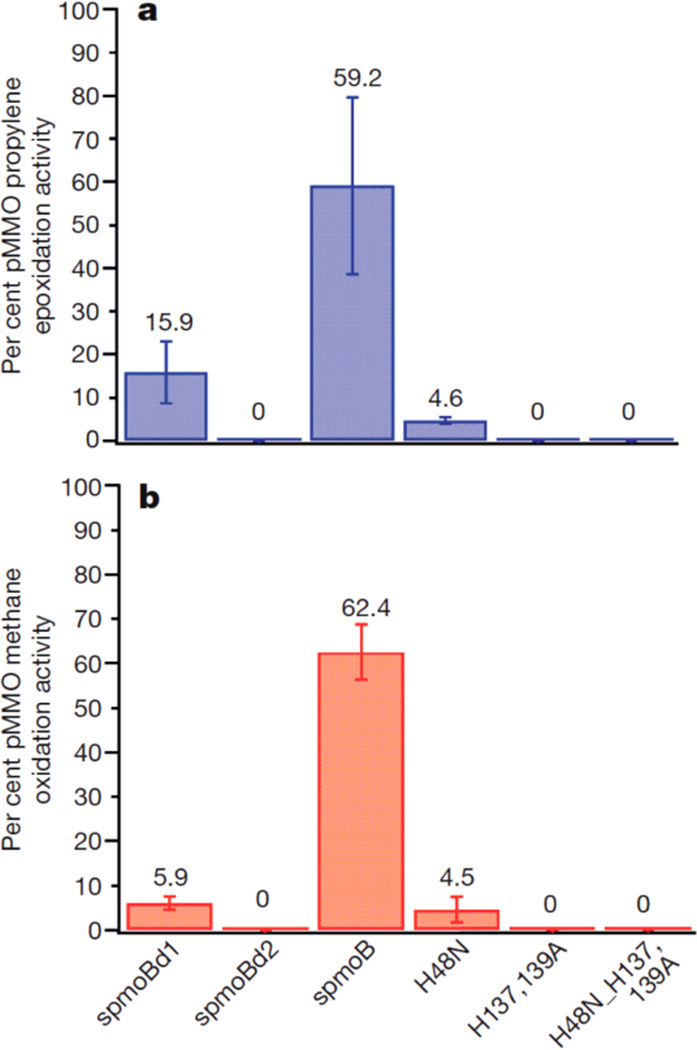
Catalytic activity of spmoB proteins. (a) Epoxidation activity measured as percentage of the activity of as-isolated, membrane bound pMMO from the Bath enzyme. (b) Methane oxidation activity measured as percentage of the activity of as-isolated, membrane bound pMMO from the Bath enzyme. (Reprinted by permission from Macmillan Publishers Ltd: Nature Ref. , copyright 2010.)

Two different mechanisms for H-atom abstraction from methane.
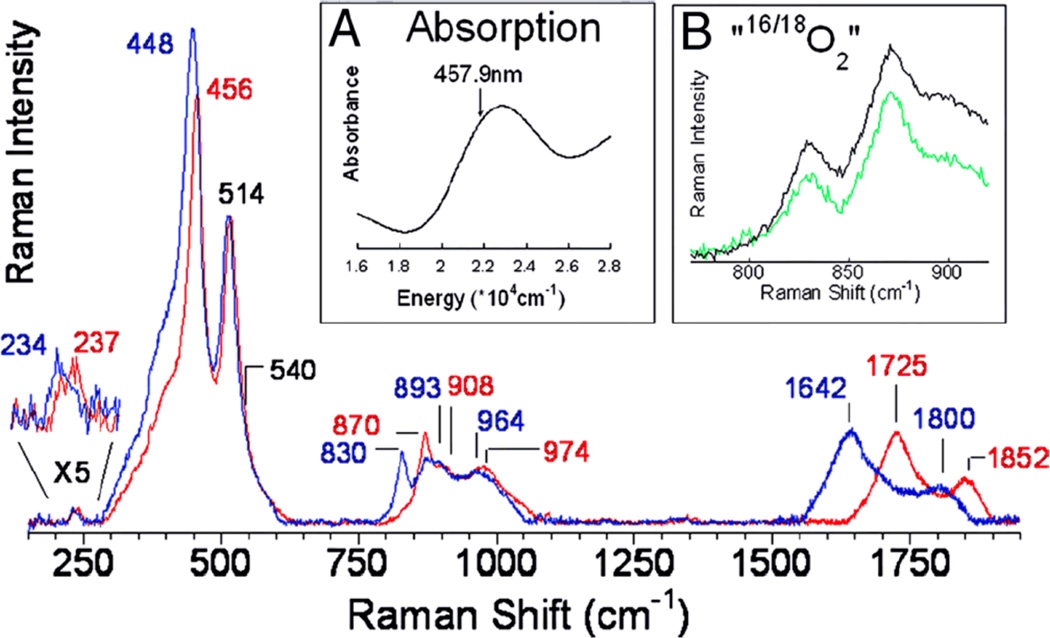
rR spectra of Cu-ZSM-5 + 16O2 and 18O2 (blue) using 457.9 nm excitation. Inset A: Absorption spectrum of O2 activated Cu-ZSM-5. Inset B: 16,18O2 (green) and a 1:1 normalized sum of 16O2 and 18O2 (black). (Reprinted with permission from Ref. .)
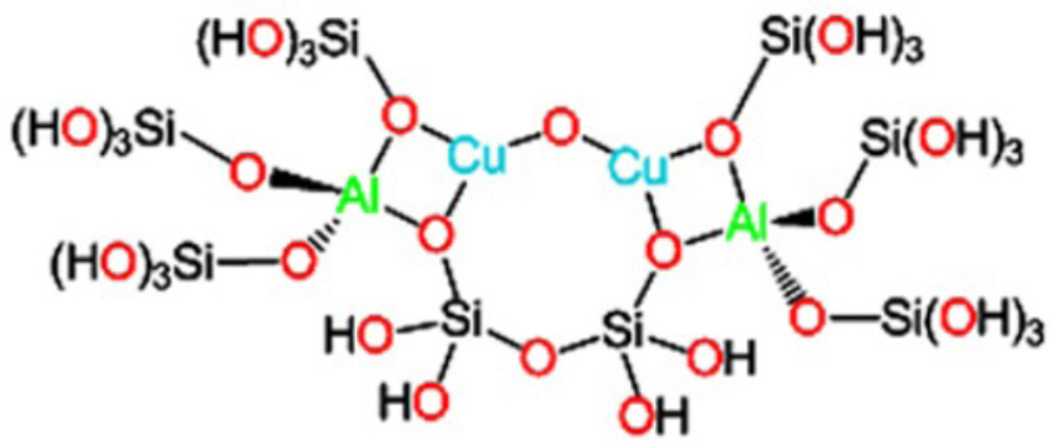
Model of the active [Cu2O]2+ core in the 10-membered ring of the ZSM-5 lattice. (Reprinted with permission from Ref. .)
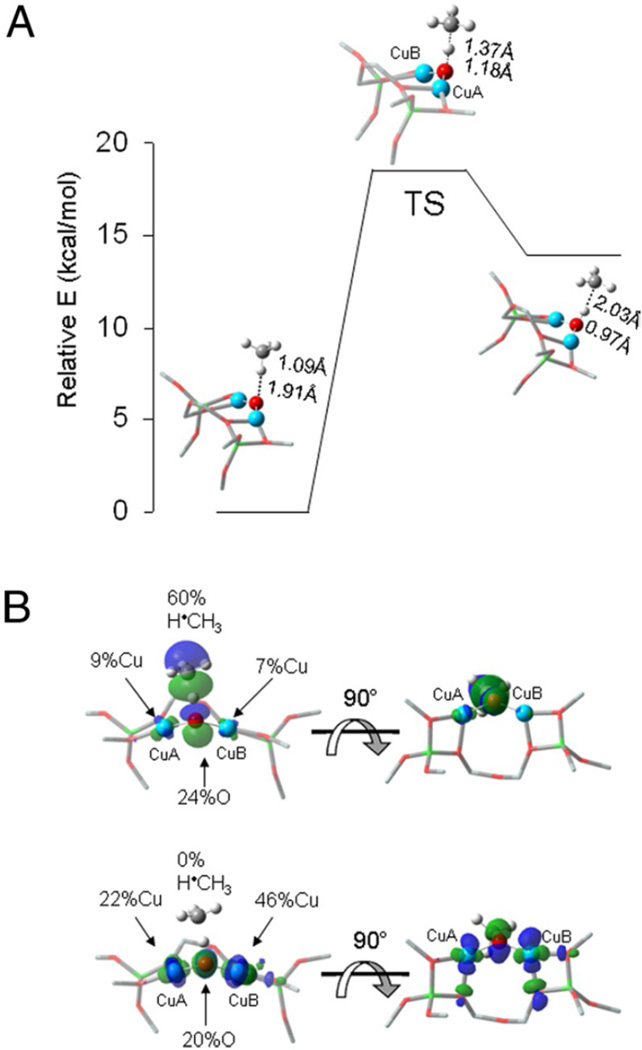
DFT-calculated reactivity of the Cu(II)2O core with CH4. (A) Reaction coordinate of H-atom abstraction from CH4 by Cu(II)2O. (B) SOMOs at the transition state. CH4 approach is shown in the plane (Left) and below the plane of the figure (Right). (Reprinted with permission from Ref. .)
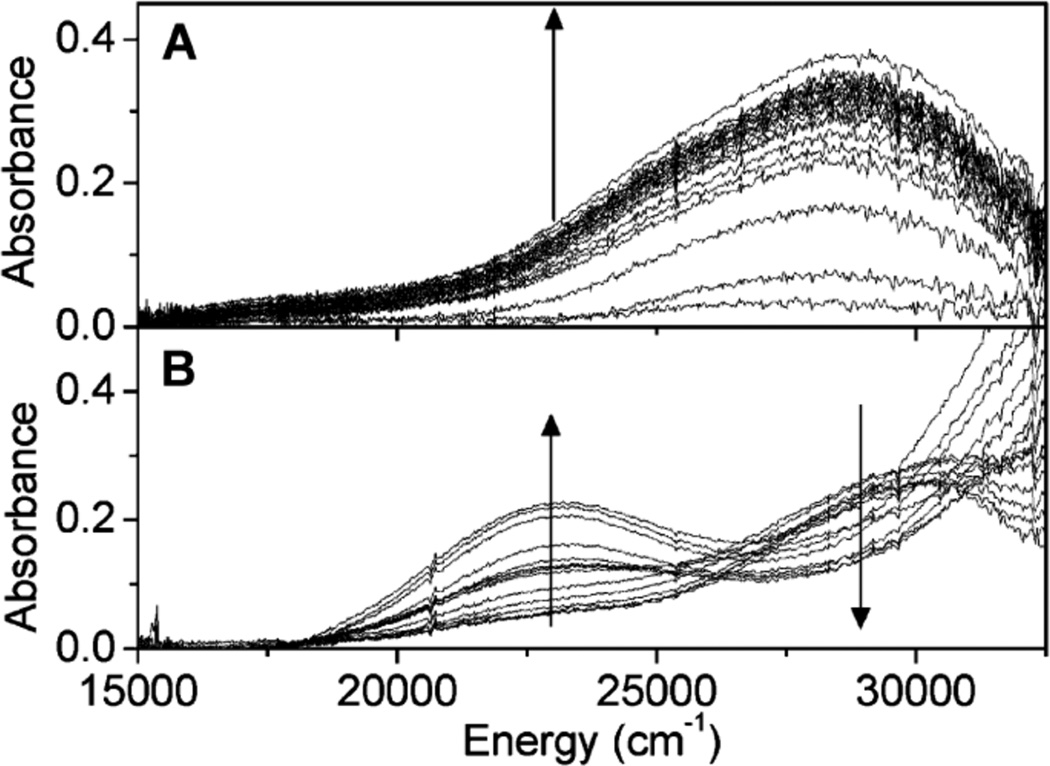
Diffuse reflectance UV-vis spectra of prereduced Cu-ZSM-5 (in He at 450 °C) during (A) O2 treatment at RT (time interval between spectra is 10 s during the first 2 min, and then every 50 s for 10 min) and (B) subsequent heating from 25 to 375 °C in He atmosphere (temperature interval between spectra is 25 °C. (Reprinted with permission from Ref. . Copyright 2010 American Chemical Society.)
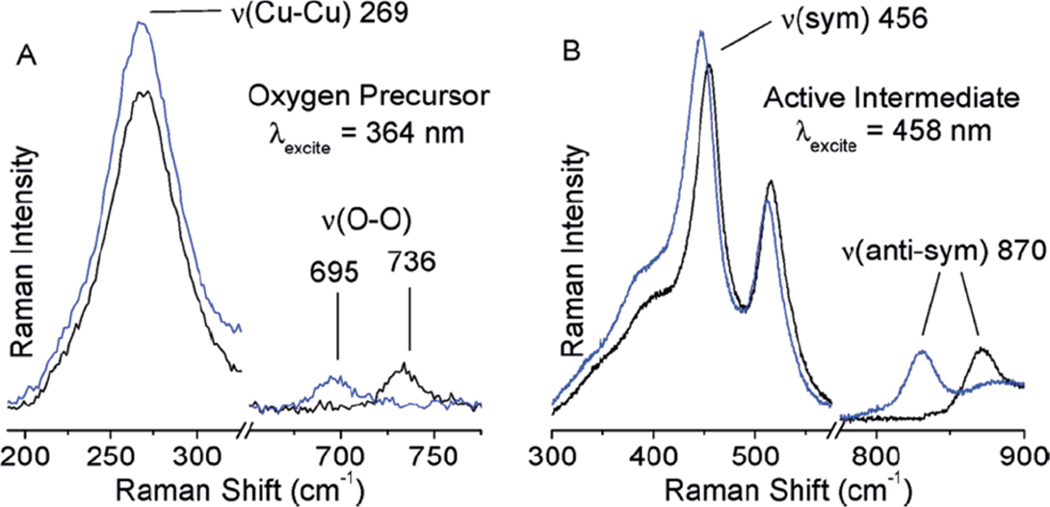
(A) rR spectra (363.8 nm) of 16O2 (black) and 18O2 (blue) precursor formed at RT and (B) rR spectra (457.9 nm) of the reactive site formed by heating the O2 precursor samples. (Reprinted with permission from Ref. . Copyright 2010 American Chemical Society.)

Reactivity cycle for methane oxidation in Cu-ZSM-5. (Reprinted with permission from Ref. . Copyright 2010 American Chemical Society.)

structural comparisons of multicopper oxidases. (A) 3-domain structure from Pyrobaculum aerophilum (PDB: 3AW5). (B) 6-domain structure from Homo sapiens (PDB: 2J5W). (C) 2-domain structure expressed in Escherichia coli (PDB: 2ZWN). Copper atoms depicted in gold, oxygen atoms in red.
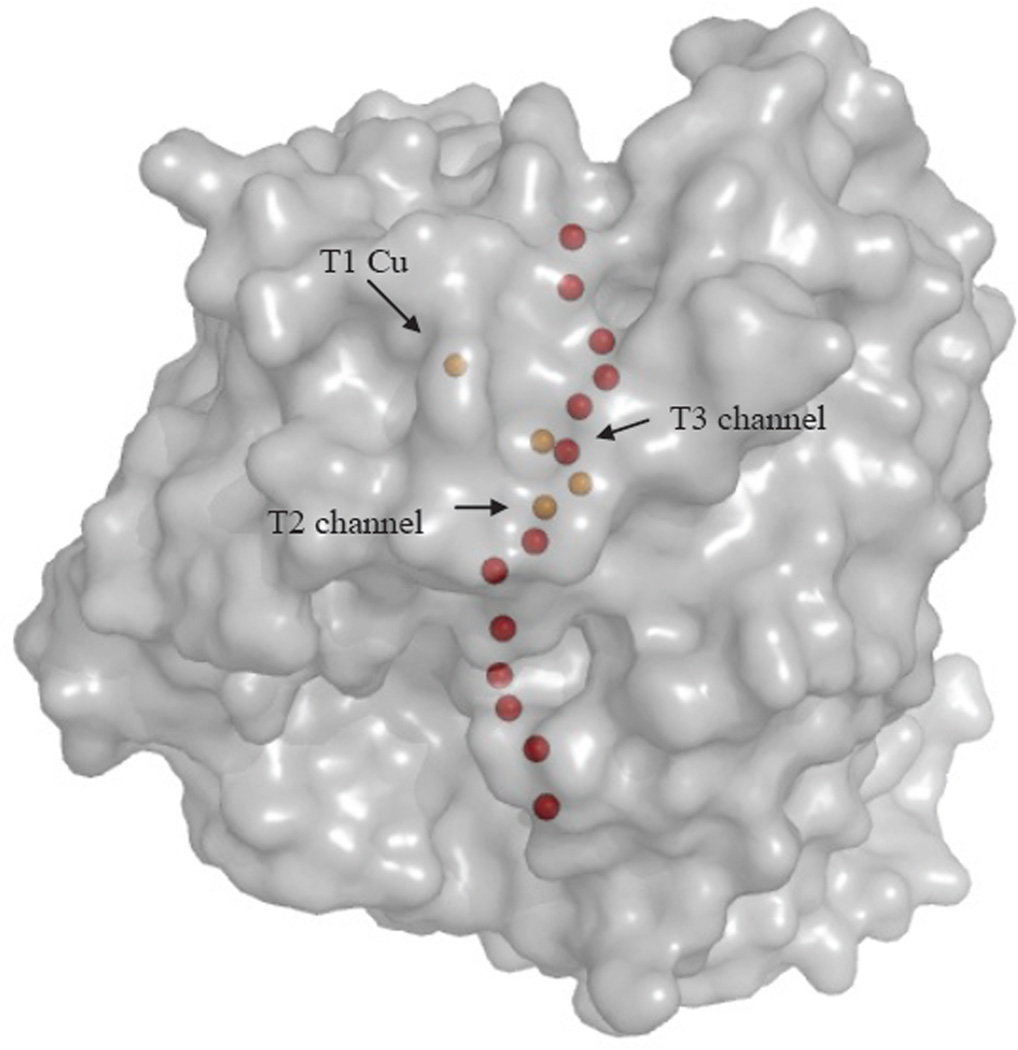
Water/O2 channels connecting the surface to the T2 and T3 Cu sites in T. versicolor laccase (1GYC). Cu atoms depicted in gold, oxygen atoms representing water molecules in red.
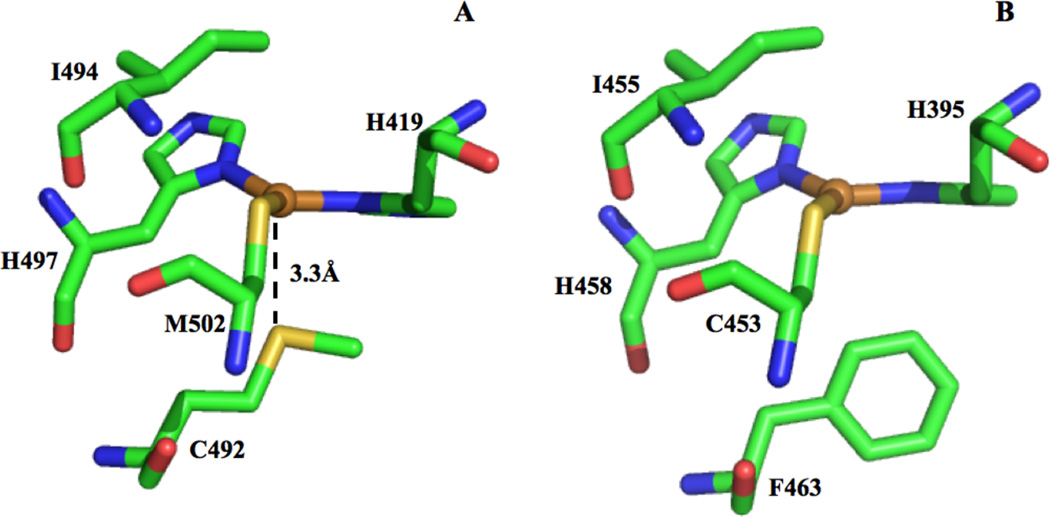
Type 1 Cu sites with Met (S to Cu 3.3A) (A) and Phe (B) in the axial coordination position of CotA (2X88) and T. versicolor laccase (1GYC), respectively
Coordination environments of the Type 1 Cu and substrate binding sites for (A) M. albomyces laccase (3FU7) and ceruloplasmin (2J5W), respectively

Structural representation of the trinuclear cluster in the multicopper oxidases, depicting eight 1st sphere His in the HXH conformation. Also shown are the conserved carboxylate residues D77 and D456 (numbering according to T. versicolor laccase (PDB: 1GYC))

Comparison of the TNC in reduced (red) and oxidized (blue) ascorbate oxidase
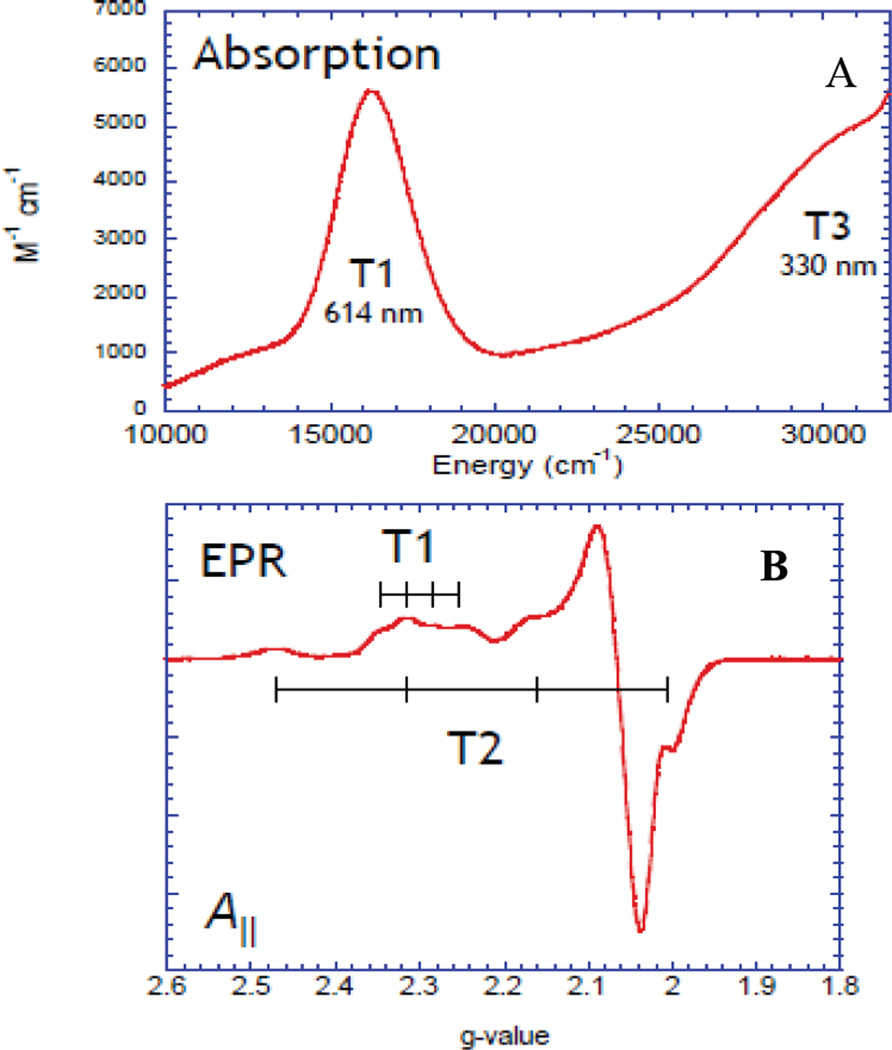
Spectroscopic features of the resting oxidized enzyme in RvL: (A) Electronic absorption and (B) EPR.
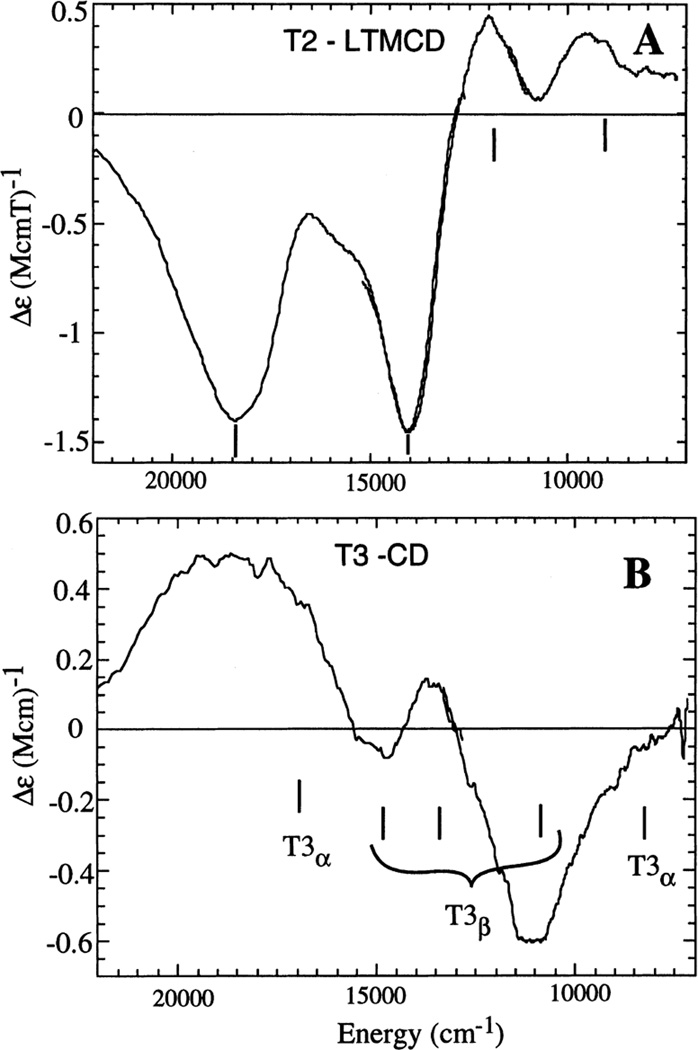
Spectroscopic features of the trinuclear Cu site in Lc: (A) LT MCD and (B) RT CD of oxidized T1Hg Lc. (Reprinted with permission from Ref. . Copyright 2001 John Wiley and Sons Inc.)
Electronic structure of the resting trinuclear cluster. (From Ref. – Reproduced by permission of The Royal Society of Chemistry.)
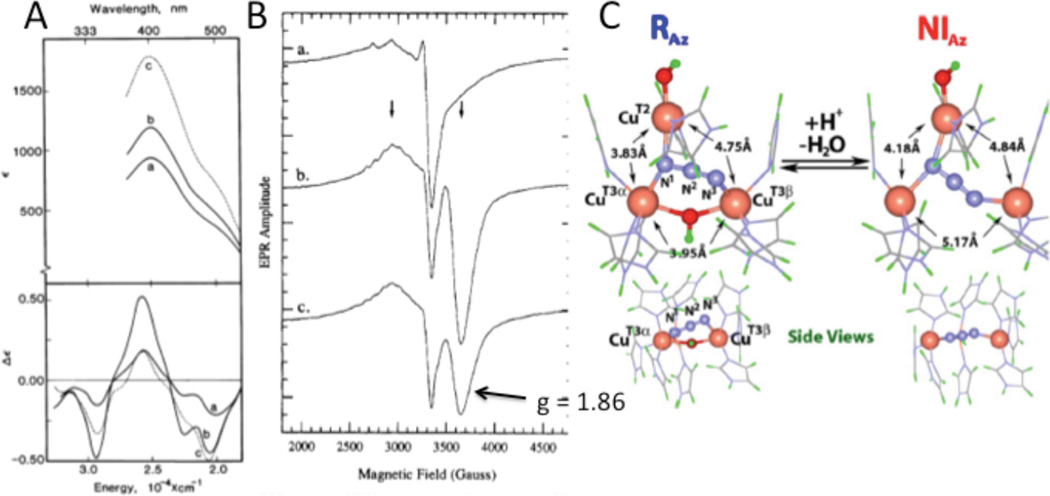
(A) RT Abs (top) and LT MCD (bottom) spectra of azide titration at 2.5, 9.0 and 38 protein equivalents (a,b, and c) of native RvLc. (Reprinted with permission from Ref. .) (B) LT EPR spectra corresponding to the RT Abs and LT MCD samples. (Reprinted with permission from Ref. . Copyright 1990 American Chemical Society.) (C) Optimized structures of Niaz and Raz. (Reprinted with permission from Ref. , copyright 2007 National Academy of Sciences, USA.)
Fluoride binding to T1Hg Lc, showing the splitting of the parallel hyperfine structure into doublets. Data-solid line, simulation-dotted line. Y-axis in units of Magnetic Field (Gauss). (Reprinted with permission from Ref. . Copyright 2005 American Chemical Society.)
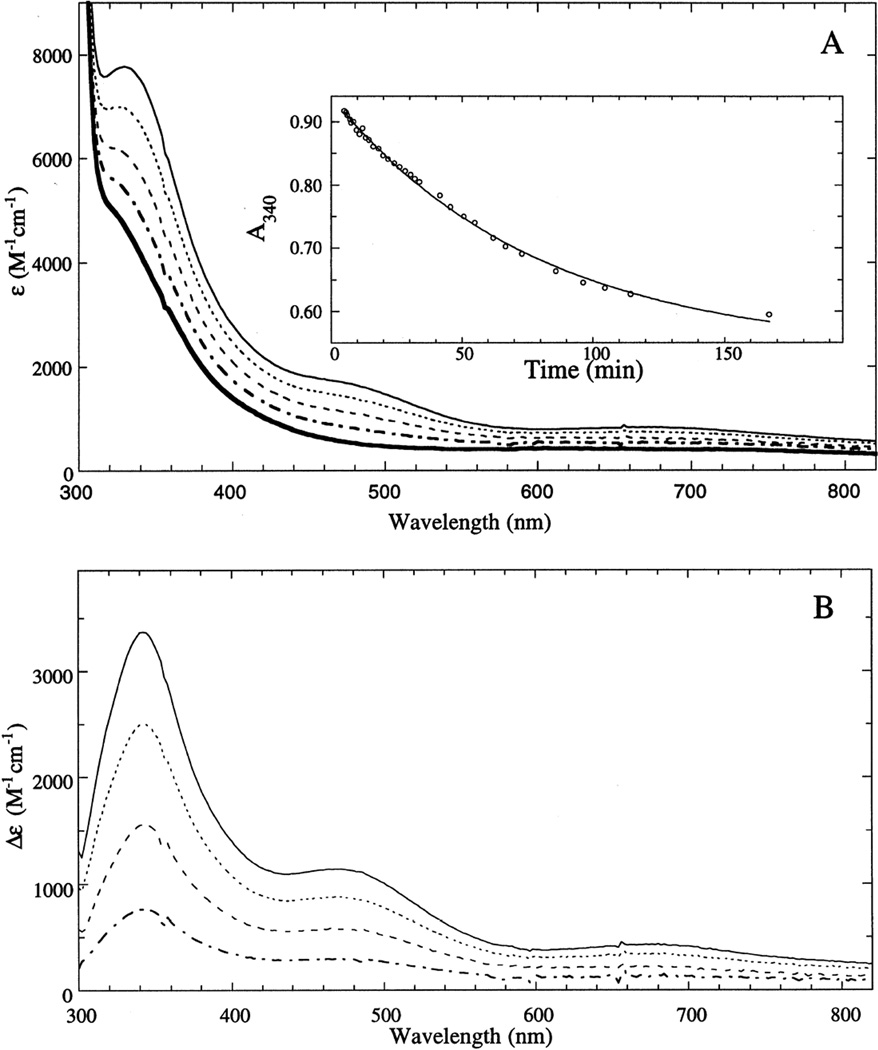
Decay of PI in T1Hg Lc. (A) decay of the RT absorption and (B) difference spectra of PI with the spectrum of reduced T1Hg subtracted. (Reprinted with permission from Ref. . Copyright 1996 American Chemical Society.)
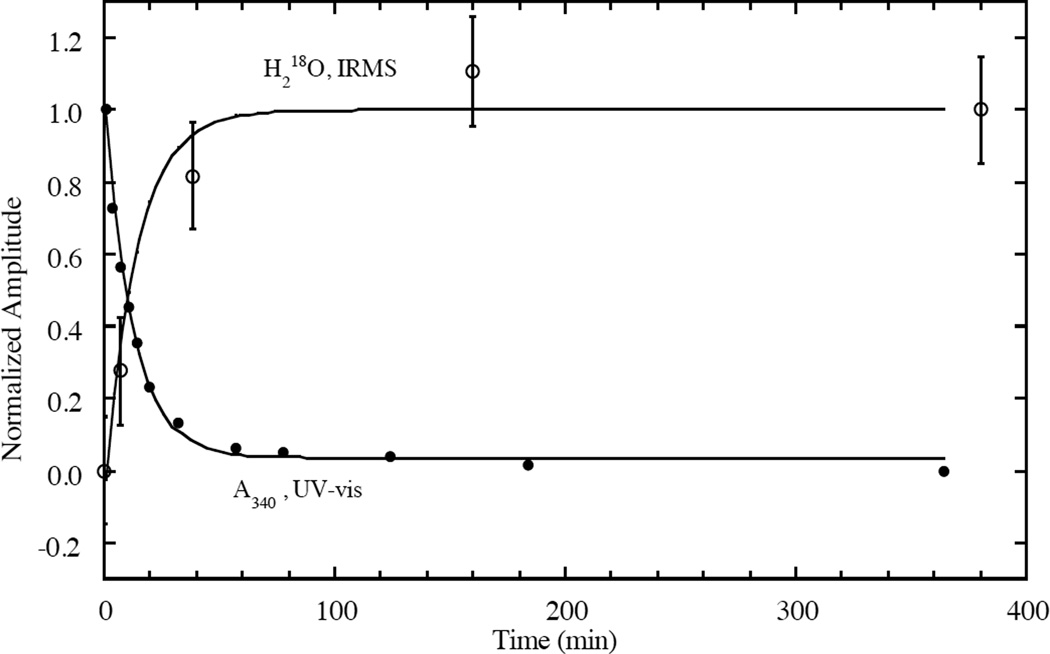
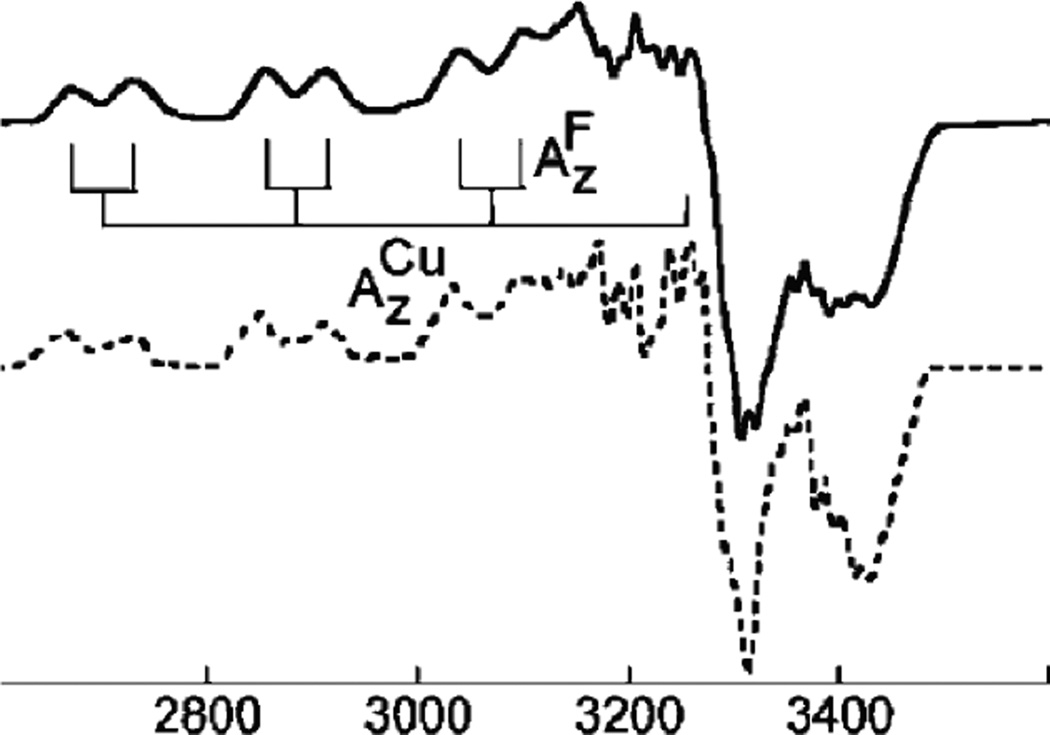
IRMS and absorption of the decay of PI monitored under the same conditions. (Reprinted with permission from Ref. . Copyright 1996 American Chemical Society.)
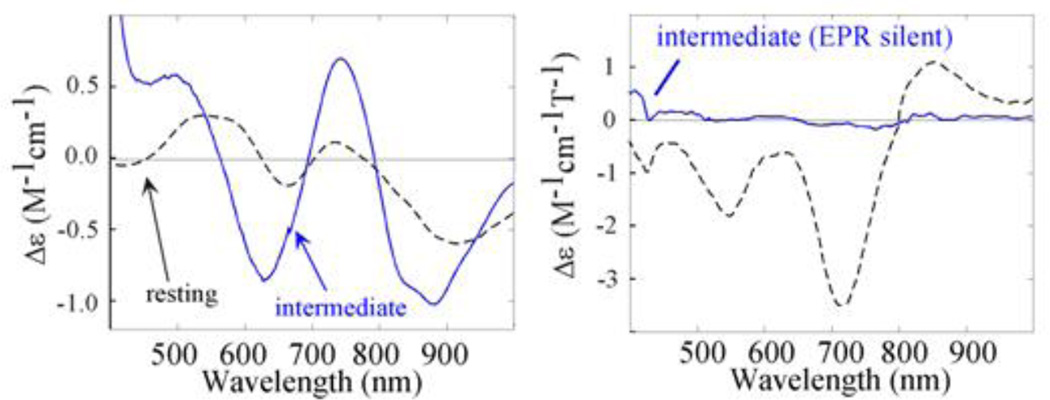
Comparison of (left) RT CD and (right) LT MCD of the oxidized resting state of T1Hg laccase (dashed) and PI (blue). (Reprinted with permission from Ref. . Copyright 2001 John Wiley and Sons Inc.)
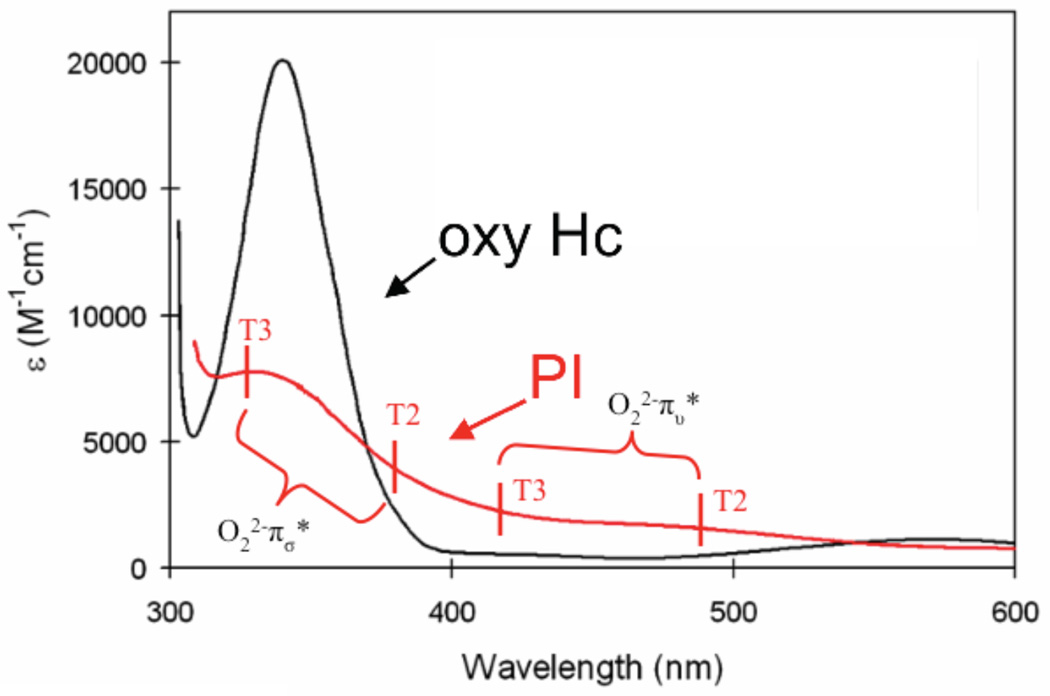
(A) Absorption spectra of the charge transfer region of oxy-Hc (black) and PI (red). (B) RT Abs of the CT region of PI, with assignment of CT transitions indicated. (Reprinted with permission from Ref. . Copyright 2007 American Chemical Society.)
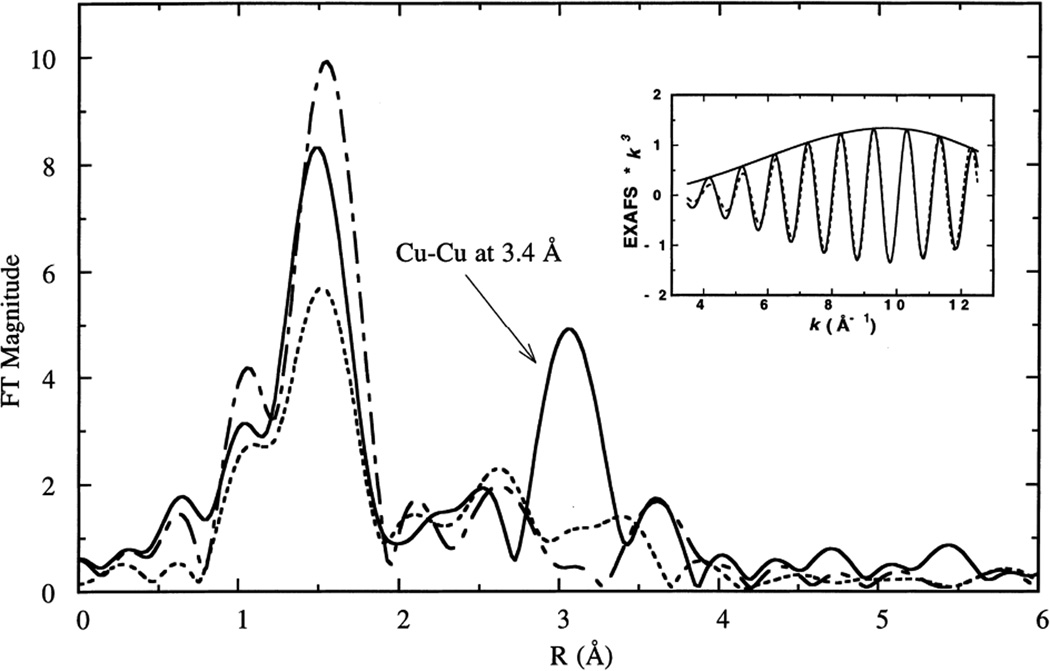
Fourier transforms of the EXAFS data for PI (−), reduced (- -), oxidized (-_-) forms of T1Hg Lc. (Reprinted with permission from Ref. . Copyright 1996 American Chemical Society.)

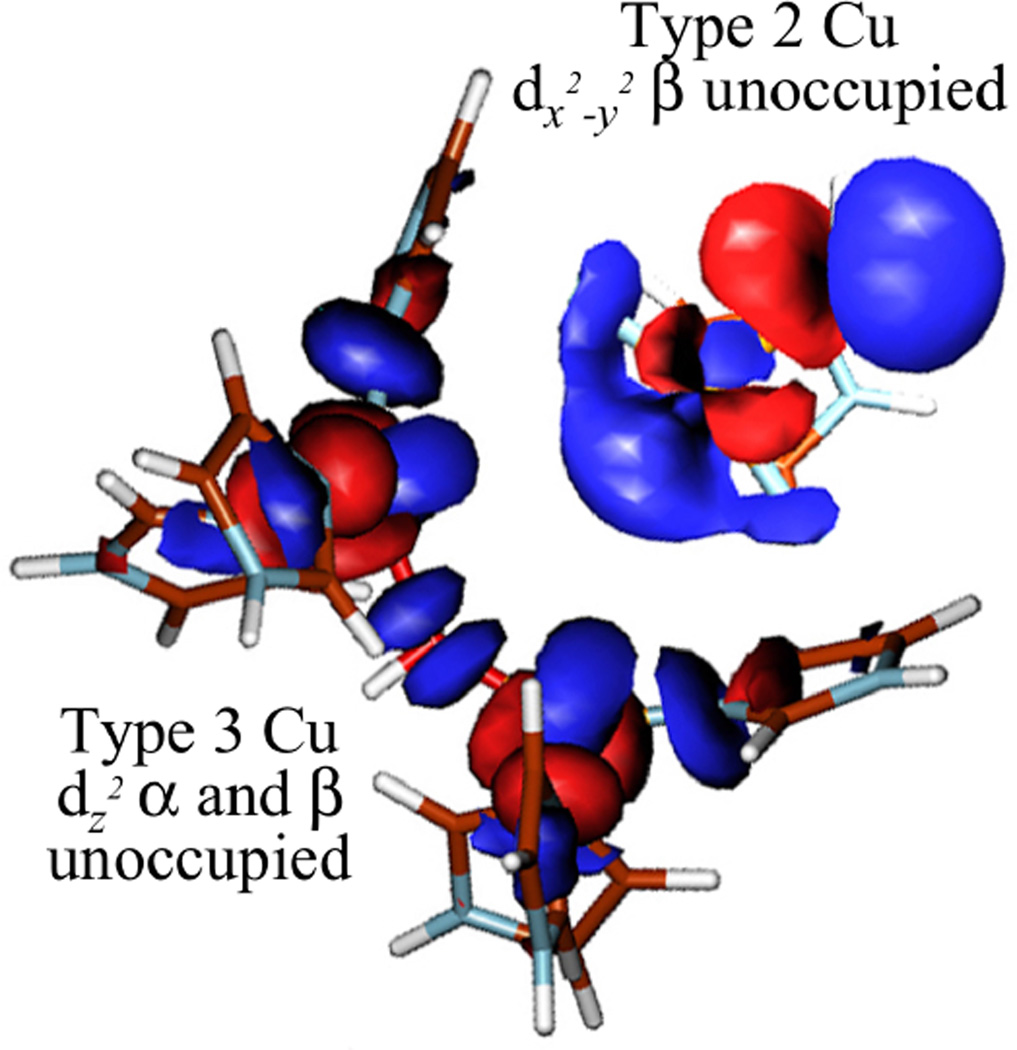
(A) Calculated geometric structures of PI without and with D94. The PI structure without D94 (left) has both T3 Cu’s oxidized and the T2 Cu reduced while in the structure with D94 (right), the T3β and T2 are oxidized and the T3A is reduced. (B) Contours of the α- (based on the T2 dx2-y2) and the β- (based on the T3 β dx2-y2) LUMOs of PI + D94. (Reprinted with permission from Ref. . Copyright 2007 American Chemical Society.)
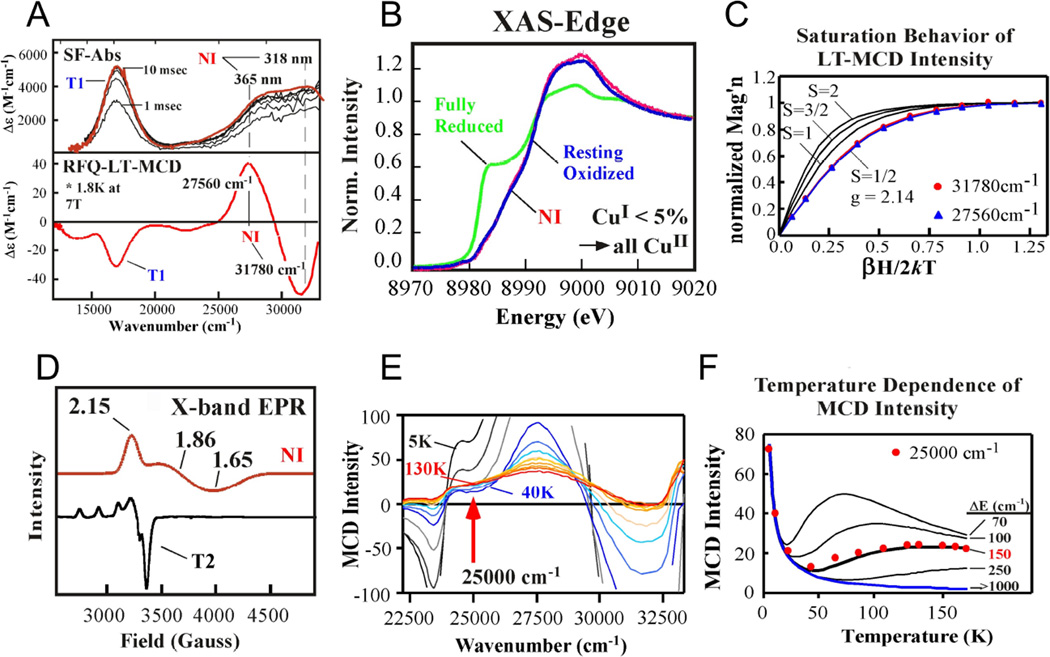
Stopped flow absorption spectra (top) and rapid freeze quench MCD spectra (A), Cu K-edge XAS spectra (B), variable temperature, variable field behavior of the MCD spectra with Brillouin function fits with different values (C), low temperature X-band EPR (D), temperature dependence of the MCD spectra (E) and plot of temperature dependence of MCD intensity at 25,000 cm−1 of NI. (From Ref.–Reproduced by permission of The Royal Society of Chemistry.)
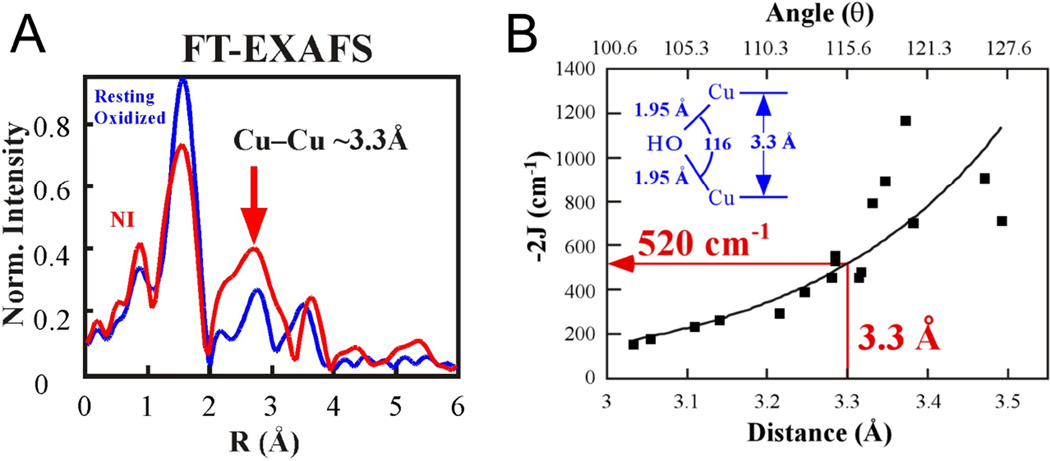
Fourier Transformed EXAFS spectra of NI (A) and magnetostructural correlation of the Cu-Cu distance (and angle) with exchange coupling constants (J) for OH bridged Cu(II) model complexes (B). (Reprinted with permission from Ref. . Copyright 2002 American Chemical Society.)
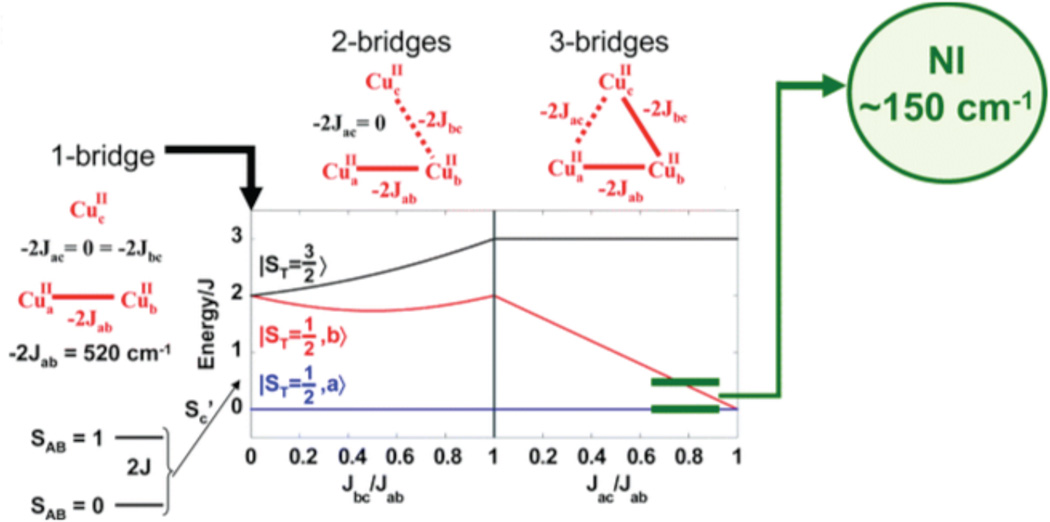
Energy levels of spin states in trinuclear Cu(II) species, with one, two, and three bridging interactions, respectively. (From Ref. – Reproduced by permission of The Royal Society of Chemistry.)

Modeled LT MCD spectra of the ground and first excited state of NI (A), Coupling coefficients of individual Cu’s in the ground and excited state wave functions (B), Estimated bridging interactions between the three Cu(II)’s (C). (Reprinted with permission from Ref. . Copyright 2002 American Chemical Society.)

Structures of the TrisOH (A) and μ3-oxo (B) model complexes. Mechanism for antisymmetric exchange in TrisOH. (Reprinted with permission from Ref. . Copyright 2005 American Chemical Society.)
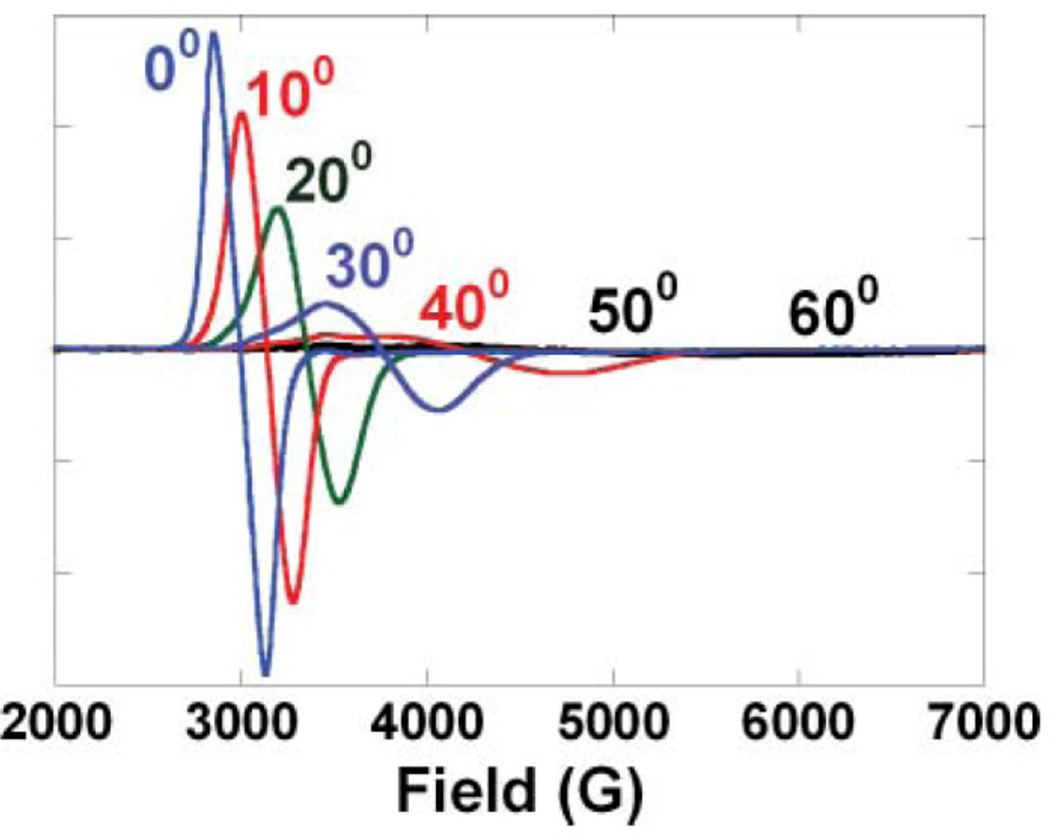
Single crystal LT EPR of TrisOH at angles from 0–60° spanning g-values from 2.3 to 1.2 of the molecular z-axis with respect to the direction of the applied field. (Reprinted with permission from Ref. . Copyright 2004 American Chemical Society.)
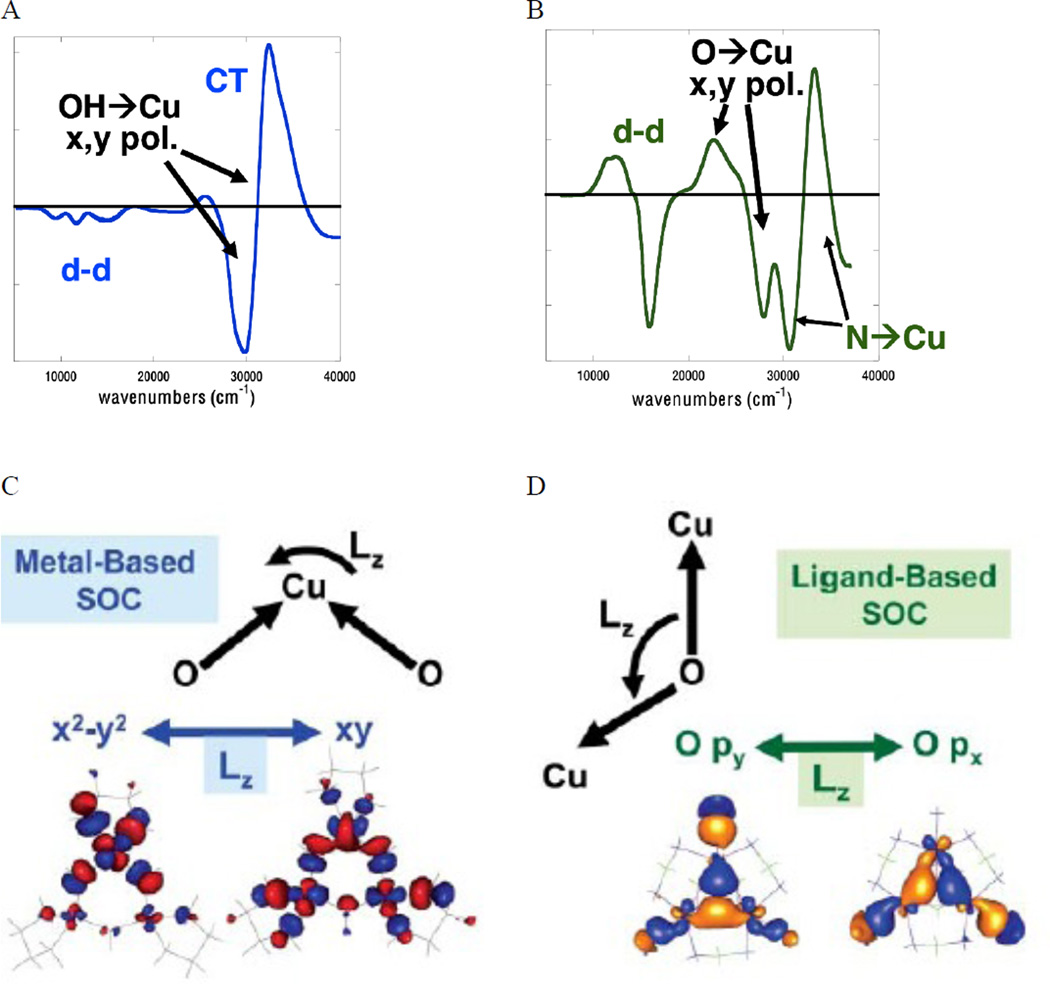
MCD spectra of the TrisOH model complex (A), and the μ3-oxo complex (B), Metal-based SOC as observed in TrisOH (C), Ligand-based SOC as observed in μ3-oxo (D). (From Ref. – Reproduced by permission of The Royal Society of Chemistry.)
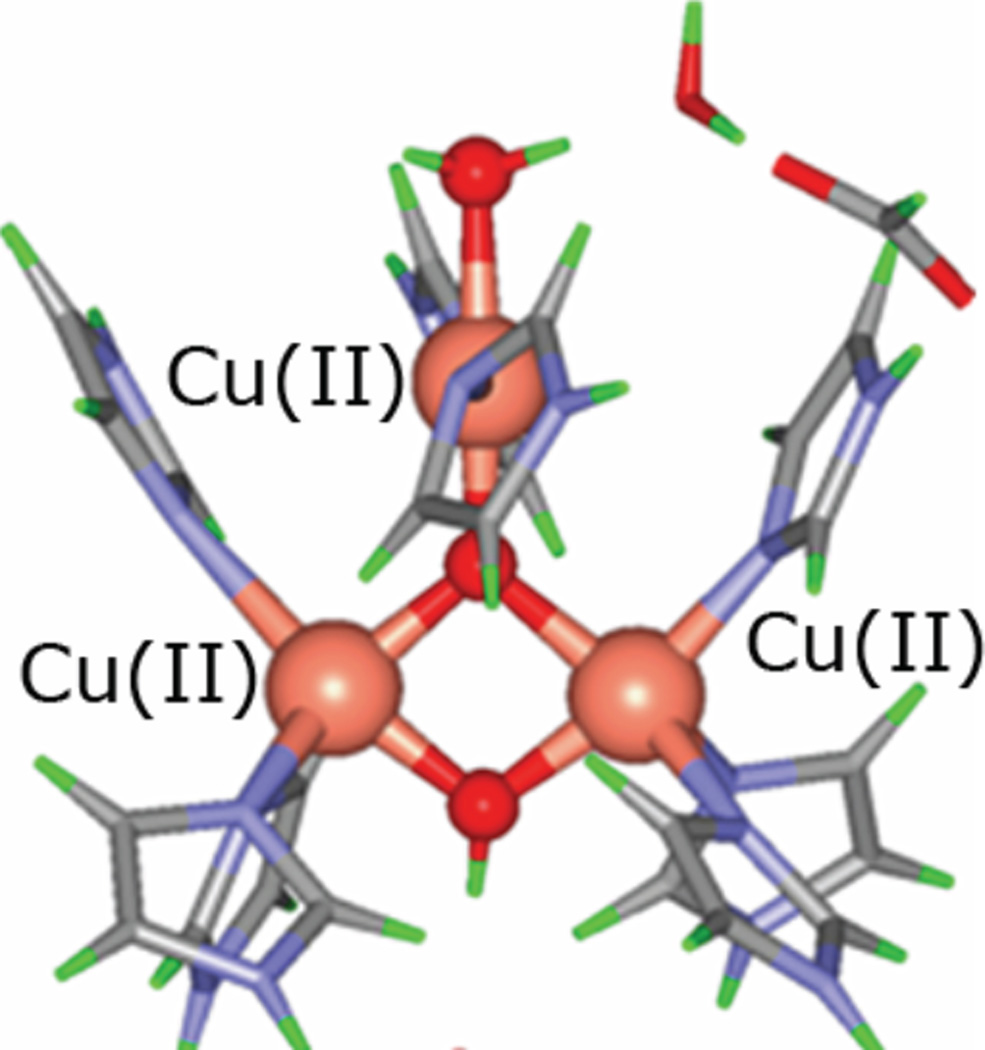
Spectroscopically derived calculated structure of NI where the μ3-oxo and μ2OH derive from the 4-electron reduction of dioxygen. (Reprinted with permission from Ref. . Copyright 2007 American Chemical Society.)
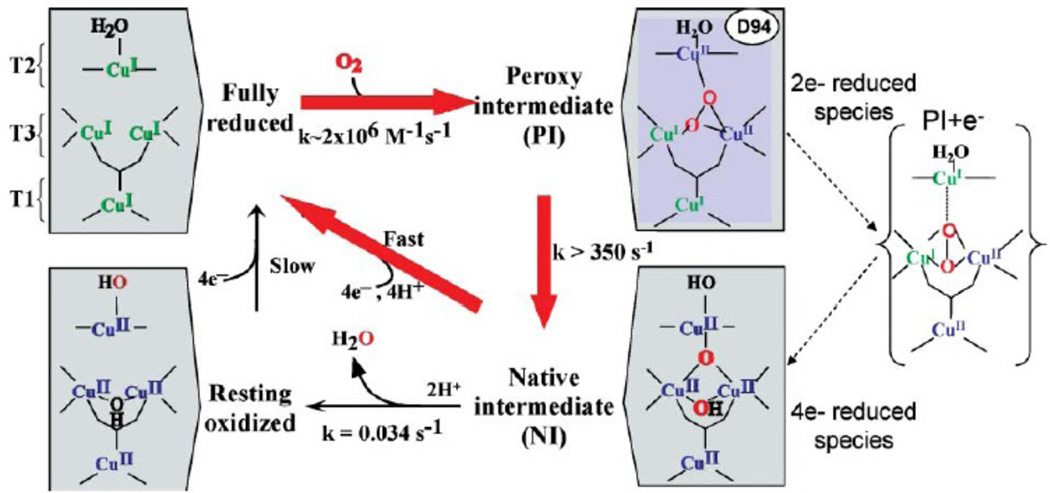
Mechanism of O2 reduction to water by the multicopper oxidases. The catalytic cycle comprise steps connected by the red arrows, with an additional facile intramolecular ET from T1 to T2 Cu in-between step 1 and 2. Due to slow conversion, NI to resting oxidized enzyme is not part of the catalytic cycle. (From Ref. – Reproduced by permission of The Royal Society of Chemistry.)
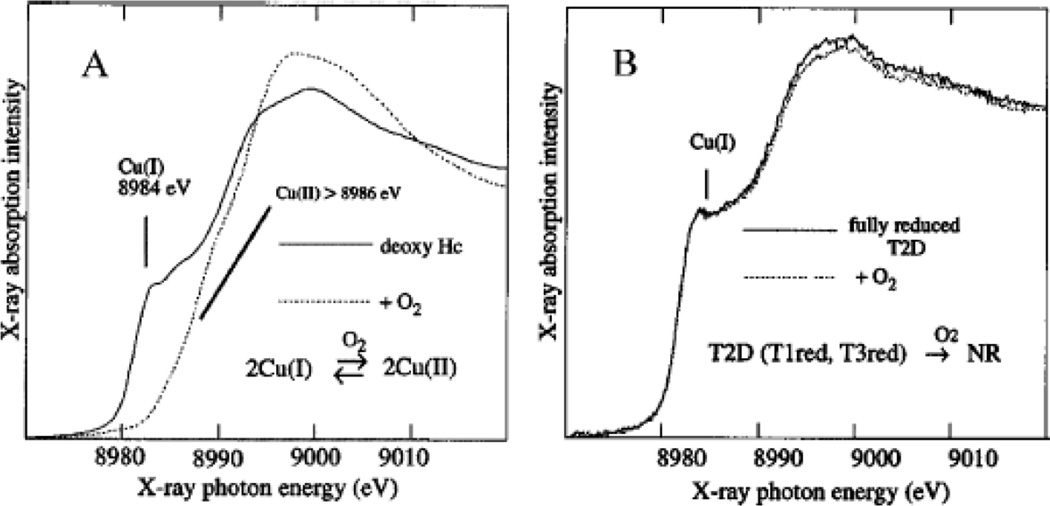
A. Cu K-edge XAS of deoxy Hc before and immediately after exposure to O2. B. Similar as A, but with deoxy laccase. (From Ref. – Reproduced by permission of The Royal Society of Chemistry.)
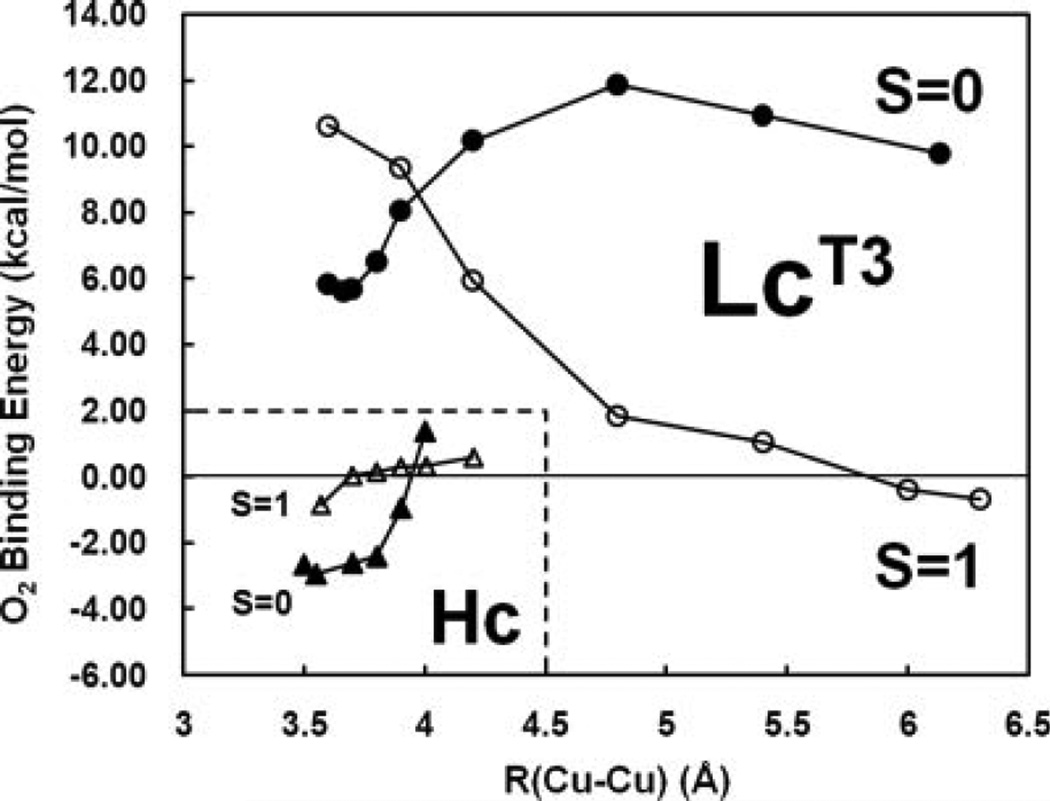
Reaction coordinates for O2 binding in laccase. S=0 (obtained from broken symmetry calculations) and S=1 energies are shown in filled and open symbols, respectively. Inset: similar results for deoxy hemocyanin. (Reprinted with permission from Ref. .)
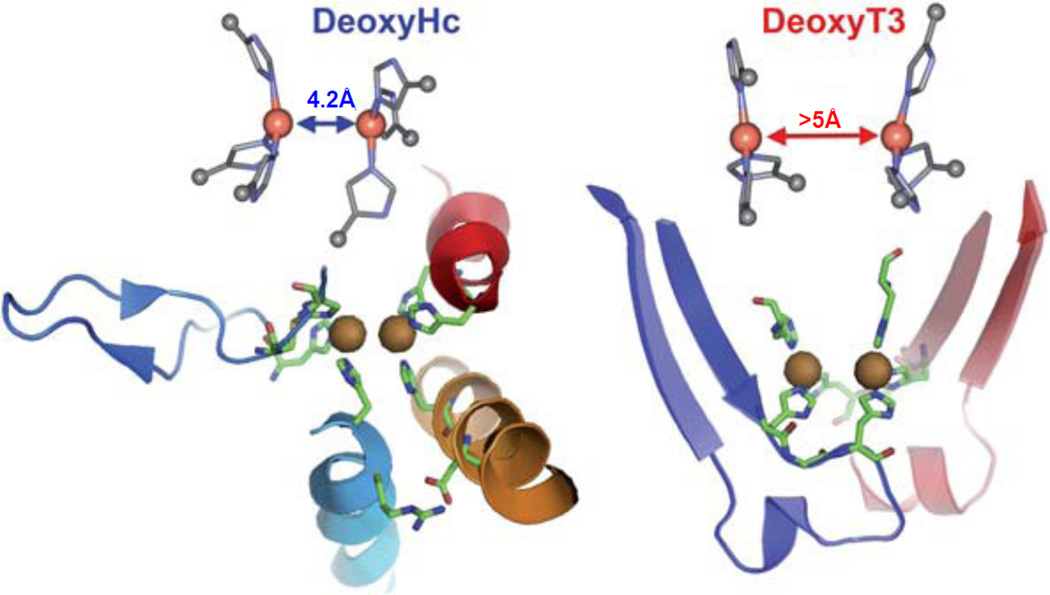
Structures of deoxy hemocyanin and deoxy laccase emphasizing the backbone induced constraints on the T3 Cu coordinating His residues. (Reprinted with permission from Ref. .)
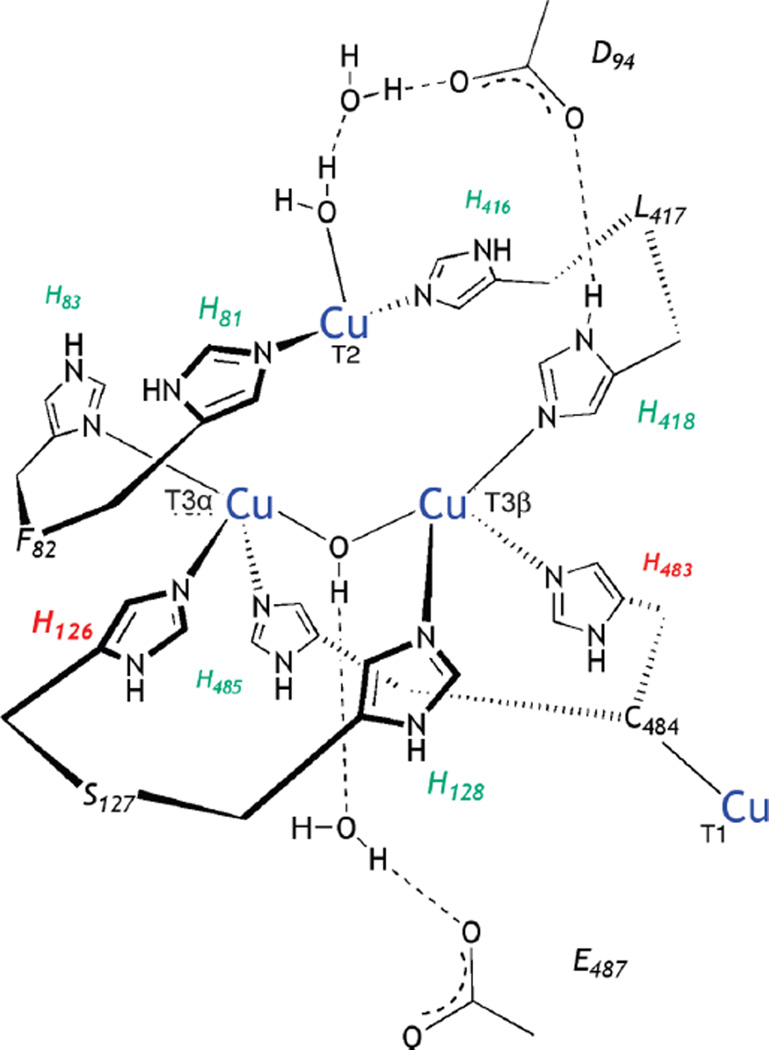
Active site structure with residue numbering according to the Fet3p sequence. (Reprinted with permission from Ref. . Copyright 2010 American Chemical Society.)
Absorption spectra of reduced T1D WT (red) T1DH126Q (blue), and T1DH483Q (green), immediately after exposure to O2. (Reprinted with permission from Ref. . Copyright 2010 American Chemical Society.)
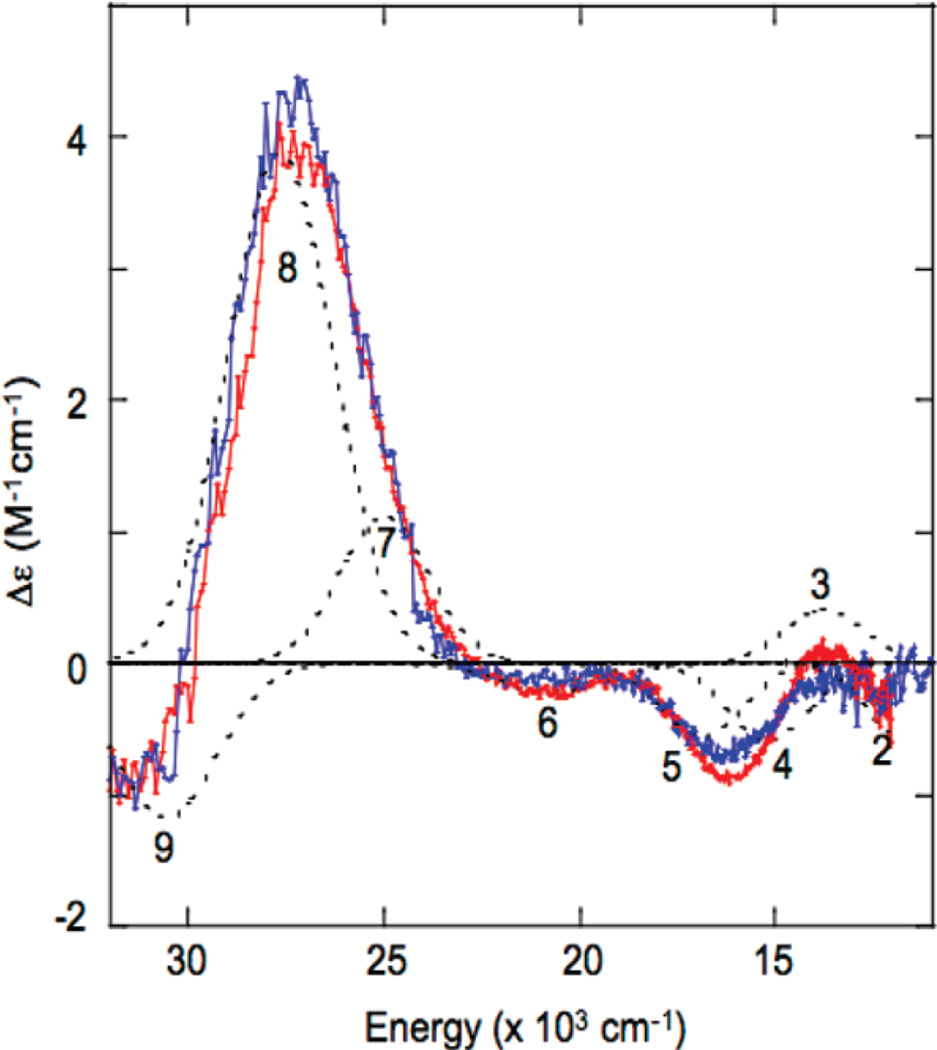
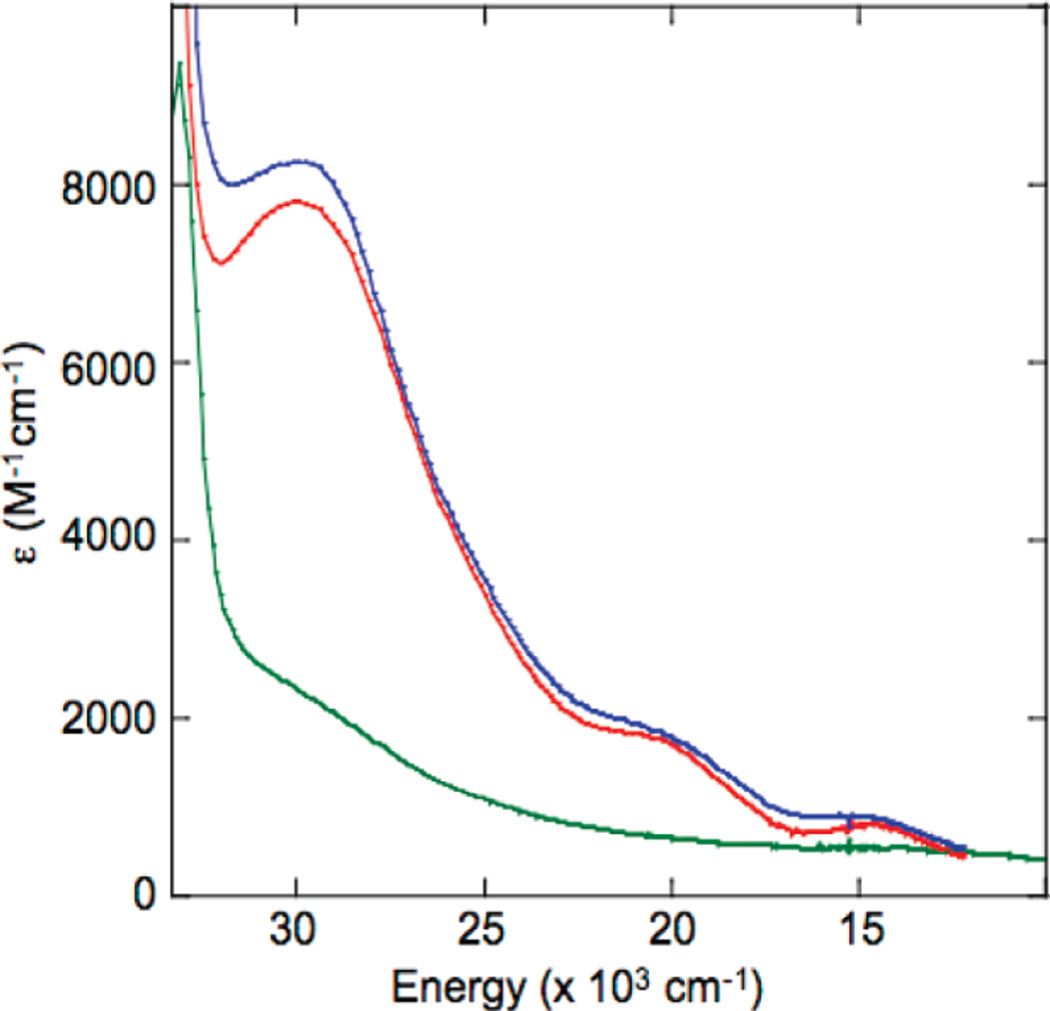
CD spectra of PI in T1D WT (red), T1DH126Q (blue) and band assignments (dotted). (Reprinted with permission from Ref. . Copyright 2010 American Chemical Society.)
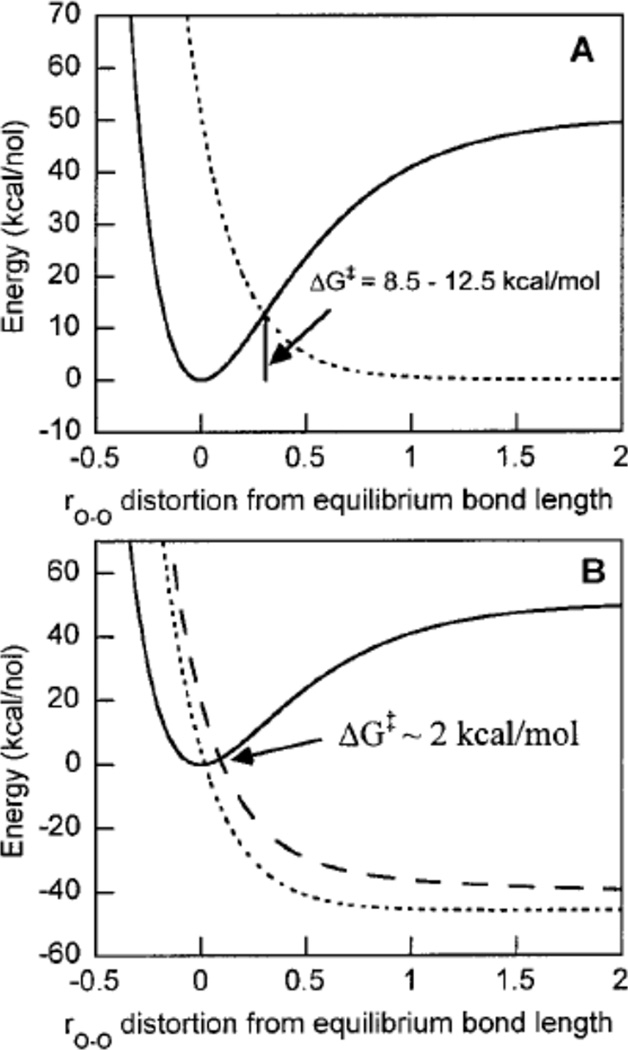
Morse Potential energy surfaces of reductive cleavage of peroxide in (A) 1e− and (B) 2e− processes. (Reprinted with permission from Ref. . Copyright 2001 American Chemical Society.)

PI decay rates as a function of pH of T1D WT (red), T1DD94E (blue), T1DE487D (green), and T1DE487A (black). (Reprinted with permission from Ref. . Copyright 2007 American Chemical Society.)
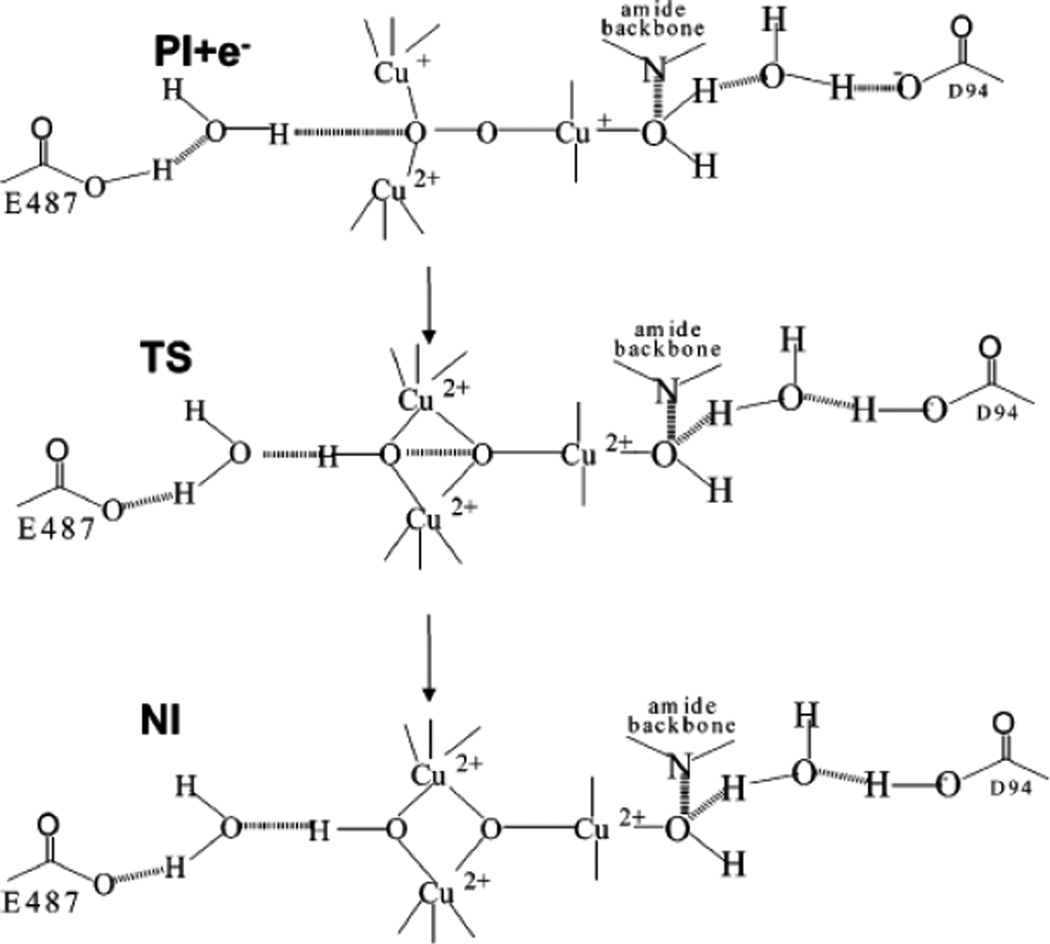
Model for proton assisted reductive cleavage of the O-O bond in PI. (Reprinted with permission from Ref. . Copyright 2007 American Chemical Society.)
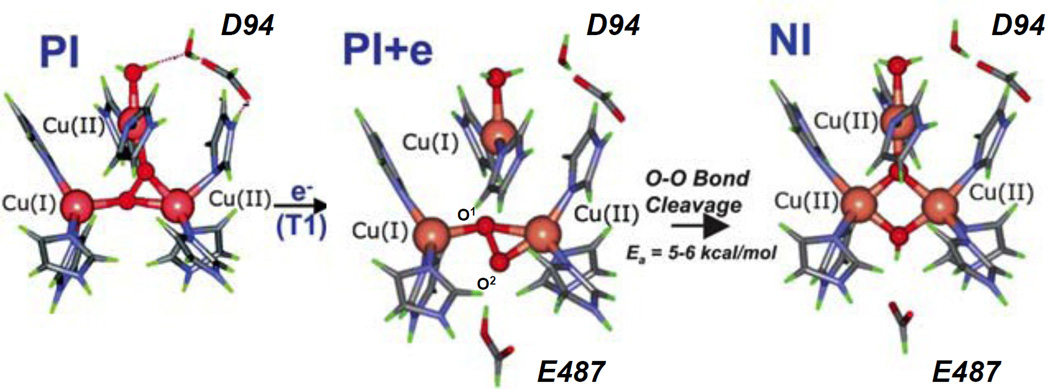
Schematic of calculated structures in reduction of PI to NI. (Reprinted with permission from Ref. . Copyright 2007 American Chemical Society.)
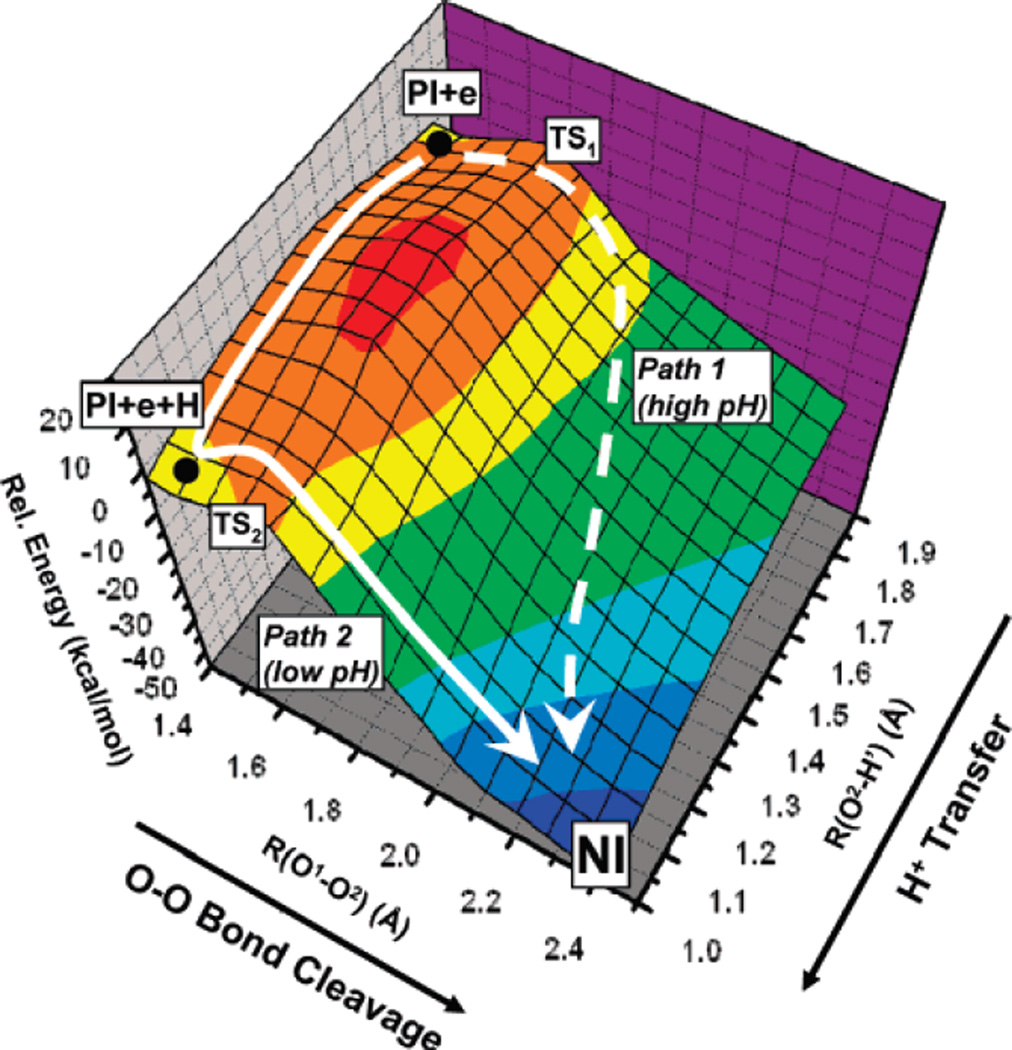
2 Dimentional energy surface plots of proton assisted- and unassisted pathways, as well as intermediate pathways with concurrent elongation of the O-O bond and formation of the μ2-O-H bond. Proton unassisted pathway goes through TS1 and proton assisted pathway through TS2. (Reprinted with permission from Ref. . Copyright 2007 American Chemical Society.)
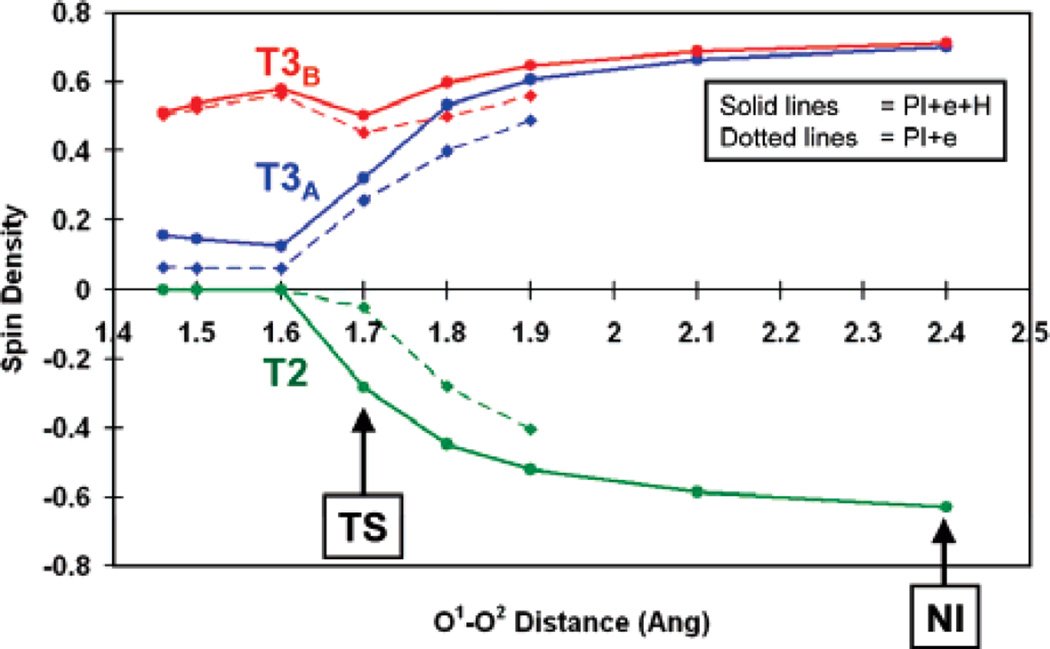
Calculated spin densities of the three trinuclear cluster Cu’s in the conversion of PI to NI with elongation of the O-O bond. (Reprinted with permission from Ref. . Copyright 2007 American Chemical Society.)
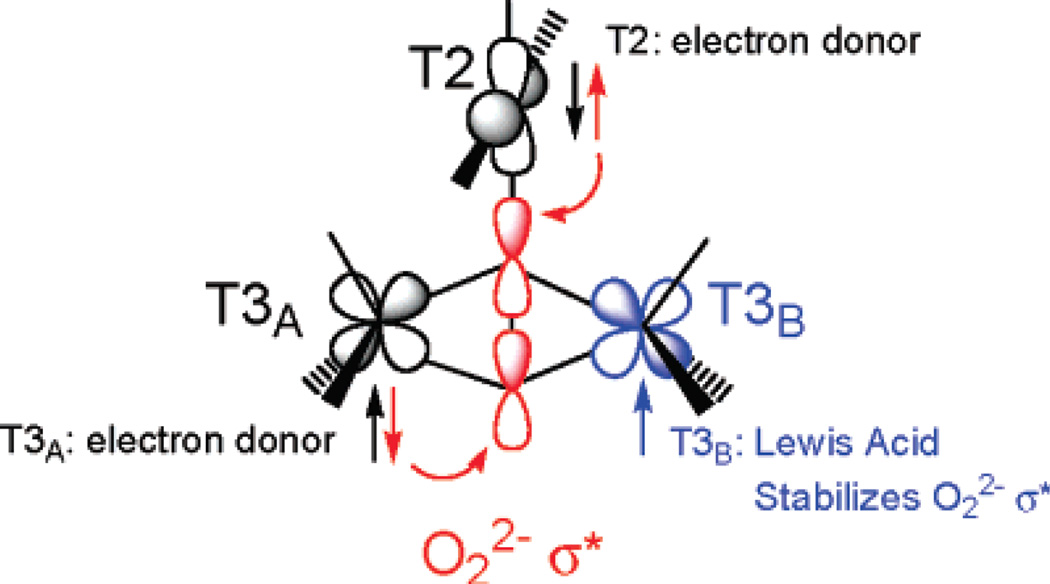
Schematic of the FMOs involved in O-O bond cleavage by the TNC. HOMO’s on T2/T3α overlap with LUMO’s on O22−. The half occupied dx2-y2 helps stabilizing the energy of the LUMO’s. (Reprinted with permission from Ref. . Copyright 2007 American Chemical Society.)
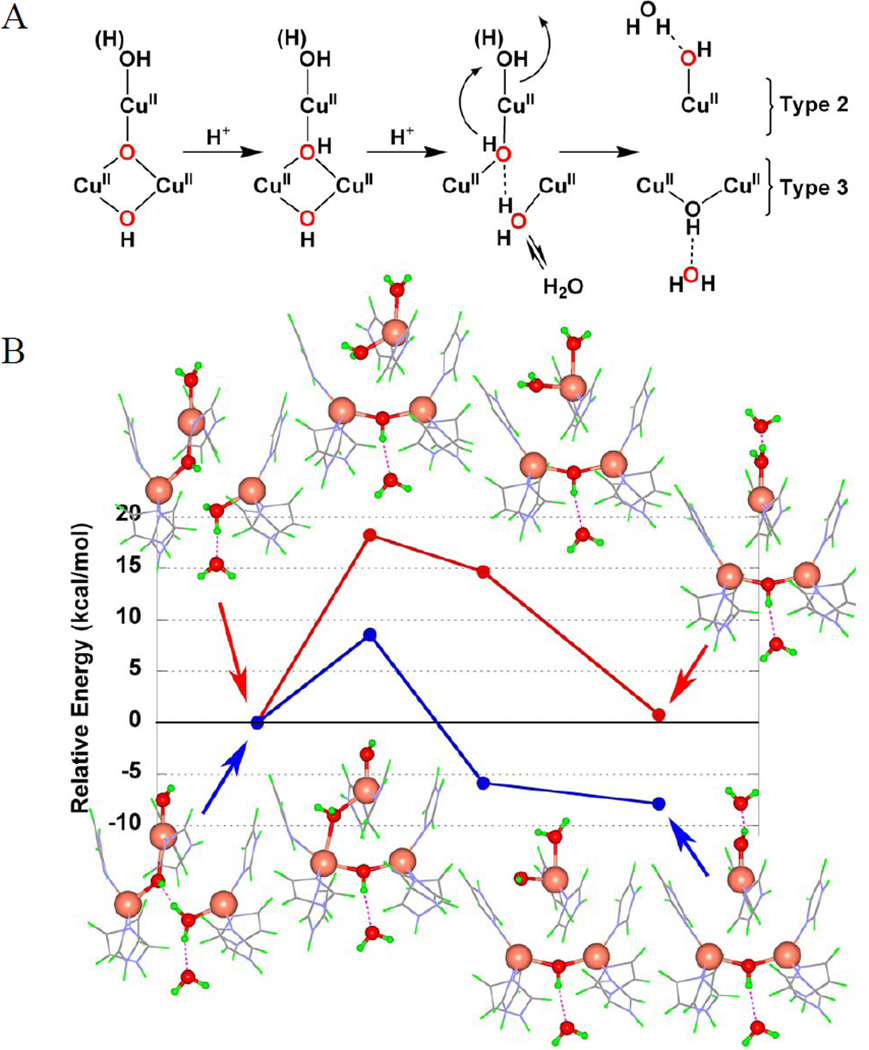
(A) Model for decay of NI to resting oxidized enzyme, including two H+ transfer steps and release of one water molecule. (B) Calculated relative energies of the last step in (A) for NIH2O (red) and NIOH (blue). (Reprinted with permission from Ref. , copyright 2007 National Academy of Sciences, USA.)
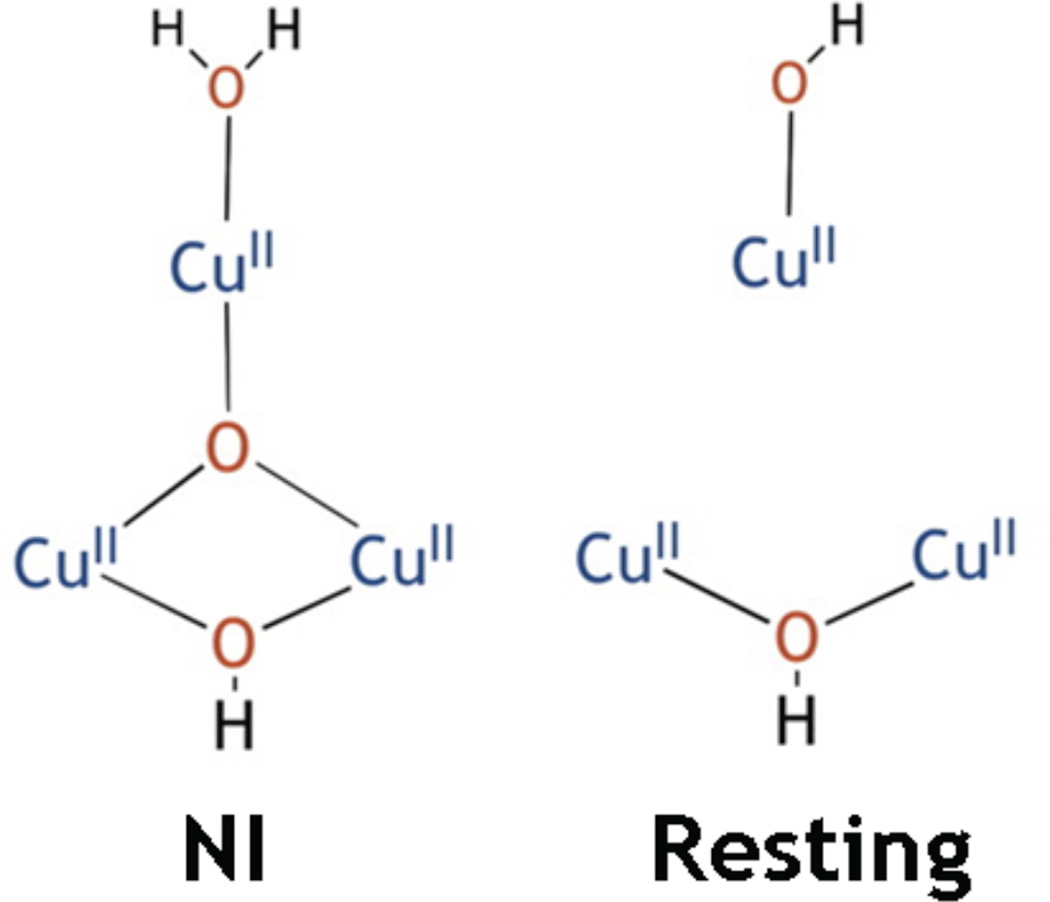
Experimentally determined structures of the trinuclear clustes in the Native Intermediate (left) and the resting state (right). (Reprinted with permission from Ref. copyright 2013 American Chemical Society)
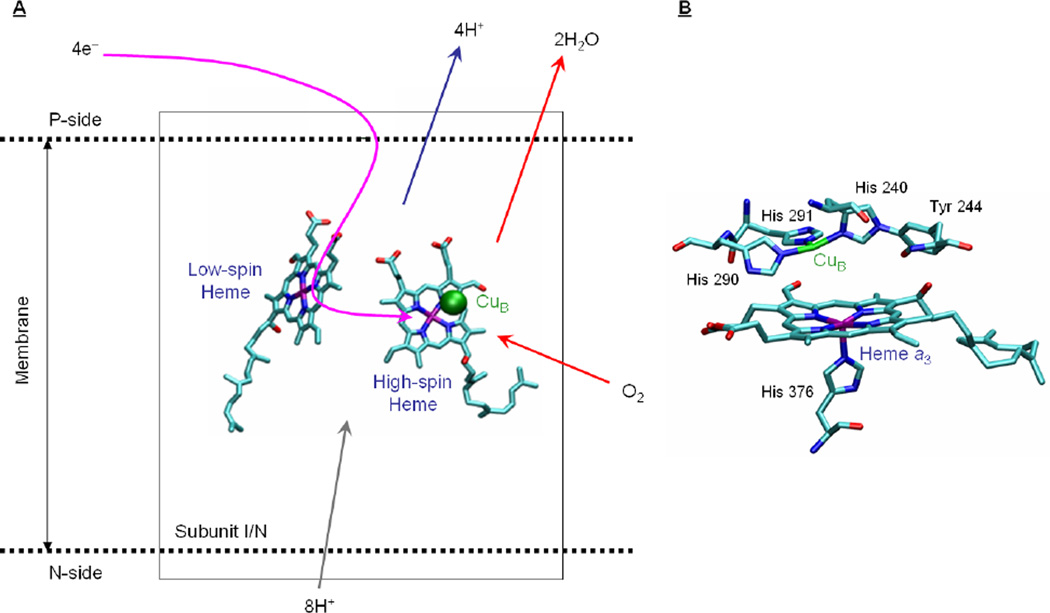
Schematic representation of subunit I/N showing the conserved redox centers common to all Heme-copper oxidases. A) Electrons are transferred to the binuclear heme-CuB site via the low-spin heme site (pink arrow). Proton transfer from the N-side of the membrane (grey arrow) leads to the heme a3/CuB binuclear site to produce H2O from reduced O2 (red arrows), and for pumping protons across the membrane (blue arrow). B) Dioxygen binding site in HCO (structure of the fully reduced bovine CcO Protein Data Bank number 1v55).
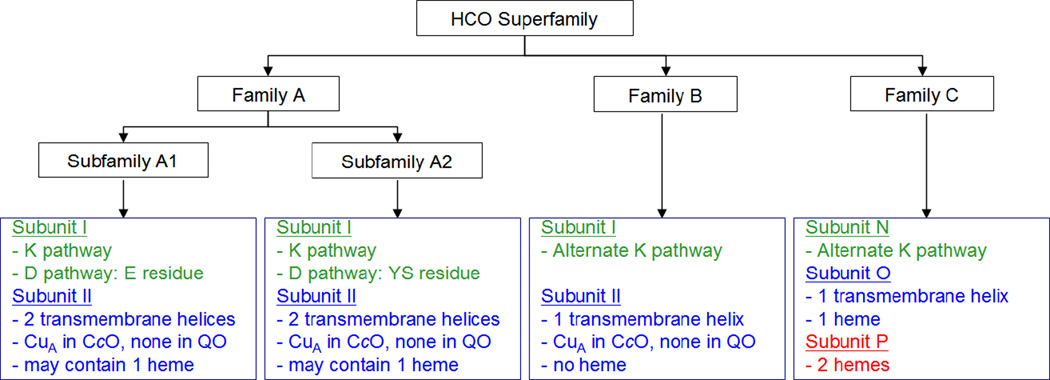
The minimal functional unit of Heme-copper Oxidases from the three families: types A, B and C.
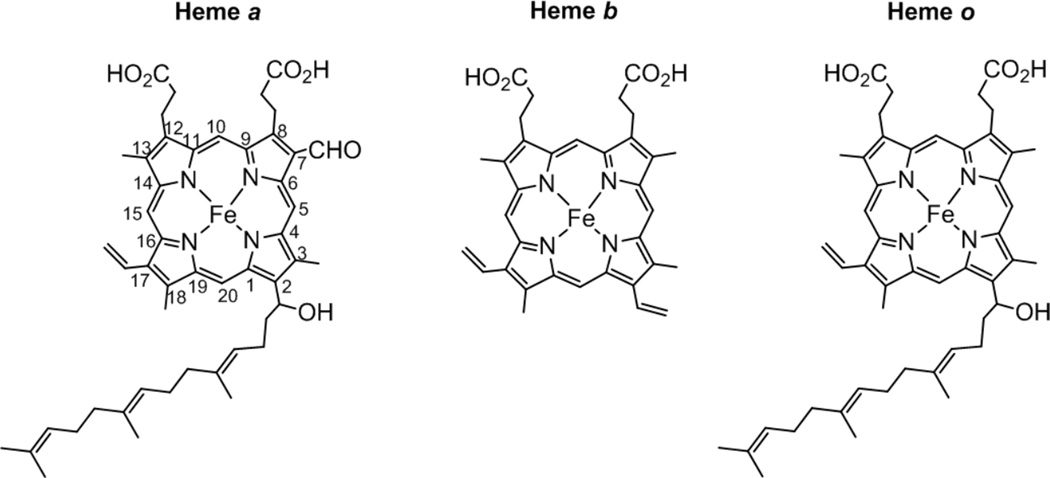
Structures of heme A, heme B and heme O. The numbering of the porphyrin carbons are demonstrated in heme A.
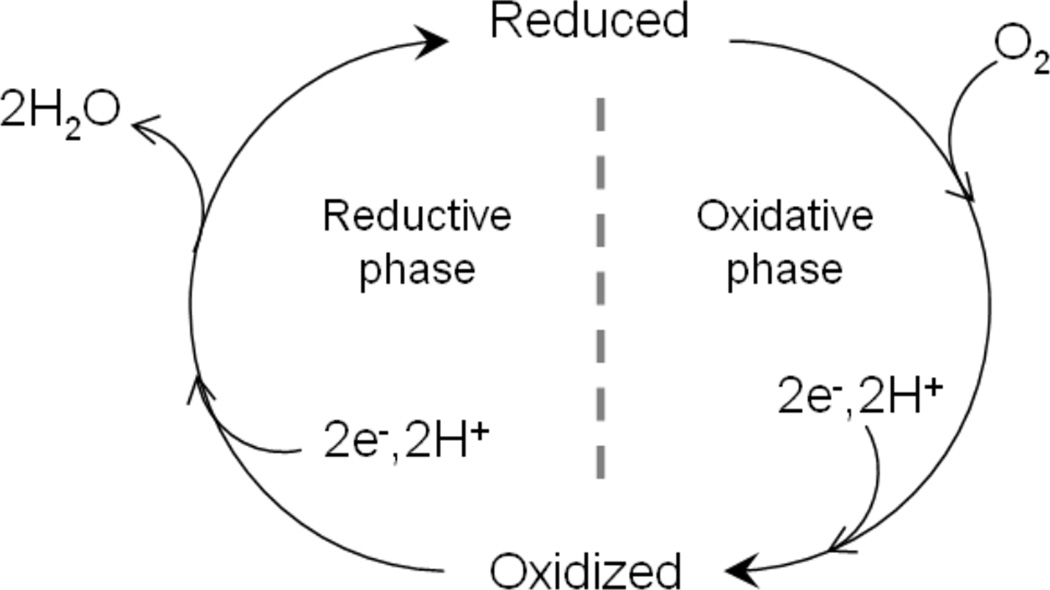
Catalytic cycle of Heme-copper Oxidases. Species entering and leaving the binuclear site (heme a3/CuB) are shown. Proton translocation/pumping is not shown here.
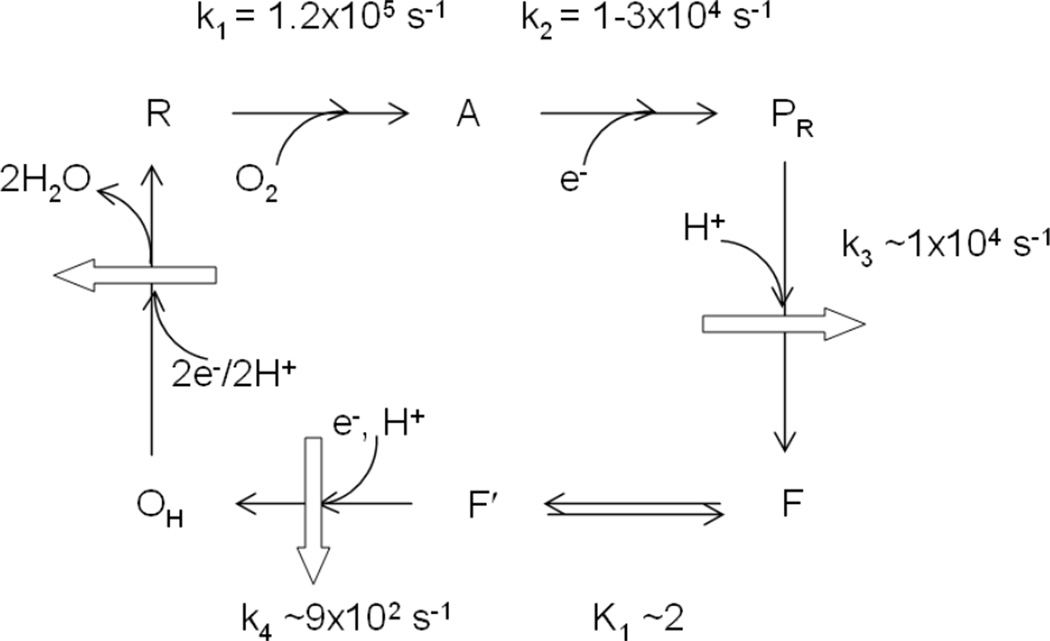
Proposed mechanism for the reaction of fully reduced CcO with O2. Curved arrows represent species entering or leaving the binuclear site. Two additional electrons are needed to generate the fully reduced site, R, from OH, not shown here. Block arrows represent proton pumping. The references for the kinetic constants are given in the text.
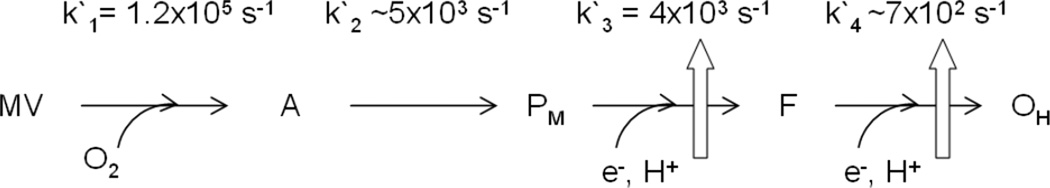
Proposed mechanism for the reaction of mixed valence CcO with O2. PM to F and OH are observed after injection of external electrons into CcO. Block arrows represent proton pumping. The references for the kinetic constants are given in the text.
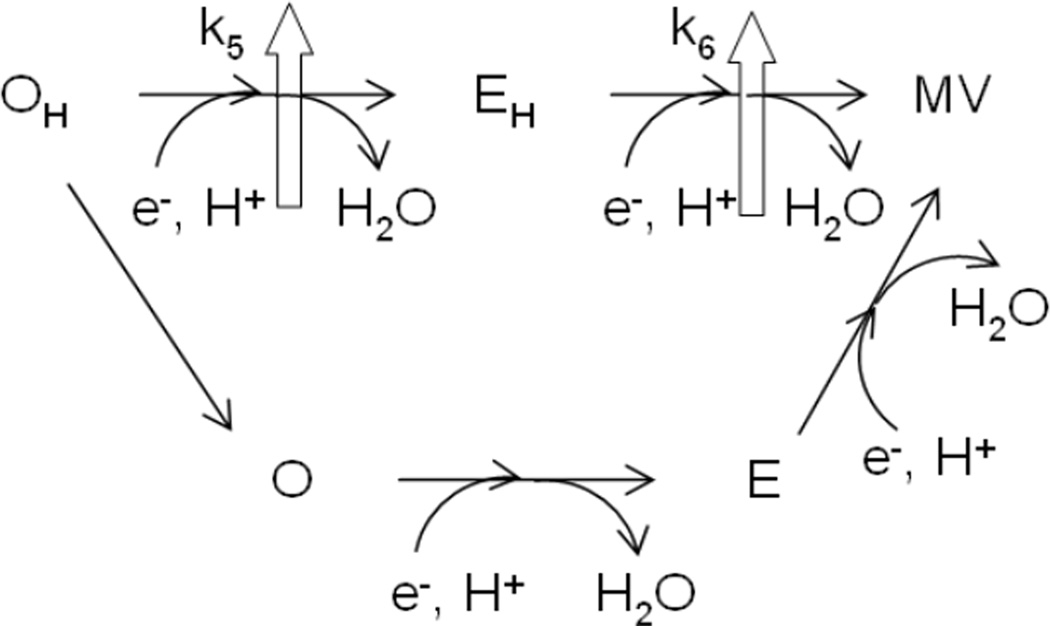
Proposed reaction scheme showing the two possible pathways for the reduction of the oxidized pulsed form of the binuclear center in CcO. Block arrows represent proton pumping that is absent when OH decays to O and gets reduced.
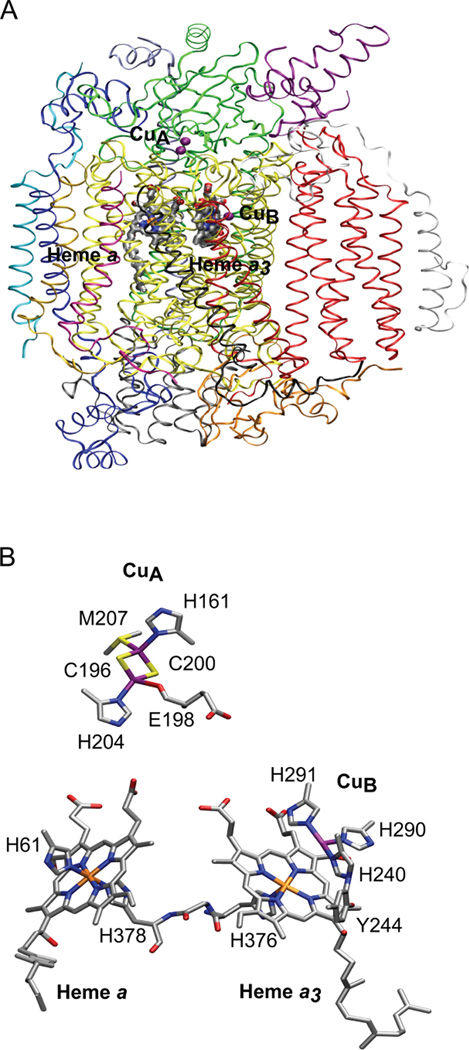
Cytochrome c oxidase structure from bovine heart. (A) Overall structure where the 13 subunits are shown in different colors [subunit I (yellow), subunit II (green), subunit III (red), subunit IV (dark blue)]. (B) Expanded view of the redox active metal centers. CuA···Fea = 20.6 Å; CuA···Fea3 = 23.2 Å; Fea···Fea3 = 13.4 Å; CuB···Fea3 = 5.2 Å. Figure generated from PDB ID 2Y69 coordinates using VMD.
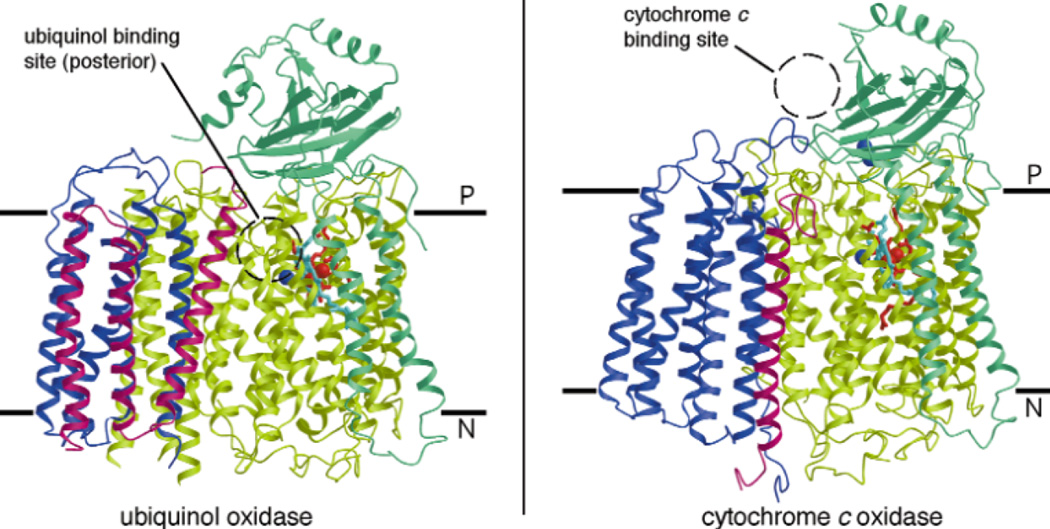
Structure of (left) ubiquinol oxidase from E. coli and (right) cytochrome c oxidase from P. denitrificans parallel to the membrane. Subunits I,II, III and IV are shown in yellow/green, green, blue and pink, respectively. Hemes b and o3 in subunit I are red and light blue, respectively. The blue spheres in subunits I and II are the CuB and CuA (two Cu atoms) centers, respectively. The dotted circle represents the location of the electron donating substrates—ubiquinol at the posterior of ubiquinol oxidase within the membrane and cytochrome c on the P-side of CcO. (Reprinted with permission from Macmillan Publishers Ltd: Nature Structural Biology Ref. , copyright 2000)
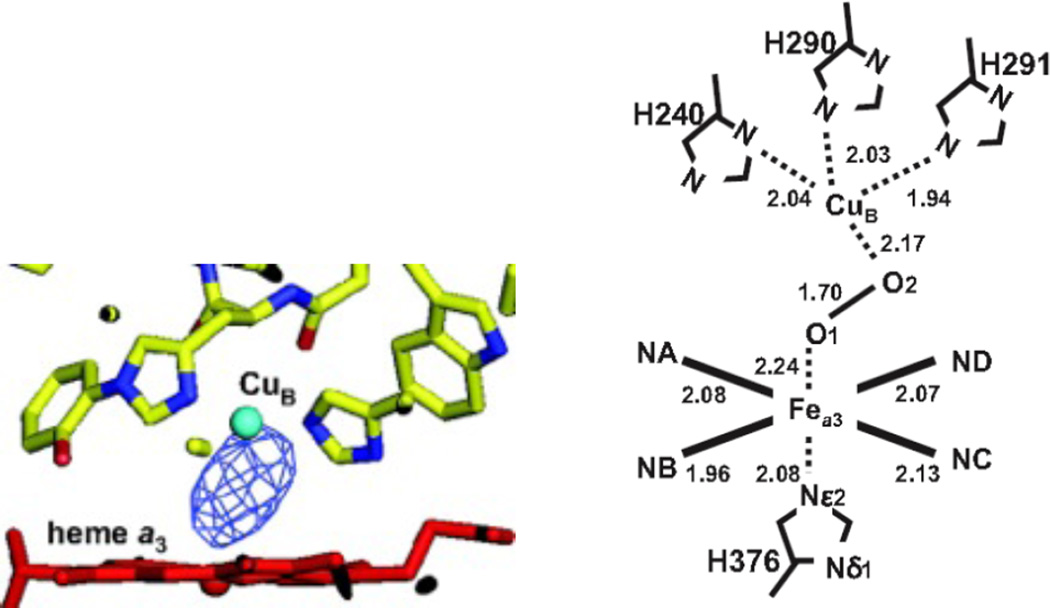
Resting oxidized structure of CcO. Left) Fo-Fc difference electron density maps calculated at 2.5 Å resolution. The datasets are depicted together with the structural model of heme a3 (red) and CuB (cyan). Right) Coordination geometries of the peroxide anion obtained from structural refinement calculated at 2.1 Å resolution. The interatomic distances are given in angstroms. Other distances and angles are Fea3-CuB = 4.87 Å; Nε2(H376)-Fea3-O1 = 168.5°; Fea3-O1-O2 = 144.1° and O1-O2-CuB = 90.5°. (Figure reprinted with permission from Ref. .)
Structural comparison of the active site and key residues involved in proton pumping between oxidized (PDB ID 2GSM) and reduced (PDB ID 2FYE) states of CcO from R. sphaeroides. Reduced (solid), oxidized (transparent).
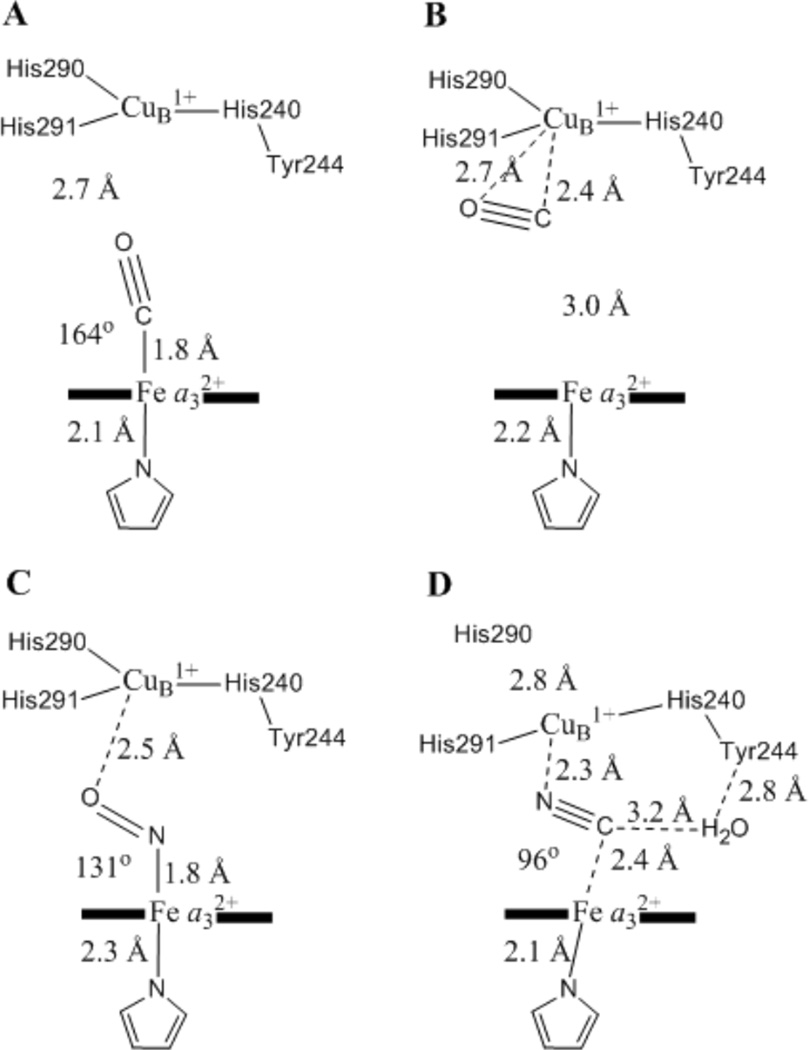
Schematic showing the crystallographic parameters of the (A, B) CO-, (C) NO-, and (D) CN−-bound forms of the binuclear center of fully reduced CcO. Adapted from reference
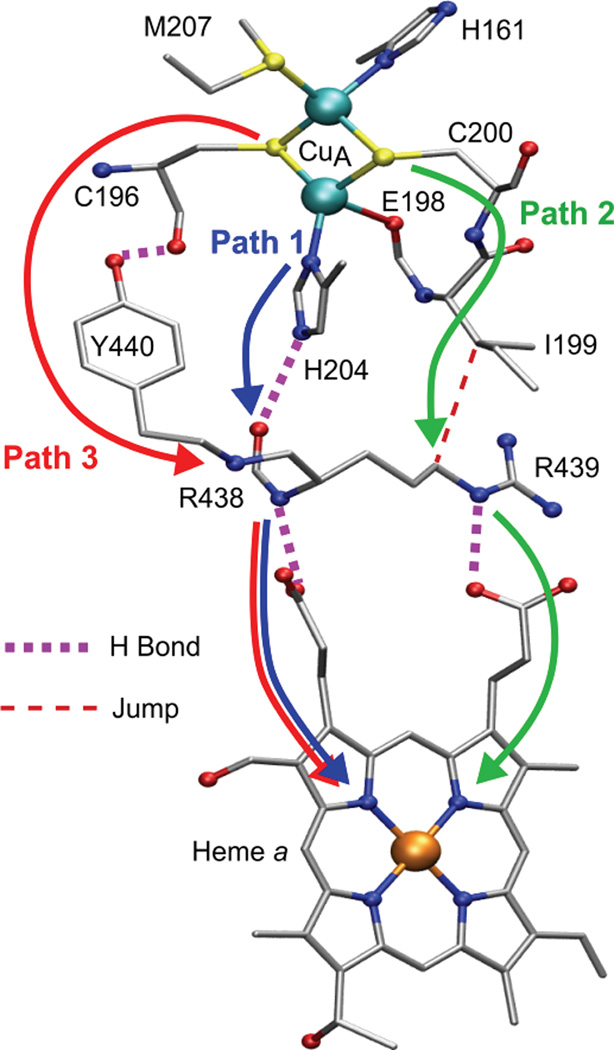
Proposed ET pathways in bovine heart CcO based on pathways analysis. The Cys200 and His204 CuA-to-heme a pathways are comparable in rate whereas the Cys196 pathway is calculated to be two orders of magnitude less efficient. R438, R439 and Y440 belong to subunit I: the remaining resides belong to subunit II. Figure generated from PDB ID 2Y69 coordinates using VMD.
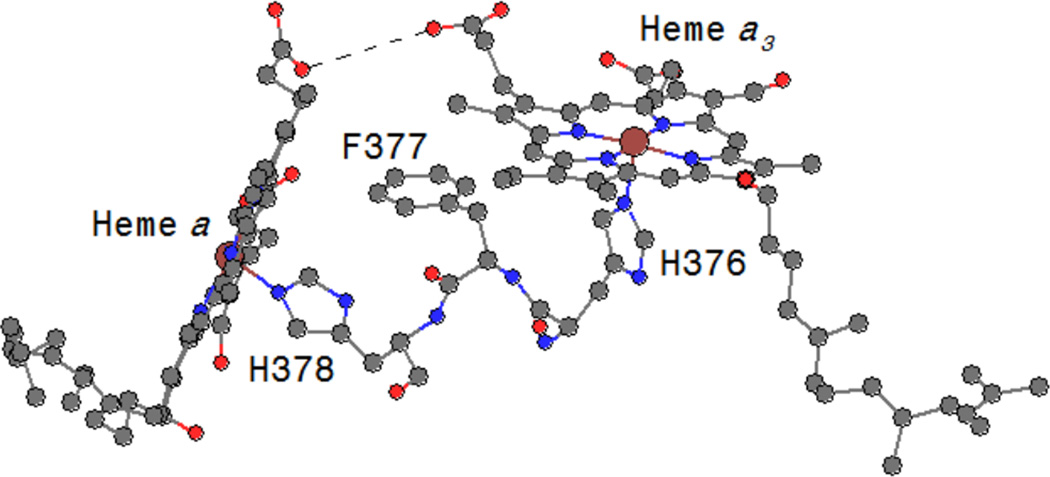
Residues forming a direct pathway between heme a and heme a3 centers. Figure generated from PDB ID 1OCC coordinates using Chem3D.

A possible electron transfer pathway from the proposed ubiquinone binding site to heme b in ubiquinol oxidase. (Reprited by permission from M Ref. Publishers Ltd: Nature Structural Biology Ref. copyright 2000)
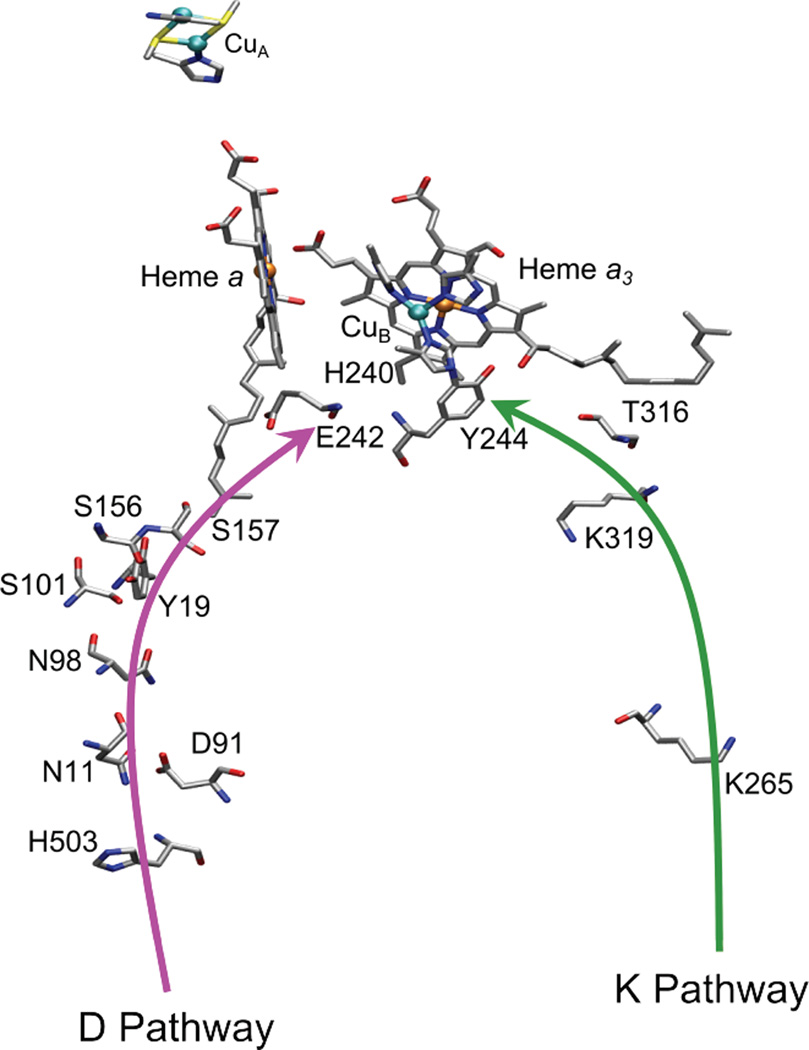
Schematic drawing showing the residues invoked in the K (green) and D (pink) proton pumping pathways. Figure generated from PDB ID 2Y69 coordinates using VMD.

Schematic drawing showing the residues invoked in the K (green) and D (pink) proton pumping pathways. Figure generated from PDB ID 2Y69 coordinates using VMD.
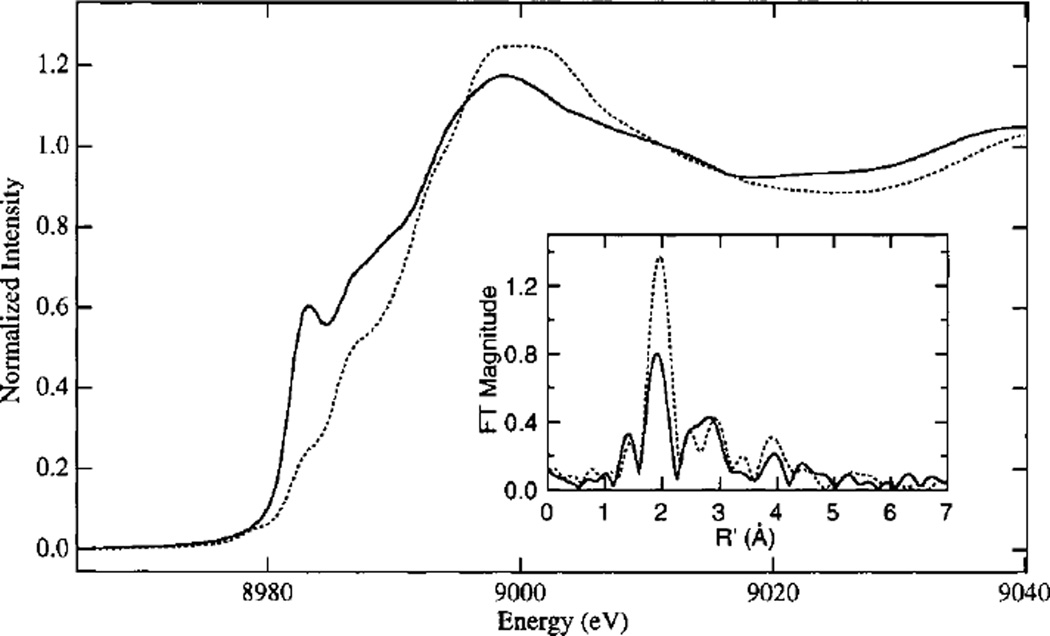
Cu K-edge X-ray absorption edge spectra of oxidized (—) and reduced (- -) UbO; Inset: Fourier transform of the Cu EXAFS. (Reprinted with permission from Ref. . Copyright 1999 American Chemical Society.)

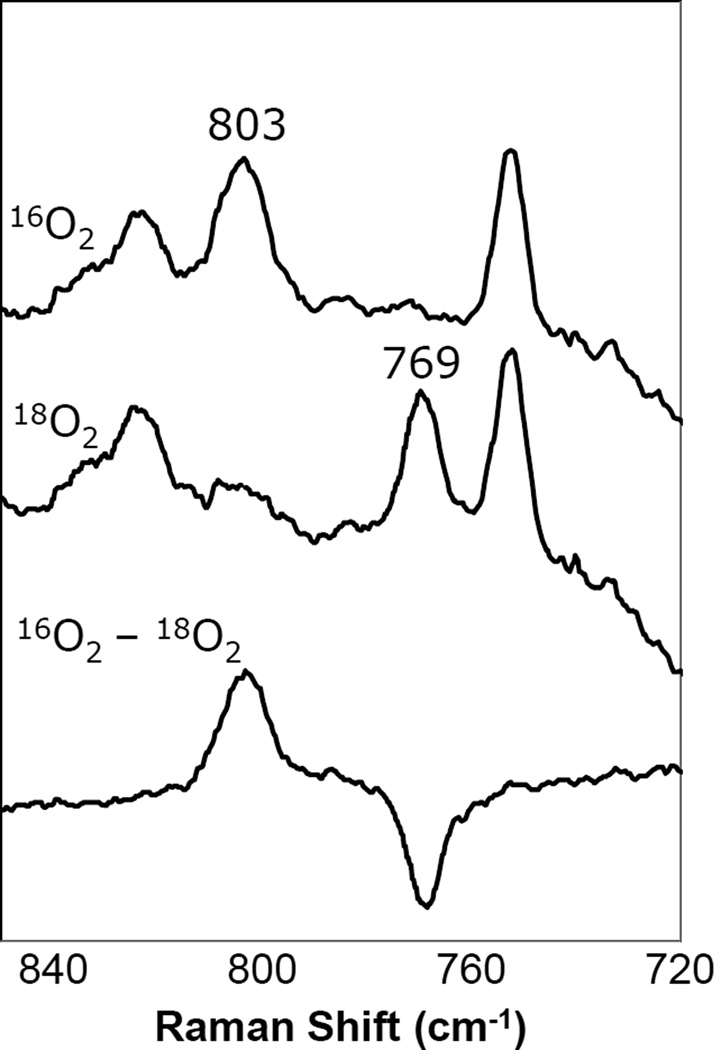
Resonance Raman spectra and difference spectra of the primary oxygen intermediate from the reaction of fully reduced CcO with dioxygen. Reacion of fully reduced with A) 16O2, B) 18O2, C) difference spectra showing the isotopic shift and D) difference spectra showing isotopic shift of prmary intermediate in the reaction of oxygen with the mixed-valence (Mixed Val) enzyme. Adapted from Reference Proc Natl Acad Science USA
Resonance Raman spectrum (607 nm excitation) of a P state of bovine CcO.

ATR-FTIR difference spectrum of P. denitrificans cytochrome c oxidase state PM minus state O. The feature at 1519 cm−1 is indicative of a tyrosyl radical.

Resonance Raman difference spectrum of the reaction of CcO with 16O2 and 18O2 at 520 μs using 427 nm excitation that displays two oxygen isotope sensitive features, a νFe—O at 786 cm−1 and a δN—Fe—O at 355 cm−1, consistent with an Fe(IV)=O in state F. (Figure reprinted with permission from Ref. .)

Simplified consensus mechanism of the reductive cleavage of O2 by hemecopper oxidases.
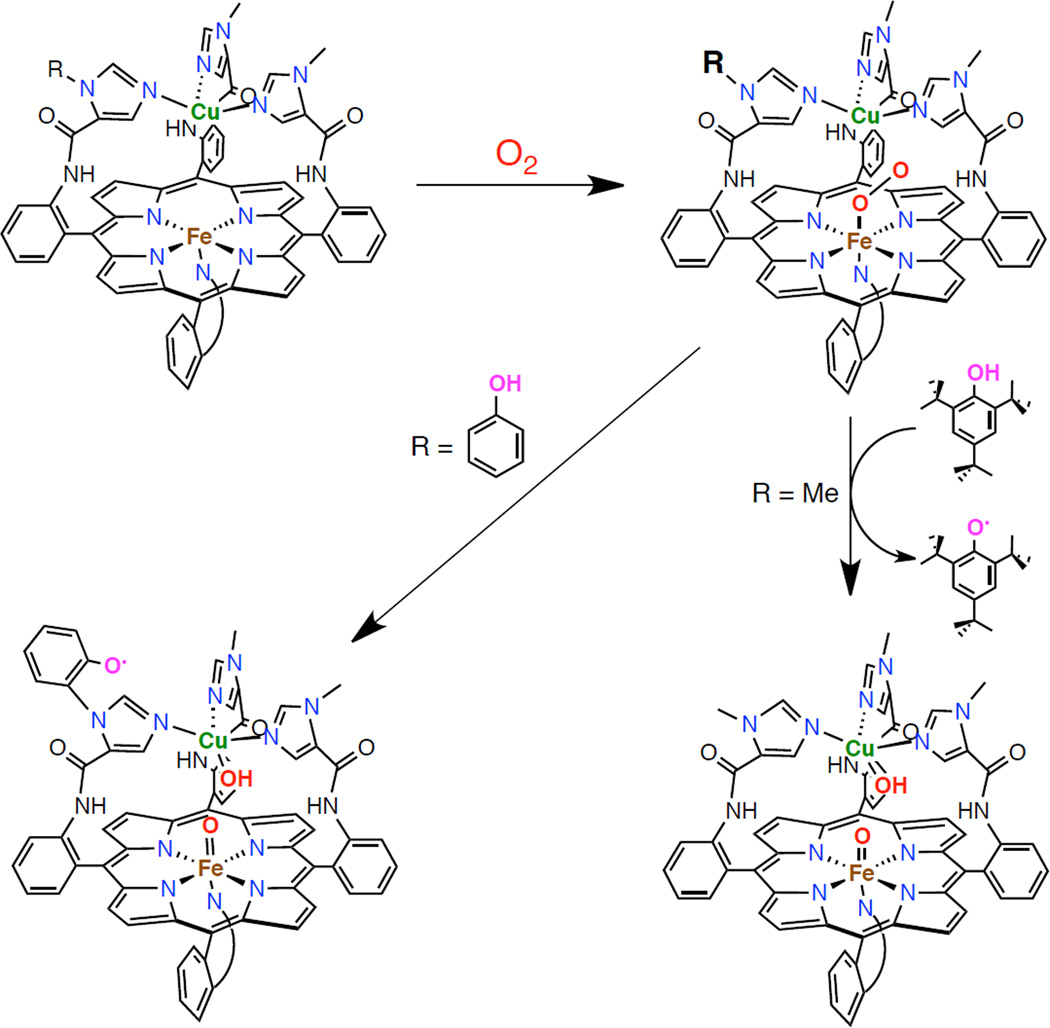
Heme-copper models created by Collman and coworkers in which addition of dioxygen to the reduced precursor generates a Fe(III)-superoxide intermediate which is competent for inter- and intramolecular hydrogen atom abstraction to generate a phenoxy radical.

Addition of dicyclohexylimidazole to {[(F8)Fe]-O2-[Cu(AN)]}+ results in a distinct species in which the imidazole coordinates the iron axially, and the geometry of the peroxide ligand bridges changes from “side-on” to “end-on”. The spin of the heme also changes from high-spin to low-spin upon coordination of the imidazole.
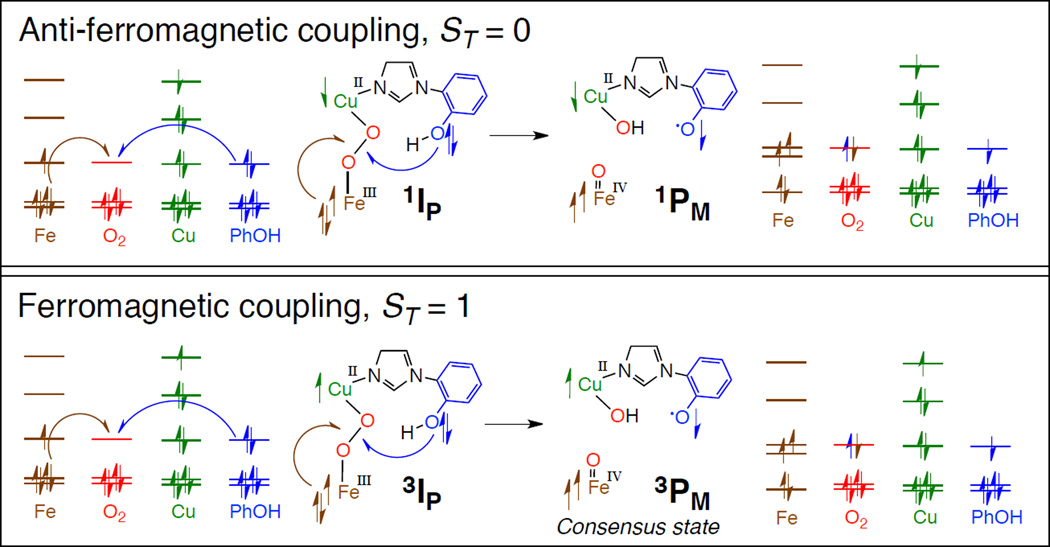
Schematic of the spin topology of the reductive cleavage of a putative peroxointeremdaite in CcO to generate PM. A spin down electron originates from the Fe, and a spin up electron originates from the crosslinked tyrosine to fill the σ* of the peroxide ligand. (Reprinted with permission from Ref. . Copyright 2011 American Chemical Society).
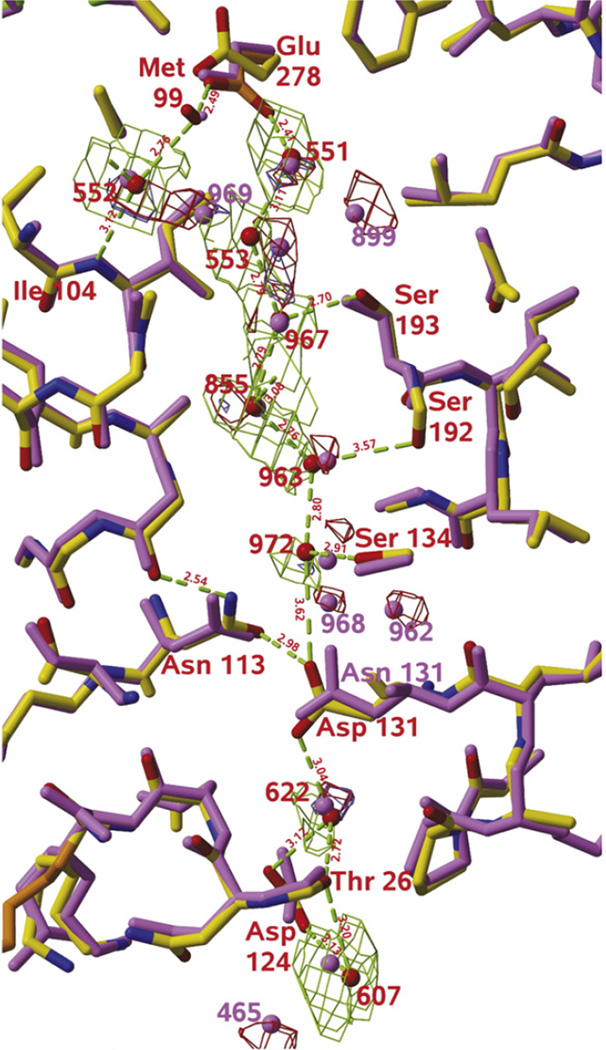
Overlay of the D-channel of wild-type (purple) and N131D (carbon atoms in yellow) variant of P. denitrificans cytochrome oxidase. Hydrogen bonds between waters and channel residues are shown in green (Ref [Durr 2008]). E278 (E286 in R. Shpaeroides numbering) is at the top of the channel and is found in two different orientations, “up” and “down”.
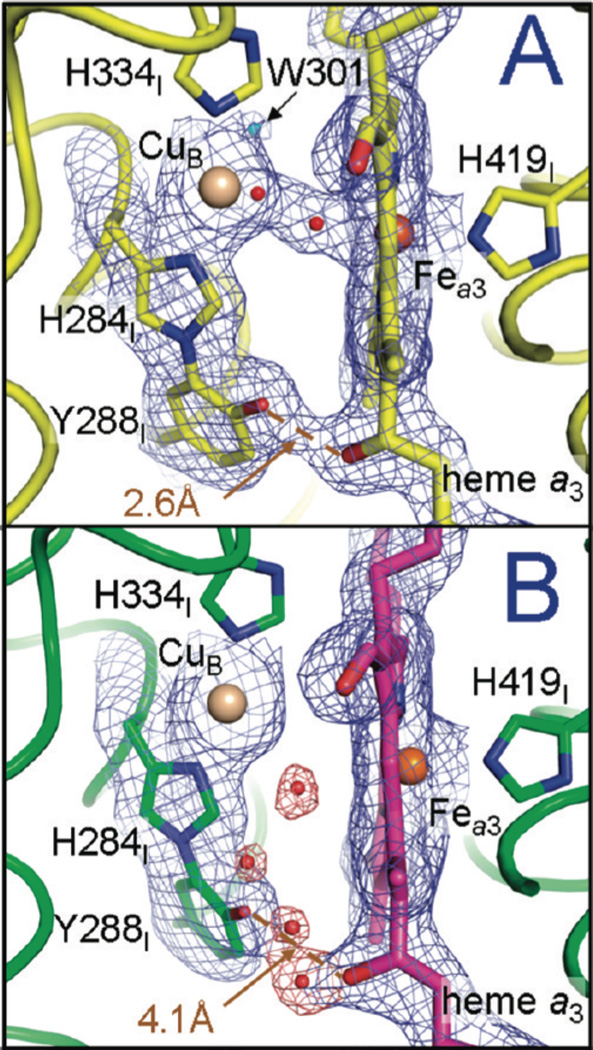
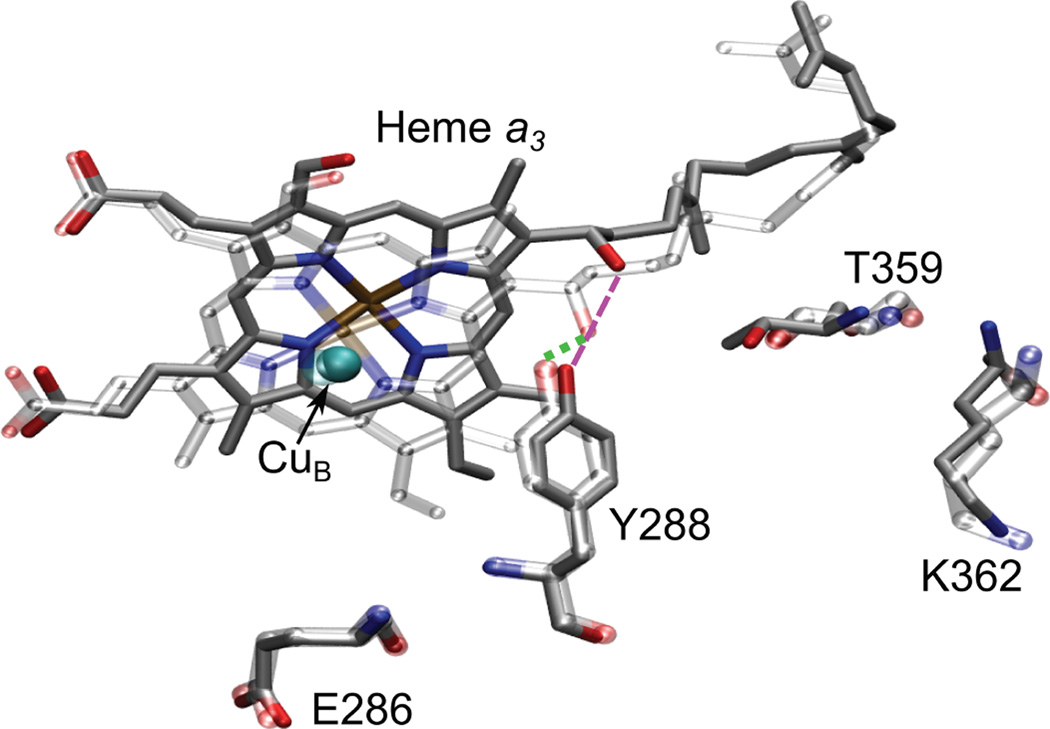
The reduction of resting CcO (A) to generate fully reduced CcO (B) causes breaking of the crosslinked tyrosine-porphryn farnesyl hydroxide hydrogen bond to break that is associated with water entering the active site. (Reprinted with permission from Ref. . Copyright 2009 American Chemical Society).
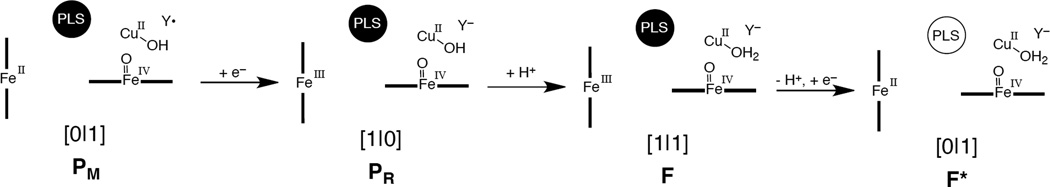
Illustration of the microscopic mechanism of proton pumping for the P → F proton pumping step. The proton loading site is loaded in PM, PR, and F.

Comparison of trinuclear active site arrangements for the multicopper oxidases and Heme-copper oxidases depicted in the NI and PM forms, respectively.
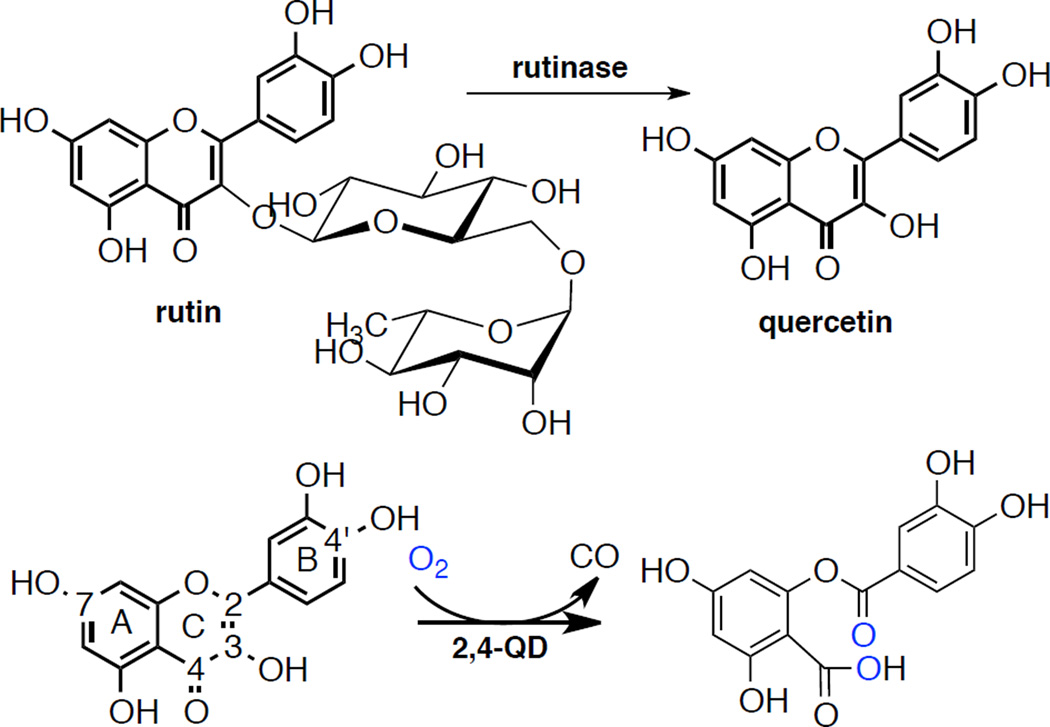
Enzymatic processes in fungi involving quercetin. A) Formation of quercetin from rutin by rutinase and 2) 2,4-dioxygenation of quercetin catalyzed by quercetin 2,4-dioxygenase, including ring and atom nomenclature for the quercetin ring.
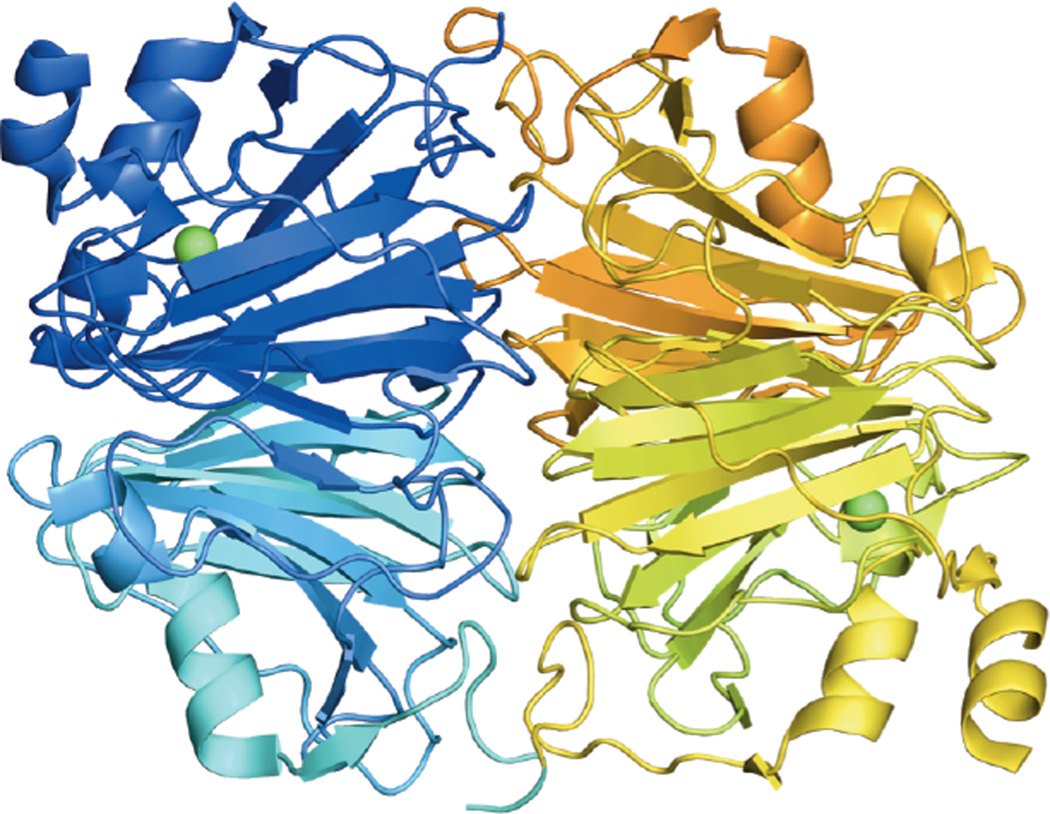
Crystal structure of the A. japonicus quercetin 2,4-dioxygenase dimer. One monomer is colored in blue and one in yellow, with different shades showing the two domains in each monomer. Copper shown in green.
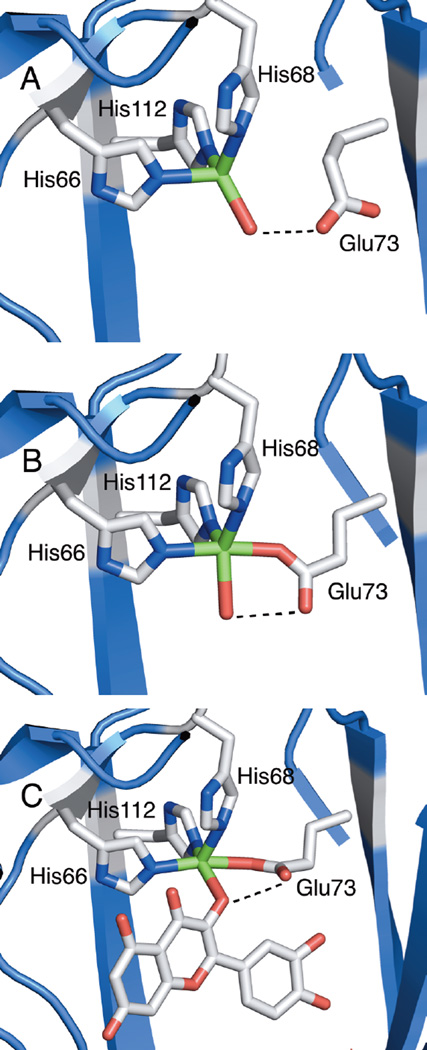
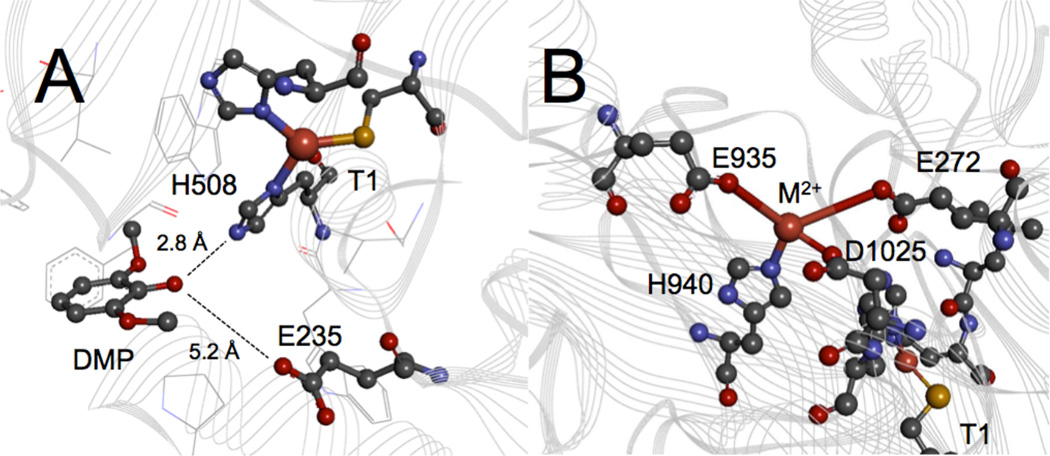
Structure of the mononuclear copper active site of A. japonicus quercetin 2,4-dioxygenase from X-ray structures. A) Resting quercetin 2,4-dioxygenase site, Glu73-off conformation (major form, 70%). B) Resting quercetin 2,4-dioxygenase site, Glu-on conformation (minor form, 30%). C) quercetin 2,4-dioxygenase enzyme-substrate complex with quercetin. Dotted lines represent hydrogen bonds.
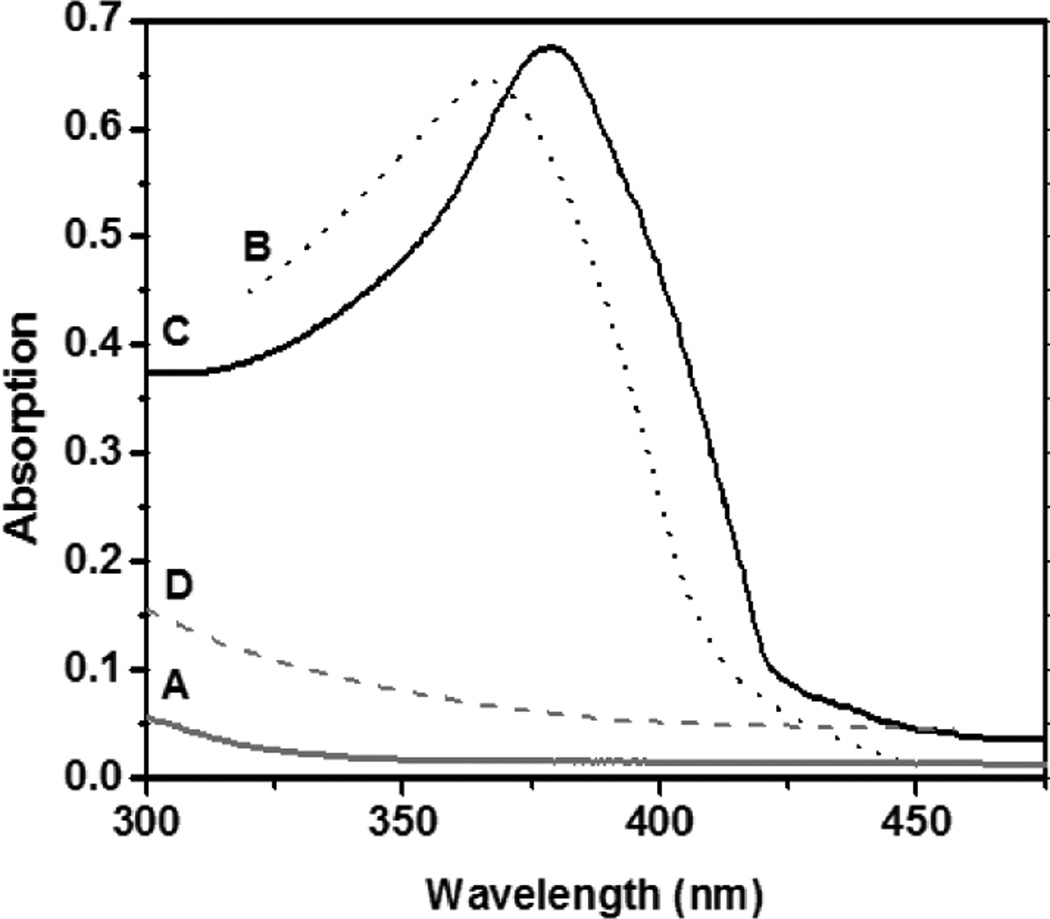
Absorption spectra of A. flavus quercetin 2,4-dioxygenase: A) resting enzyme at pH 6, B) free quercetin, C) the ES complex of quercetin 2,4-dioxygenase with quercetin, and D) the product spectrum after exposing the ES complex, C, to O2.
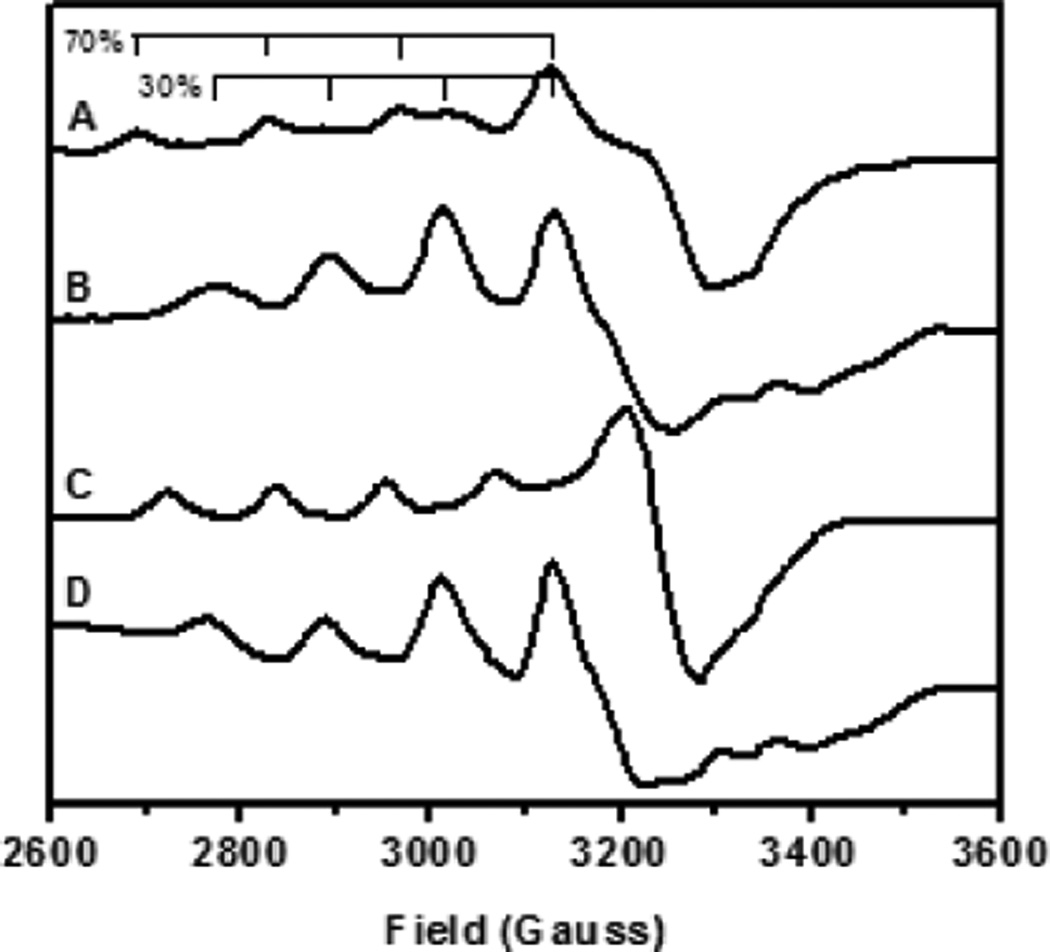
EPR spectra of different forms of quercetin 2,4-dioxygenase from A. japonicus. A) Resting quercetin 2,4-dioxygenase at pH 6 (solid lines represent the major, tetrahedral form and dashed lines represent the minor, 5 coordinate form). B) Resting quercetin 2,4-dioxygenase at pH 10 (only the trigonal bipyramidal form contributes). C) quercetin 2,4-dioxygenase enzyme-substrate complex with 1 eq. quercetin (2.5% DMSO). D) quercetin 2,4-dioxygenase enzyme-product complex observed after exposure of (C) to air.

Proposed mechanism for the 2,4-dioxygenation of quercetin by 2,4-QD.
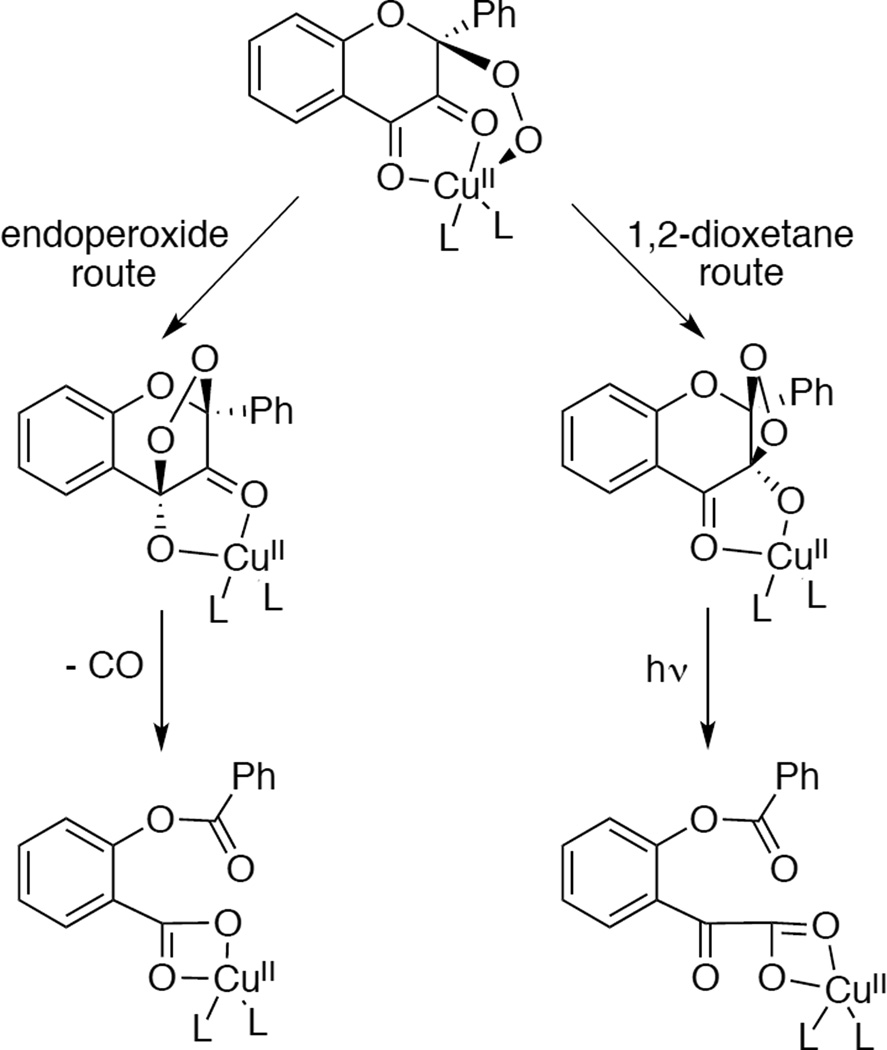
Alternative 2,4 dioxygenation routes observed in CuII flavonolate model complexes.
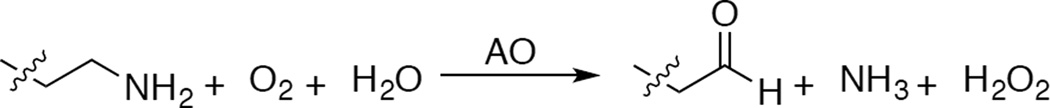
Oxidation of amines to aldehydes catalyzed by amine oxidase.
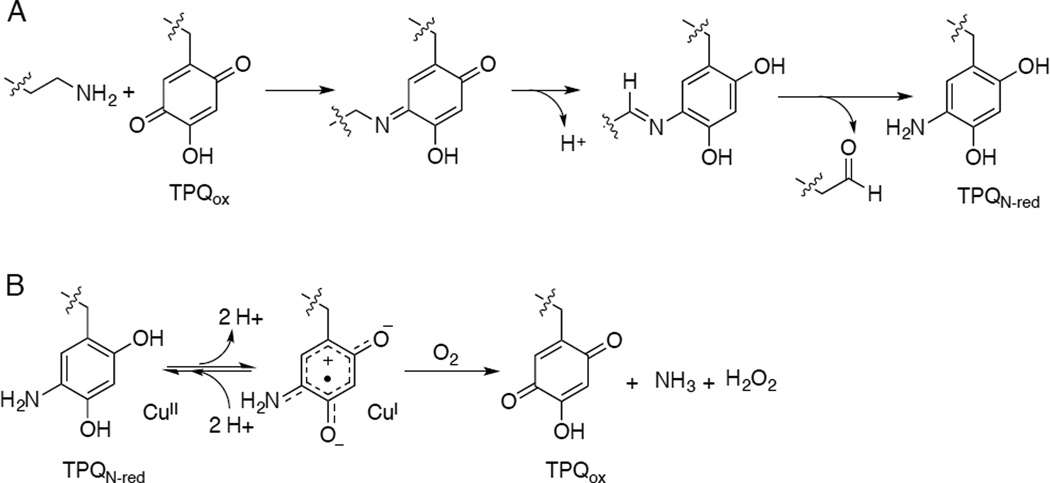
Amine oxidation catalyzed by TPQ-containing amine oxidases. A) Reductive half-reaction. B) Oxidative half reaction of AO, including the proposed equilibrium between CuII-aminoquinol and CuI-semiquinone forms of the amine-reduced site.
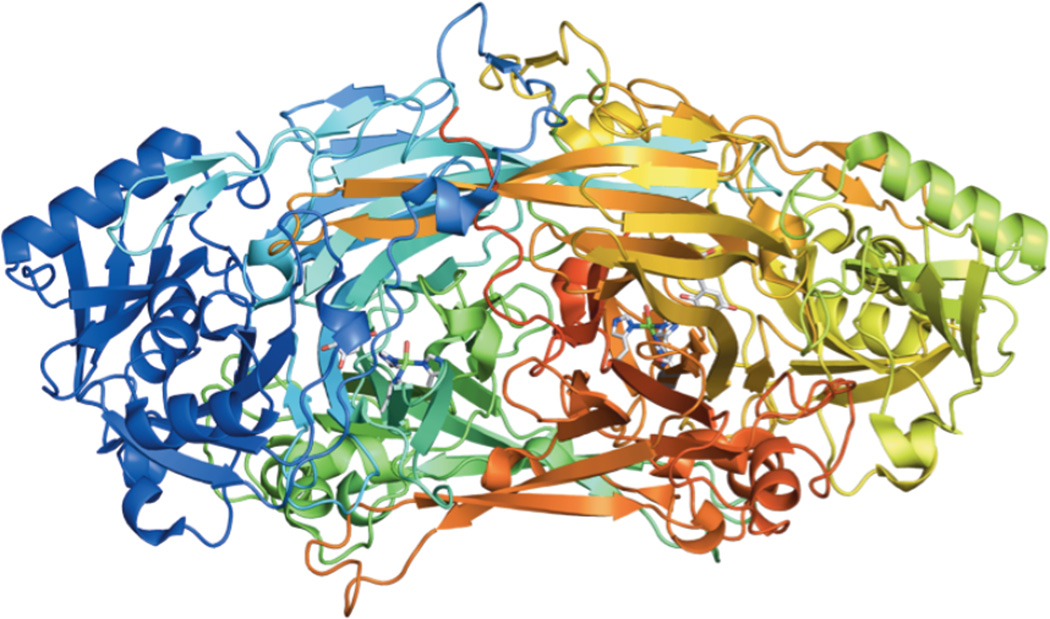
X-ray crystal structure of holo AGAO.
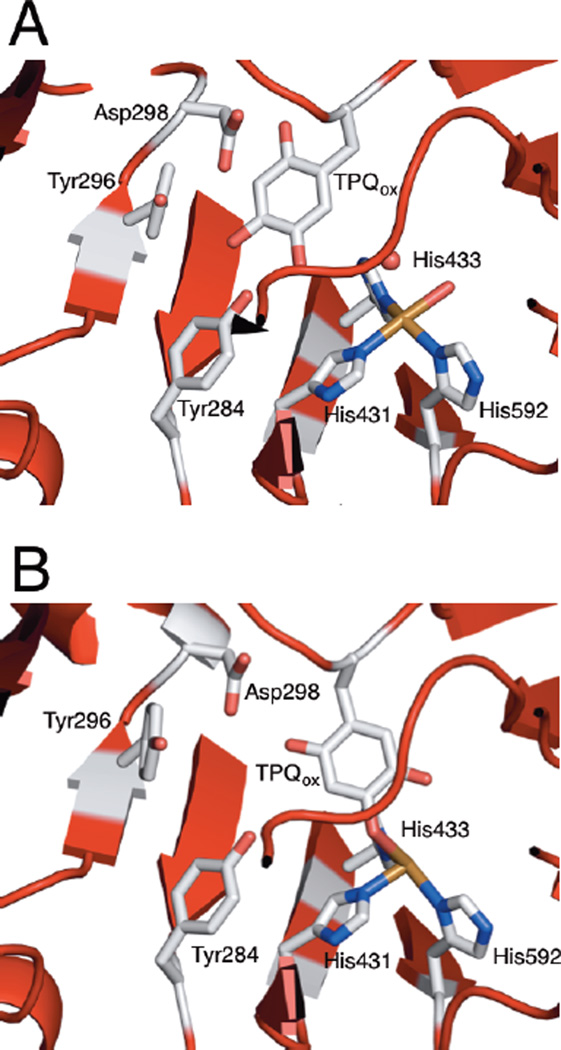
Active site structure of holo amine oxidase with TPQ in the active conformation (A) and inactive conformation (B). Important second sphere residues pictured are Tyr284 (H-bonding partner of TPQ), Asp298 (the active site base), and Tyr296 (lid for substrate access channel).
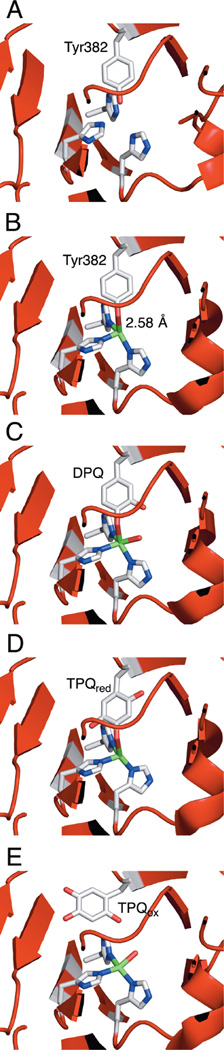
X-ray snapshots of TPQ biogenesis. A) Apo Amine Oxidase. B) Anaerobic Cu-reconstituted preprocessed Arthrobacter globiformis Amine Oxidase. C) DPQ intermediate trapped in the crystal. D) TPQred on-Cu structure. E) Oxidized holo Arthrobacter globiformis Amine Oxidase containing off-Cu TPQox.
Spectral features of processed (red, a) and preprocessed (black, b) Arthrobacter globiformis Amine Oxidase. A) Room temperature absorption. B) Room temperature circular dichroism. C) 77 K EPR spectra.
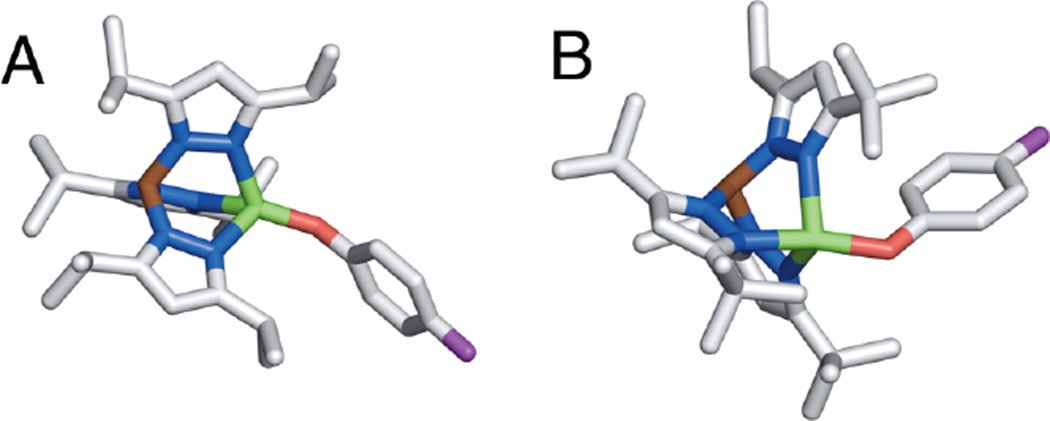
Crystal structures of tetrahedral phenolate-copper model complexes for active site of Amine Oxidase. A) [Cu(OPh-F)(HB(3,5-i-Pr2Pz)3)] – L1. B) [Cu(OPh-F)(HB(3-tBu-5-i-Pr2Pz)3)] – L3.
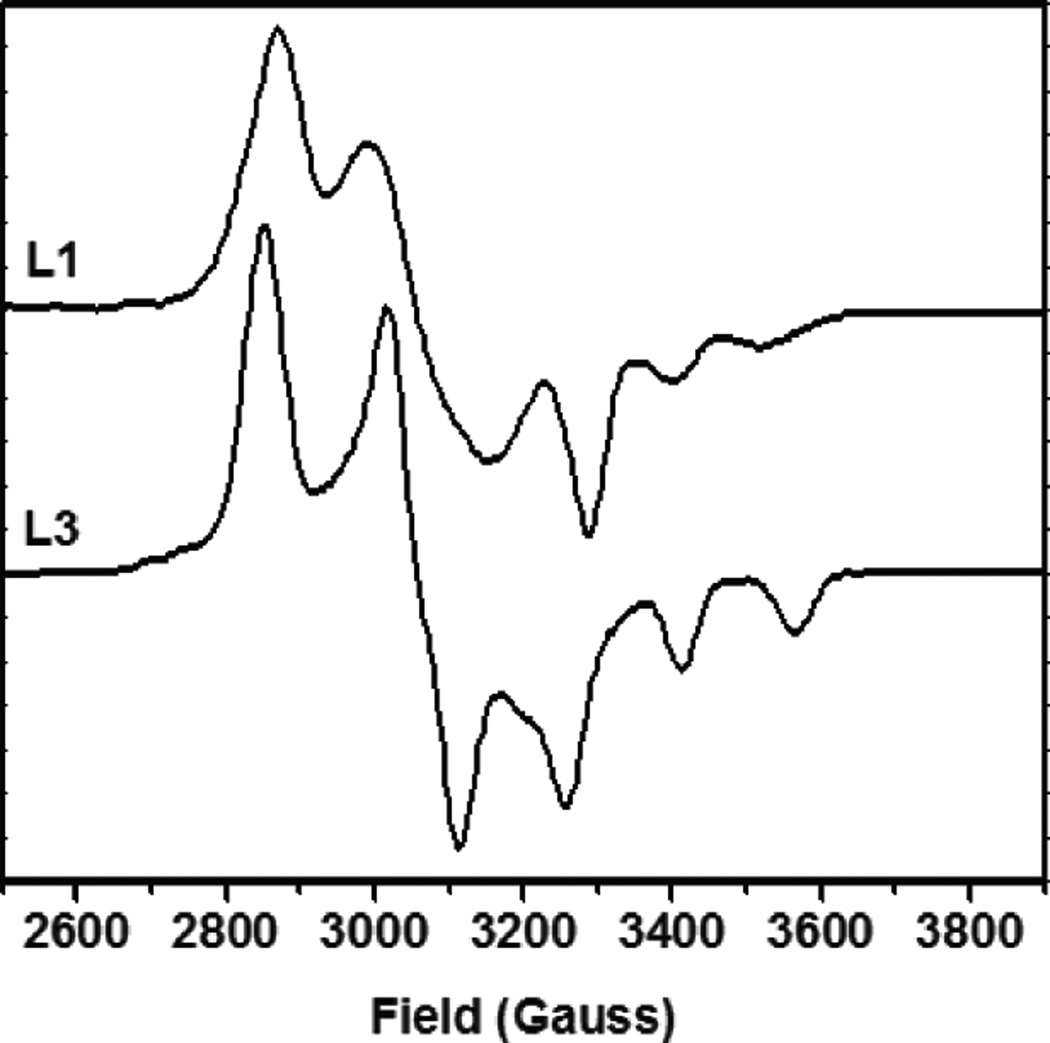
77K EPR spectra of [Cu(OPh-4-F)(L)]+ model complexes (top L1, bottom L3).
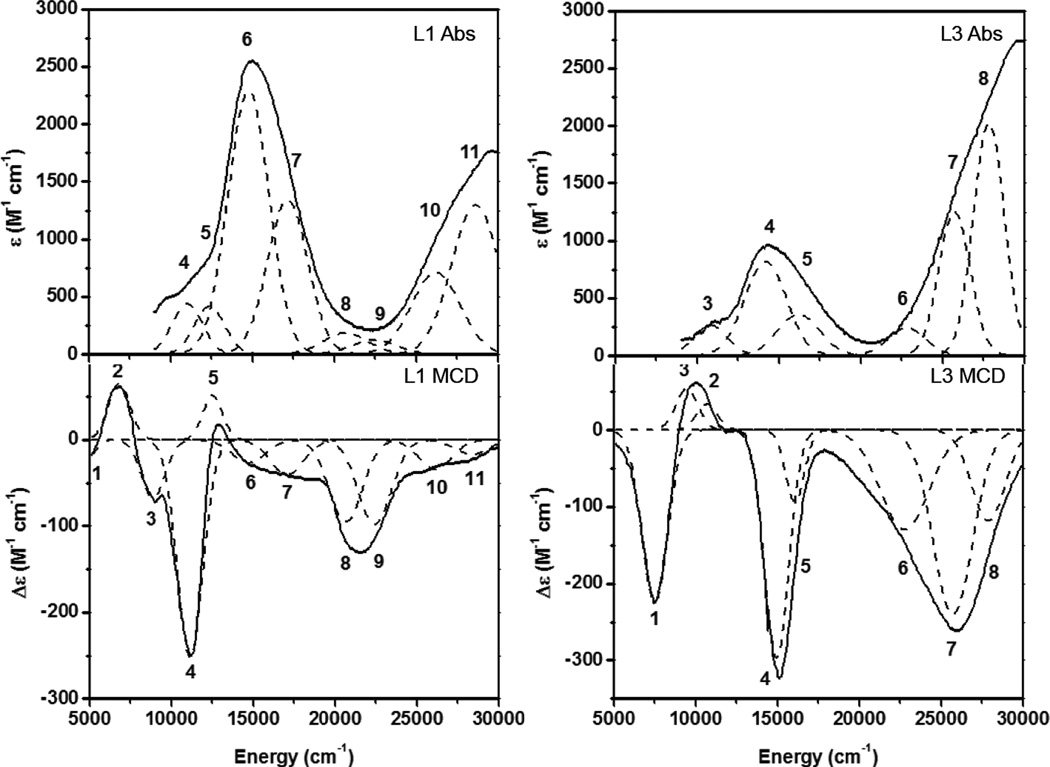
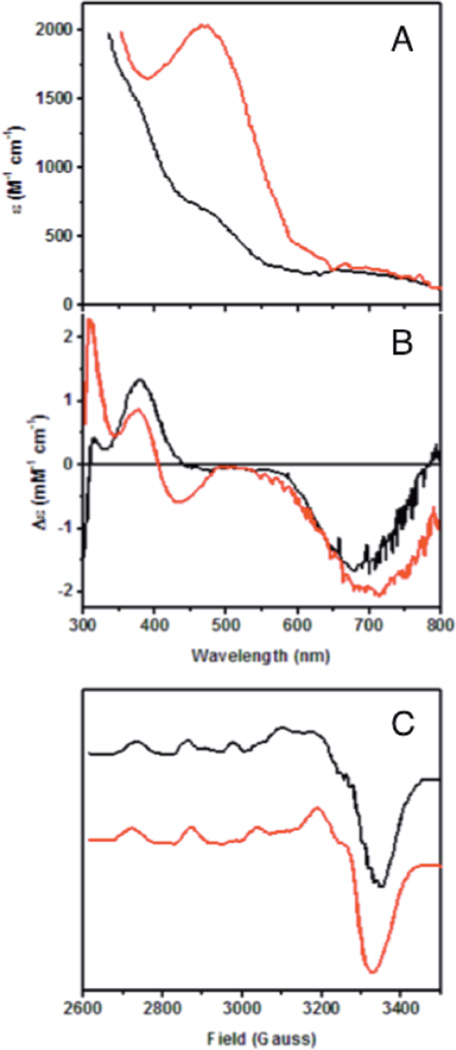
Low temperature absorption and MCD spectra of [Cu(OPh-4-F)(L)]+ model complexes (left site L1, right side L3).
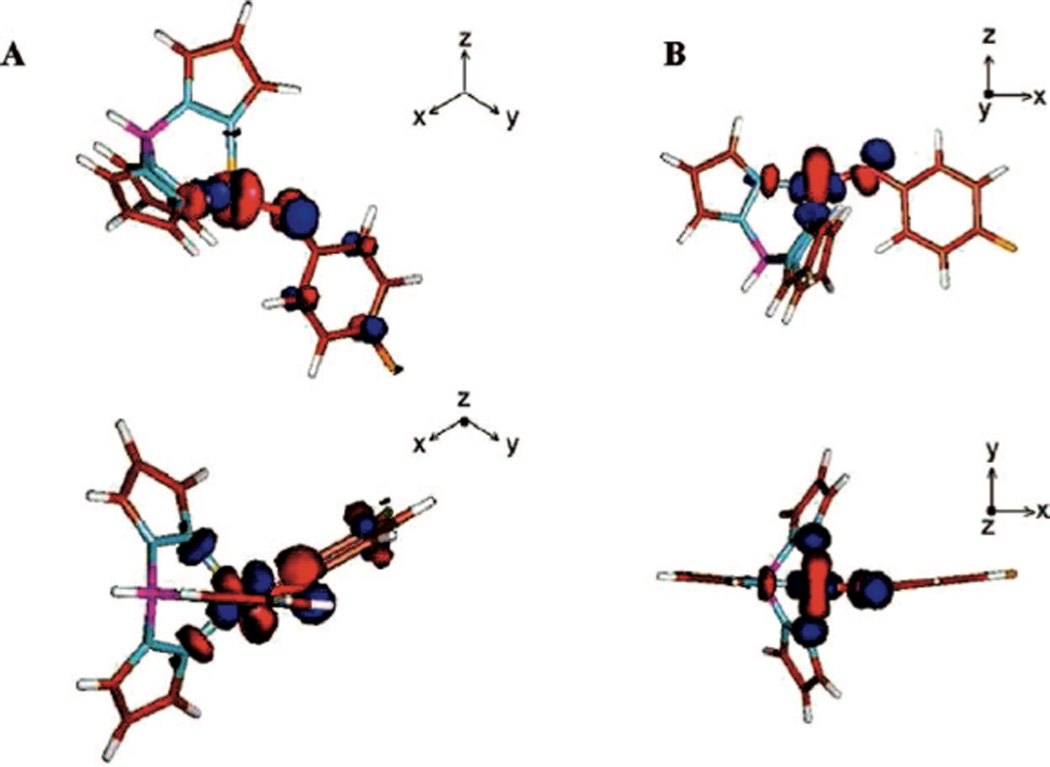
β LUMOs of [Cu(OPh-4-F)(L)]+ model complexes. A) L1, B) L3. (Reprinted with permission from Ref. . Copyright 2008 American Chemical Society.)
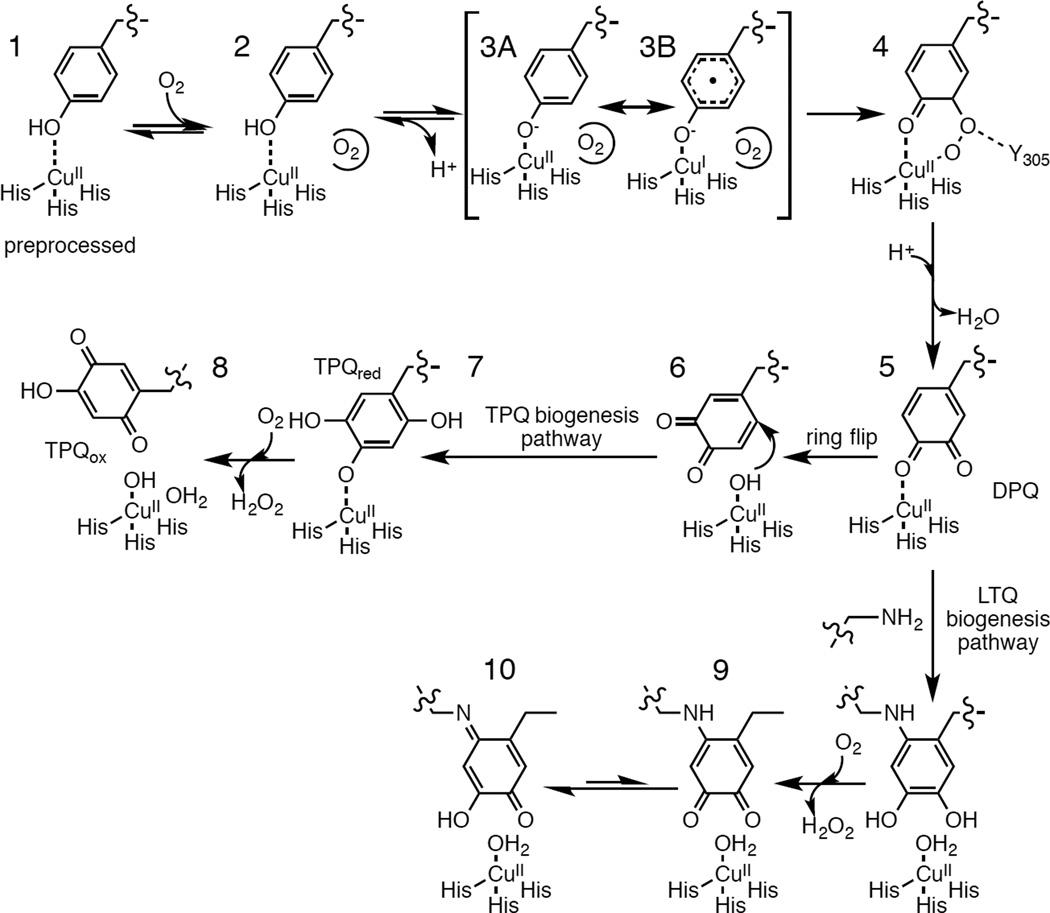
Proposed mechanism for TPQ and LTQ biogenesis.
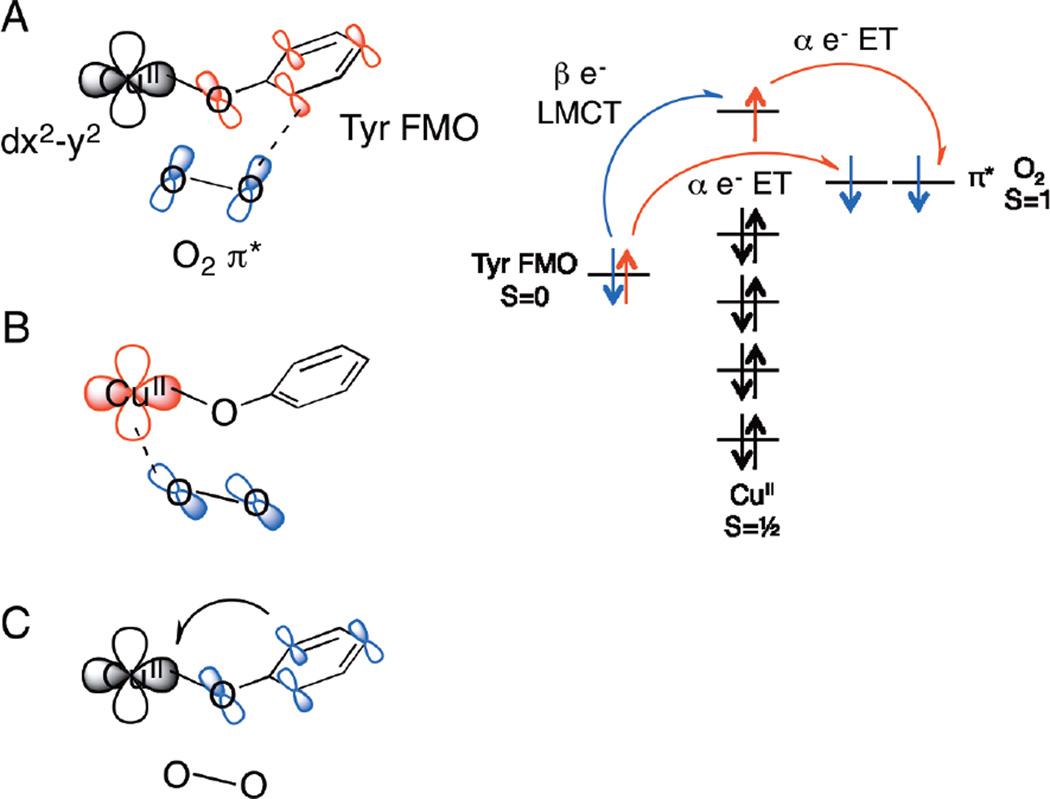
Orbital overlap of key frontier molecular orbitals showing the electron transfer process during our proposed concerted mechanism for O2 attack on the [Cu(His)3(Tyr)]+ site in TPQ biogenesis. Blue indicates orbitals involved in the transfer of a beta spin electron, red indicates orbitals involved in the transfer of an alpha spin electron.
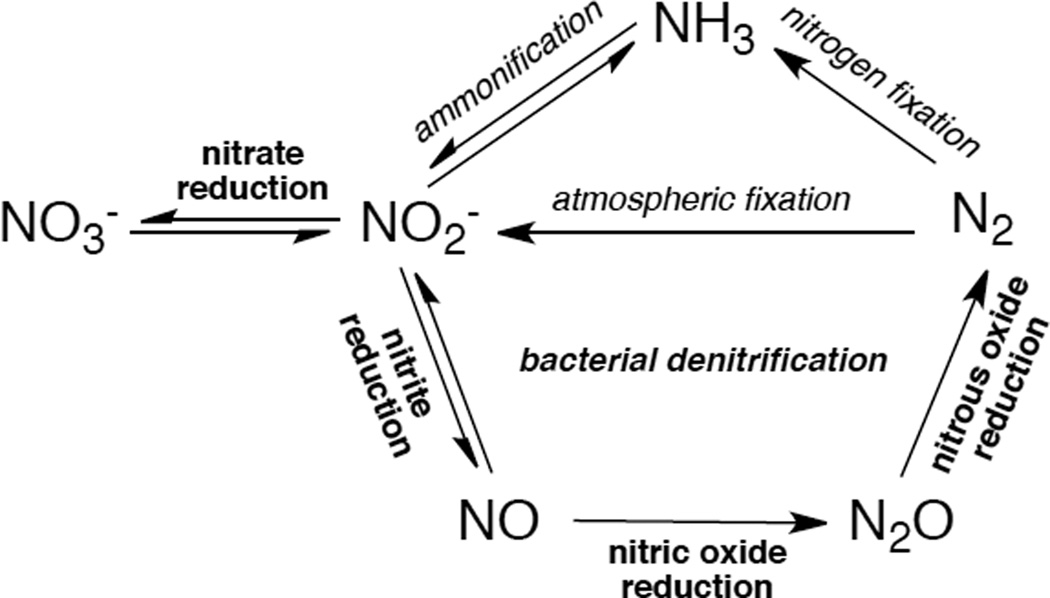
The nitrogen cycle.
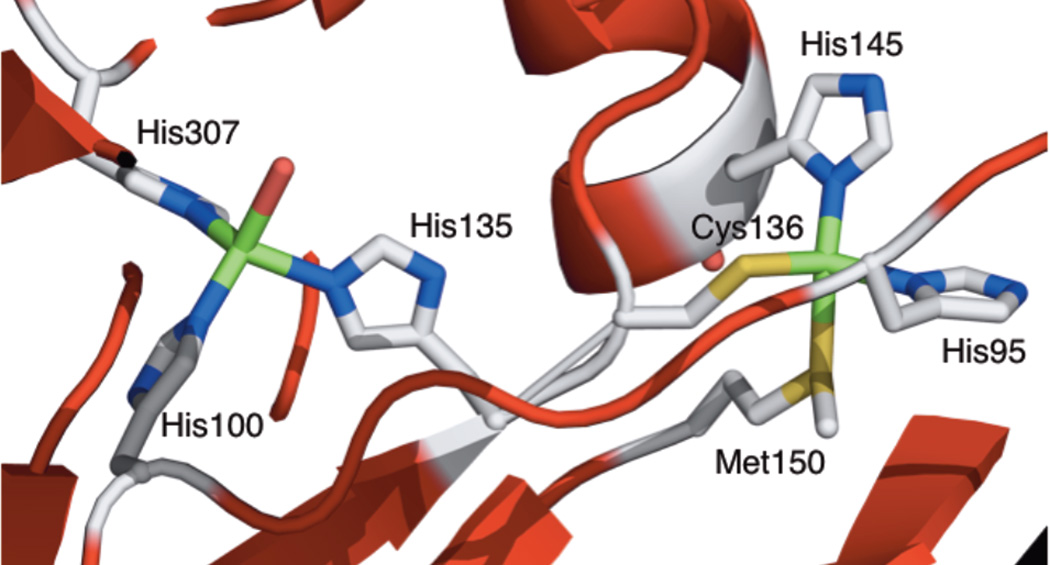
The Type 1 and Type 2 sites of nitrite reductase with their ligands, showing the Cys-His pathway.

The Type 2 site of copper nitrite reducatse with various ligands bound, including the key second sphere residues Asp98 and His255. A) Resting T2 site with hydroxide ligand. B) Nitrite bound oxidized T2 site. C) NO bound T2 site.
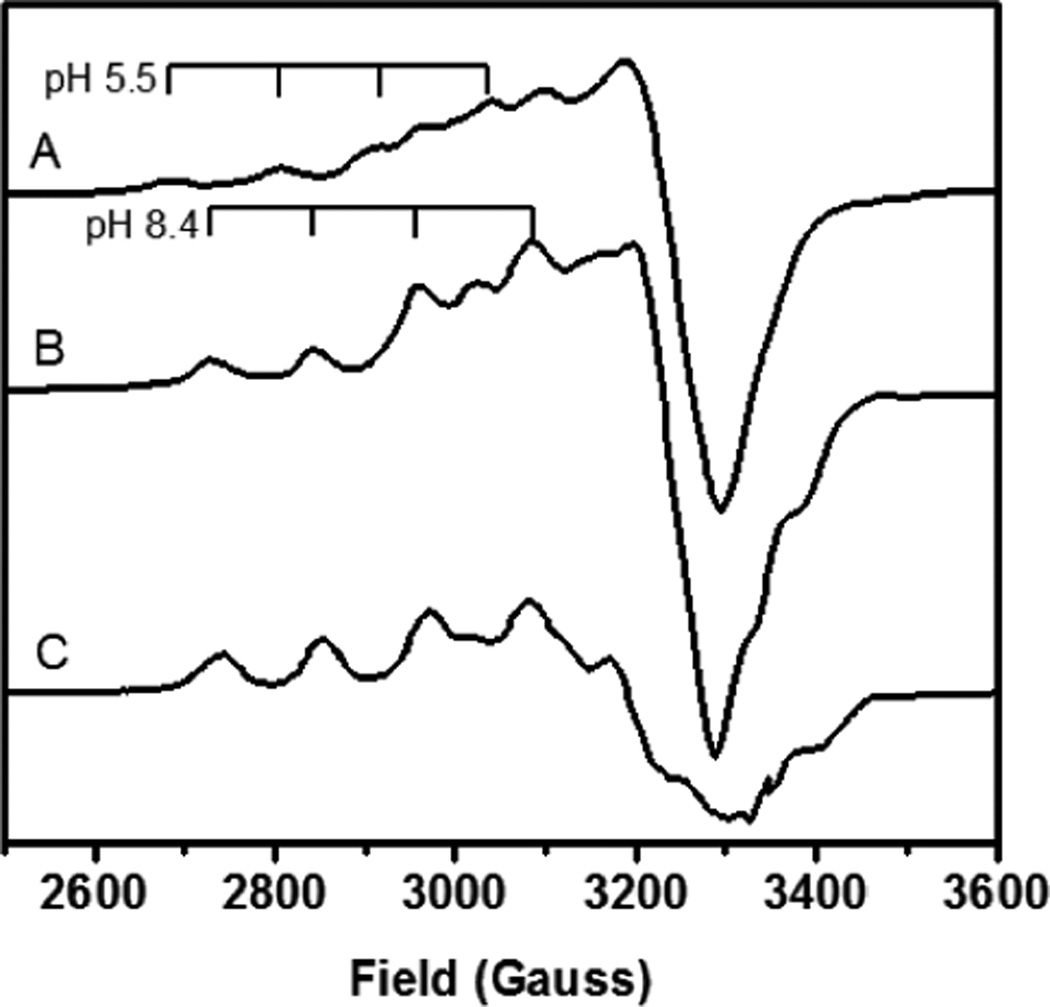
EPR spectra of significant nitrite coordinated T2 species. A) Nitrite coordinated T2 with T1 oxidized, pH 5.5, 77 K EPR. B) Nitrite coordinated T2 with T1 oxidized, pH 8.4, 77 K EPR. C) Nitrite coordinated T2 with T1 reduced, pH 8.4, 77 K EPR.
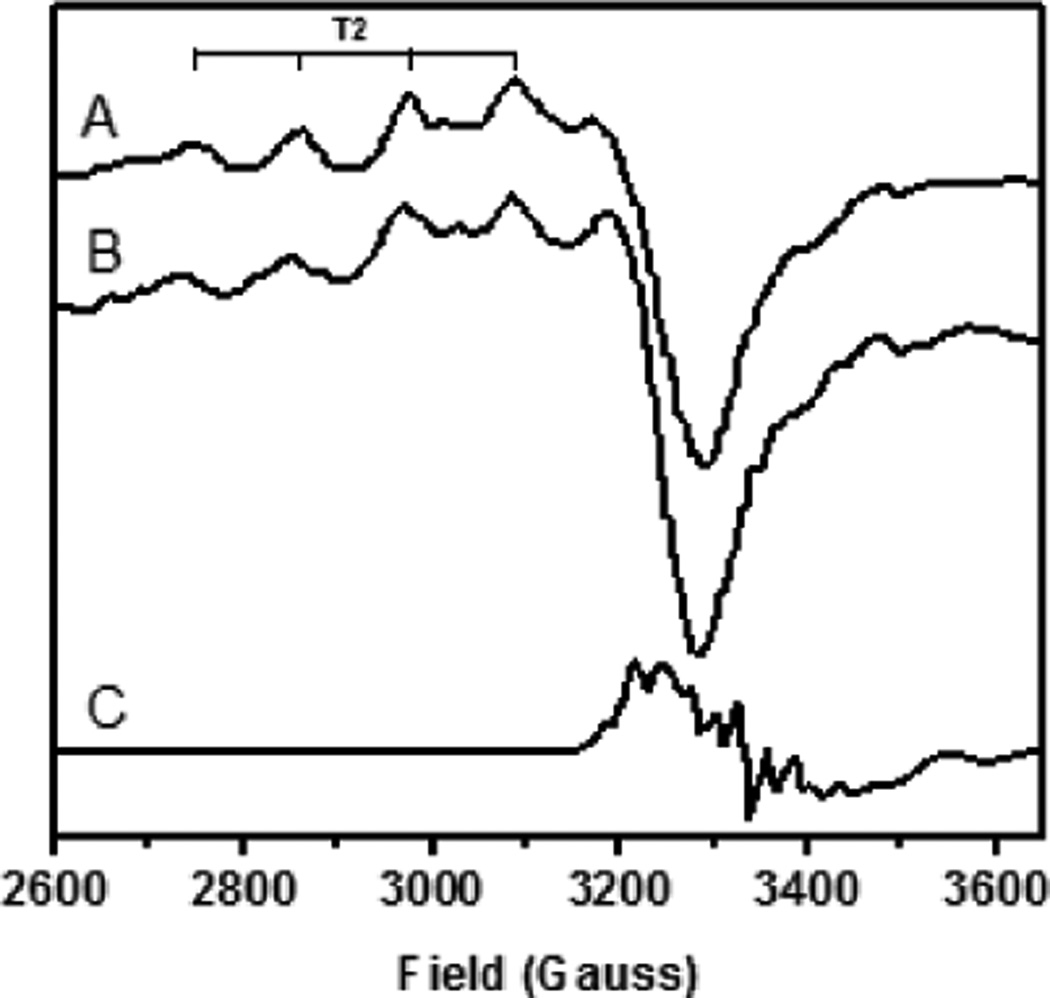
EPR spectra of putative NO-bound CuNiR species and nitrite-bound CuNiR. A) Reported CuII-NO− solution EPR spectrum, 77 K. B) Nitrite-bound T2 EPR spectrum, 77 K. C) CuI-NO• EPR spectrum obtained upon freezing 30 s after addition of NO, 77 K.
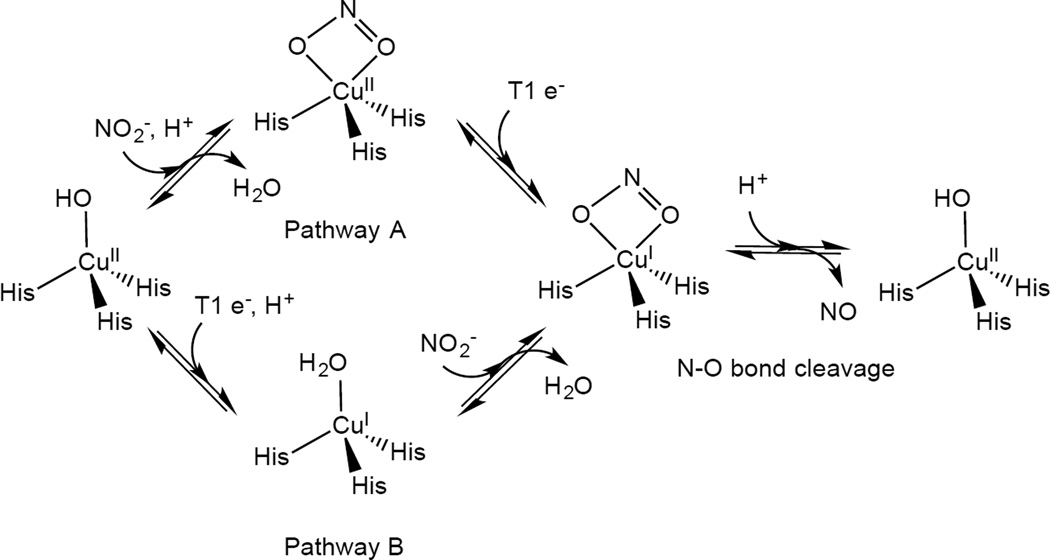
Mechanism of nitrite reduction by Cu NiR, focused on the role of the T2 site.
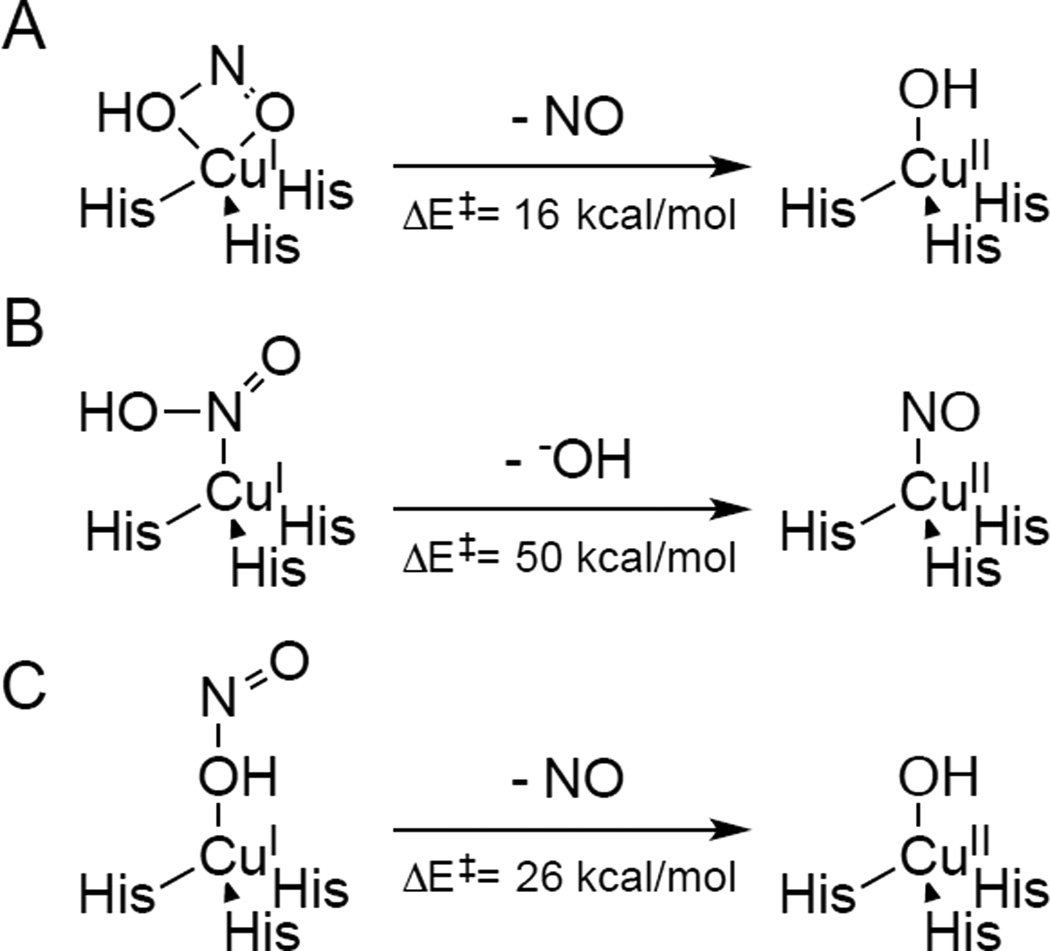
Three possible geometries of HNO2 binding to the reduced T2 Cu site and the resulting reactions. A) η2 bidentate, B) η1κN, and C) η1κO(H).
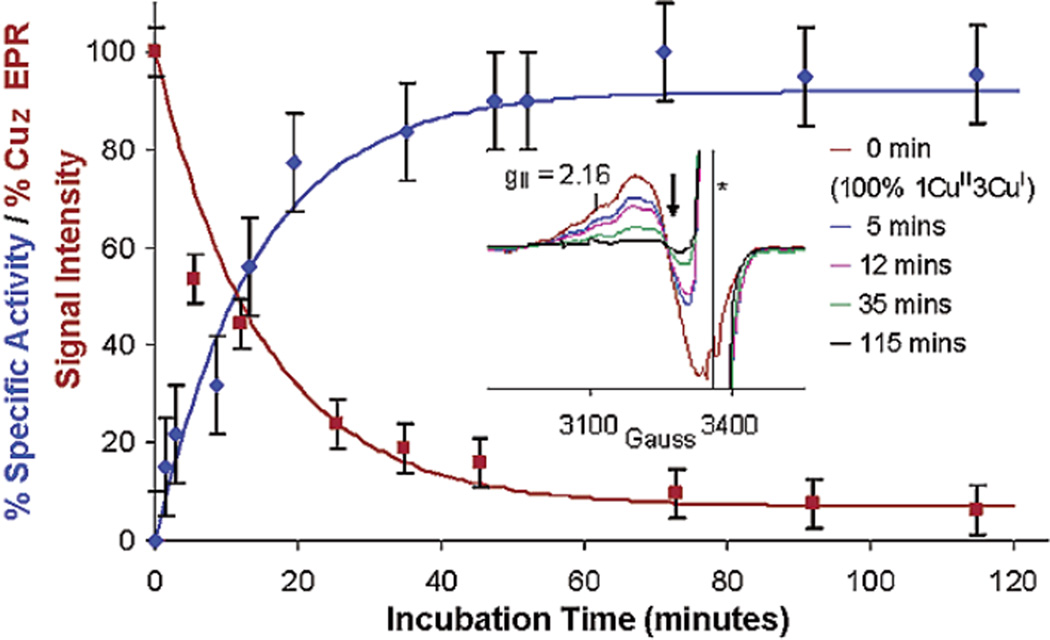
The increase in the specific activity of PnN2OR (blue) upon incubation with reduced methyl viologen correlates with a decrease in the EPR spin intensity (red) of 1-hole CuZ*. Inset: Intensity of the EPR spectra of 1-hole CuZ* decrease upon incubation with methyl viologen. (Reprinted with permission from Ref. . Copyright 2003 American Chemical Society.)
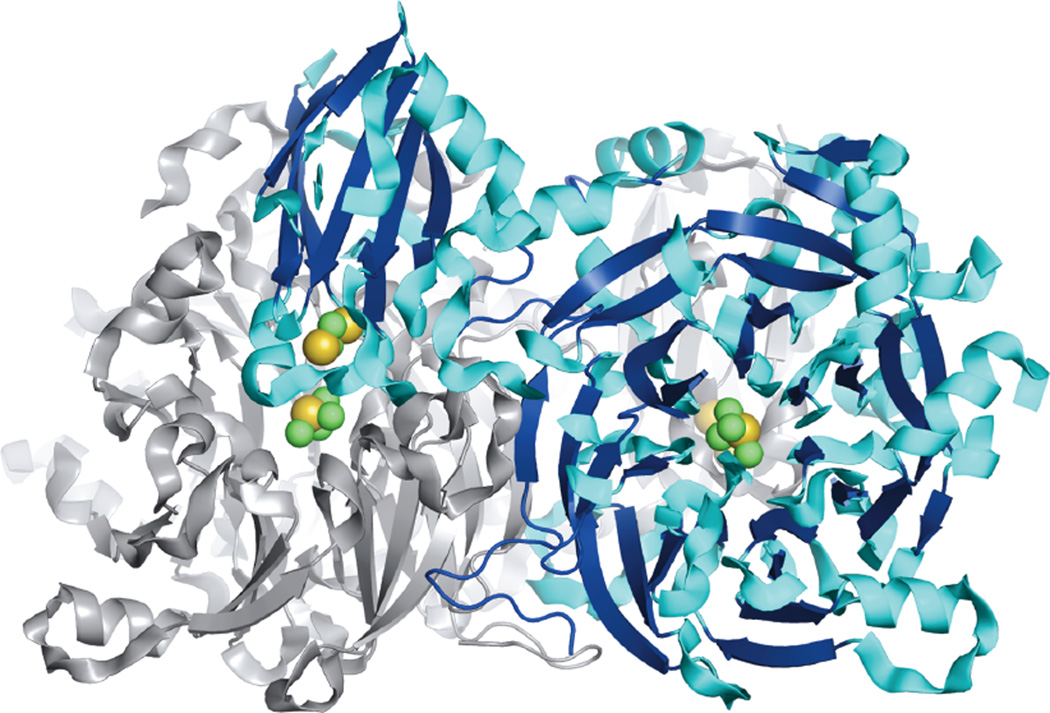
Protein structure of the N2OR homodimer (PdN2OR, 1.9 Å resolution) showing the head-to-tail association of the two monomers and the positions of the CuA and CuZ sites. One monomer is colored while the other is grey; copper is colored in green and sulfide in yellow.
The structure of CuA.
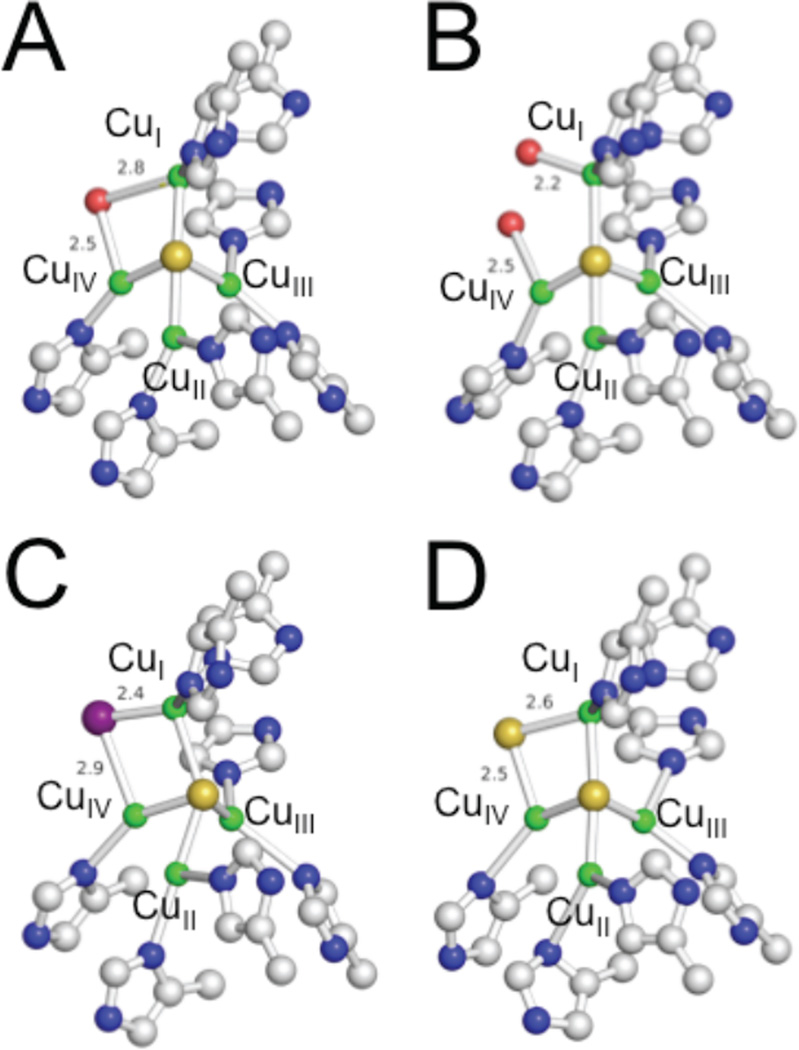
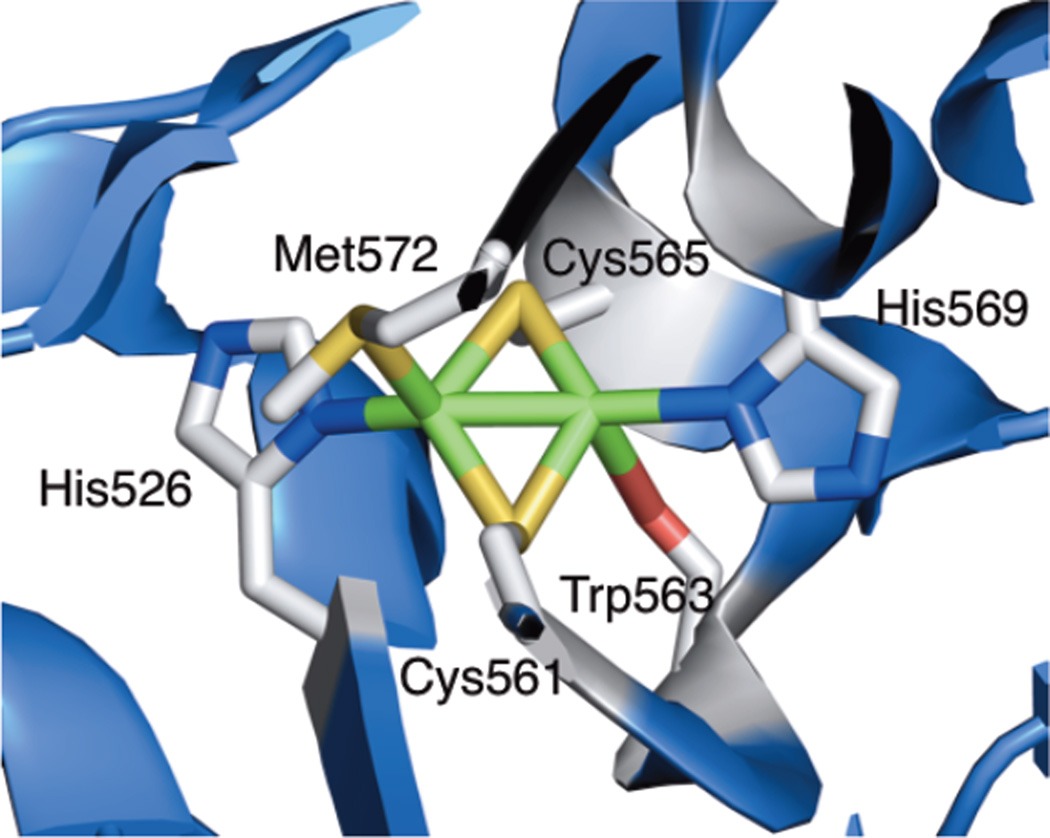
A comparison of the structures of CuZ from different N2OR crystal structures. A) PdN2OR, B) AcN2OR, C) AcN2OR with iodide bound, and D) anaerobically purified PsN2OR. Copper is colored in green; sulfide in yellow; iodine in purple; and oxygen in red.
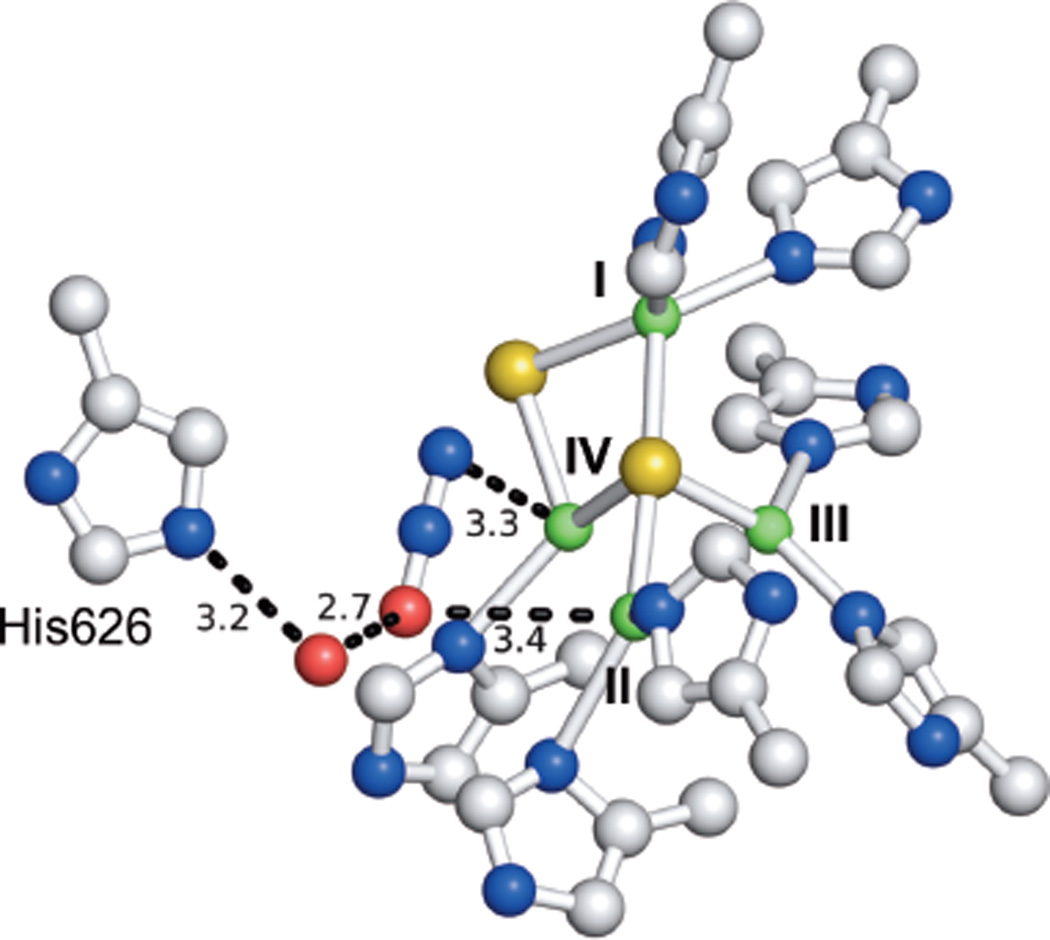
The structure of N2O bound at the CuZ site in a crystal of anaerobic PsN2OR. Distances to CuZ and key residues labelled in Å.
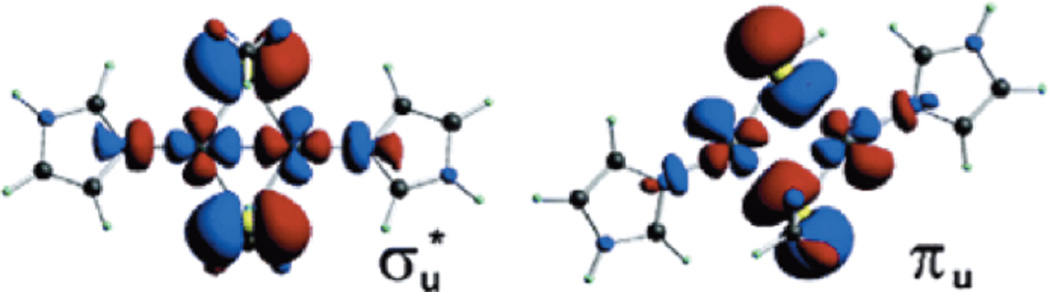
DFT optimized ground state wavefunction (σu*) and low-lying excited state wavefunction (πu) of CuA modeled as [Cu2(SCH3)(imz)2]+ (B3LYP/TZVP(Cu,S)/6-31G*). (Reprinted with permission from Ref. . Copyright 2003 American Chemical Society.)
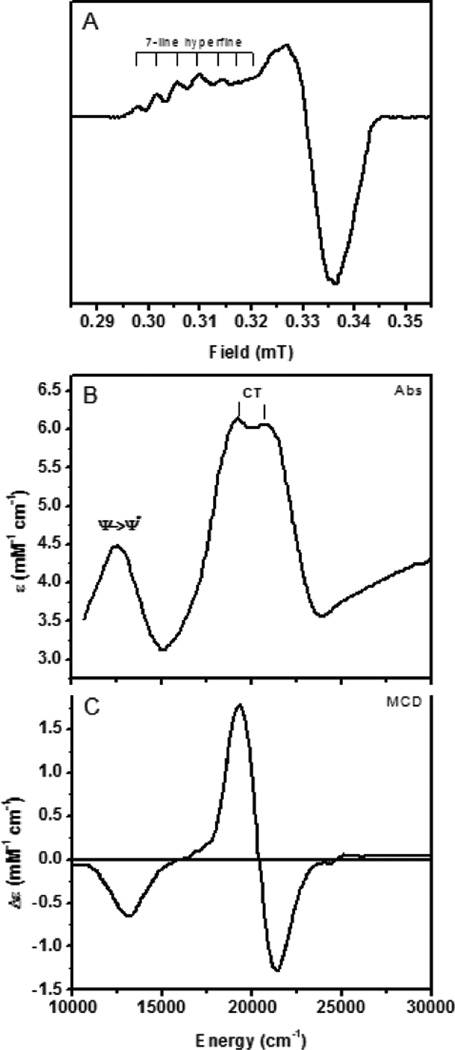
Spectral features of CuA from the N2OR V variant of PsN2OR (lacking the CuZ cluster). A) 77 K EPR spectrum. B) Room temperature absorption spectrum. C) Low temperature MCD spectrum.
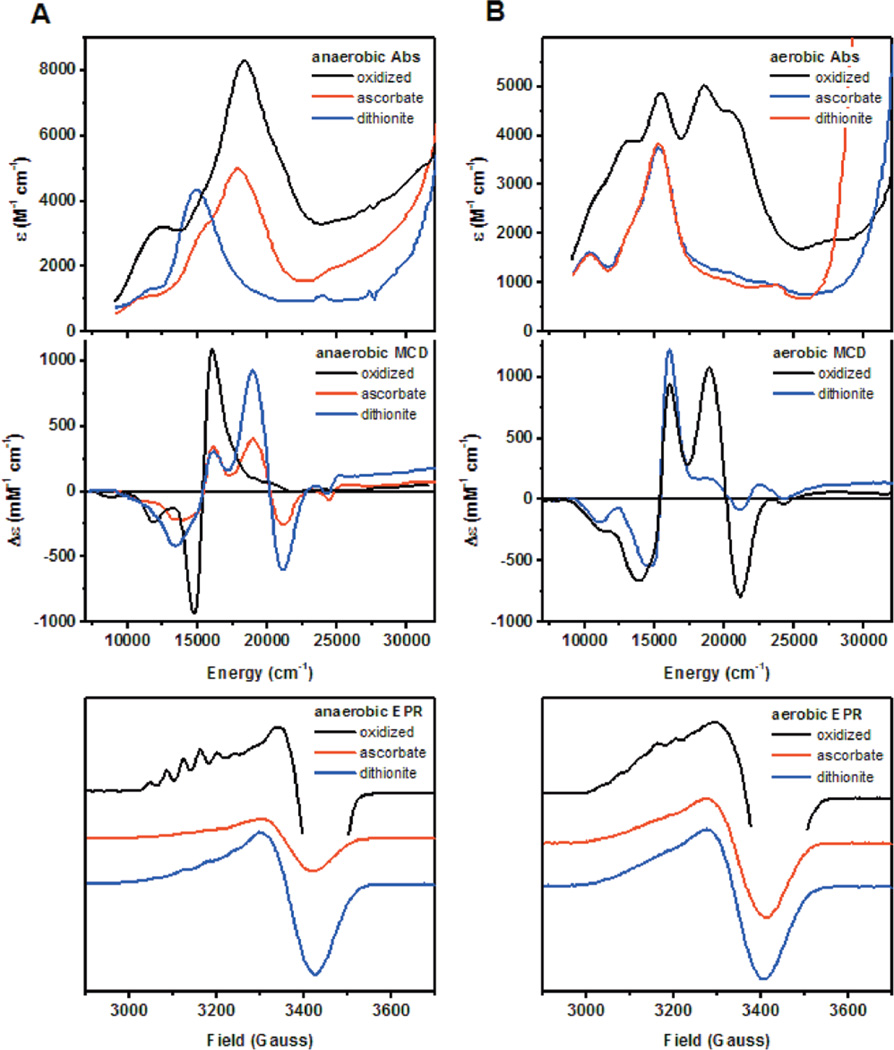
Spectroscopic comparison of anaerobically and aerobically purified PsN2OR. A) Room temperature absorption, low temperature MCD (7T, 5K), and low temperature EPR (77 K) of anaerobically isolated N2OR in the fully oxidized state (black), ascorbate reduced state (red) and dithionite-reduced state (blue). B) Room temperature absorption, low temperature MCD (7T, 5K), and low temperature EPR (77 K) of aerobically isolated N2OR in the fully oxidized state (black), ascorbate reduced state (red) and dithionite-reduced state (blue).
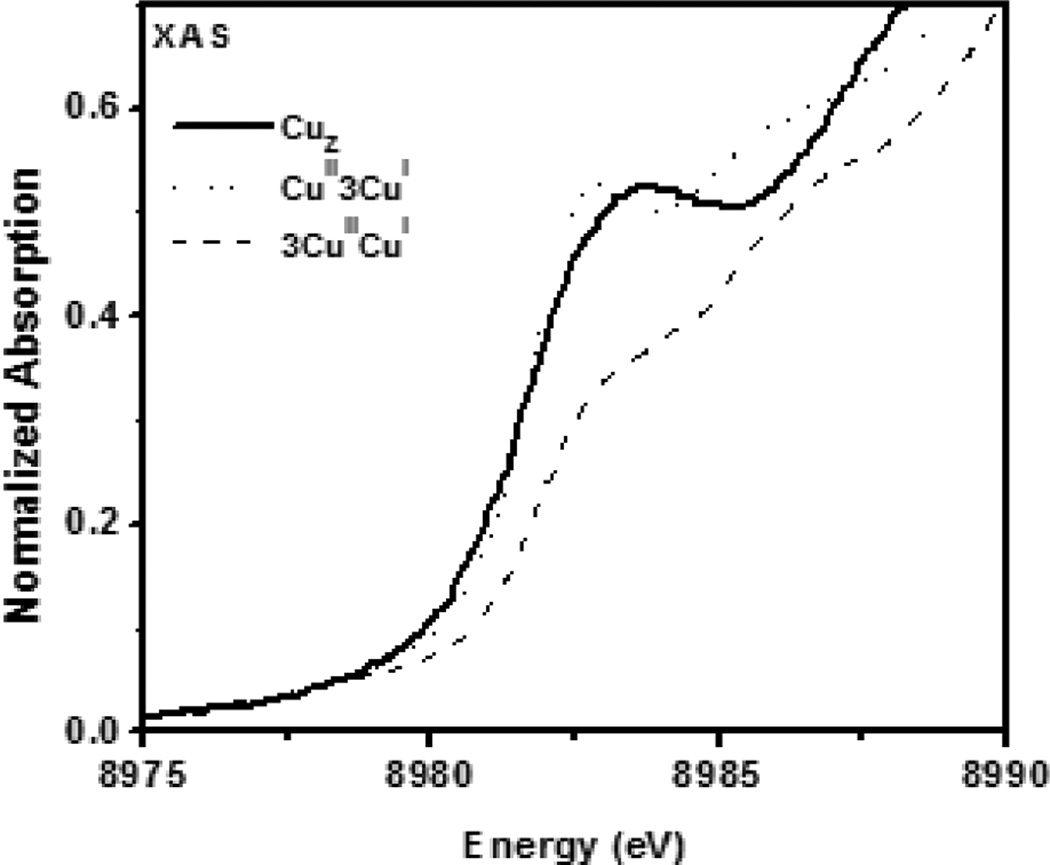
Copper K-edge X-ray absorption spectrum of N2OR, with fits predicted for a 3CuIICuI site (dashed) and a CuII3CuI site (dotted).

A) 10 K absorption spectrum of 1-hole CuZ* from PnN2OR. B) MCD spectrum of 1-hole CuZ* from PnN2OR (+7T, 5K).
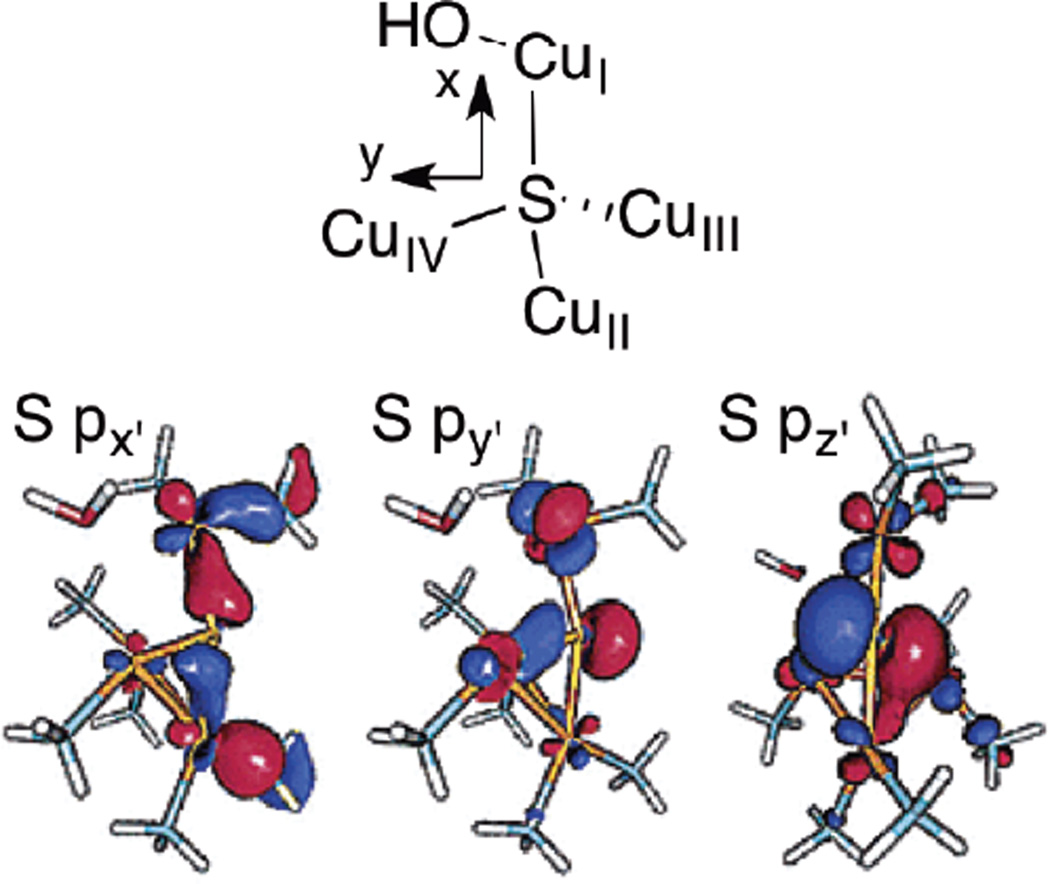
Orientation of the S p orbitals in CuZ*. Selected MOs from a DFT calculation on an early model of the CuZ* site (BP86 38%HF, 6-311G*/6-31G*). (Reprinted with permission from Ref. . Copyright 2002 American Chemical Society.)
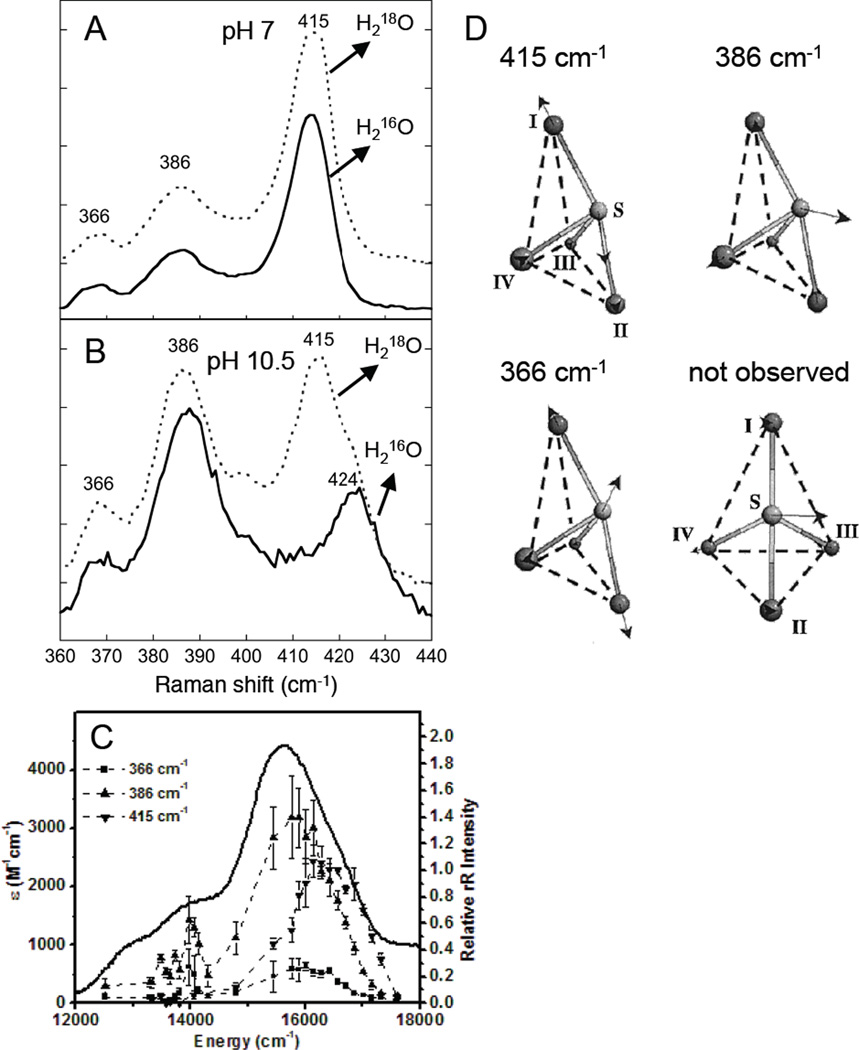
Resonance Raman spectrum of 1-hole CuZ* with pH and H2O18 dependence. A) Resonance raman spectrum of 1-hole CuZ* from PnN2OR at pH 7 (77 K, 629 nm excitation). B) Resonance raman spectrum at pH 10.5 (77 K, 629 nm excitation). C) Excitation profiles of the three resonance enhanced vibrations of 1-hole CuZ* profiled at pH 7, revealing three S to Cu charge transfer transitions (5, 6, 7). D) Normal modes of the CuZ * core assigned by normal coordinate analysis. (Reprinted with permission from Ref. . Copyright 2002 American Chemical Society.)
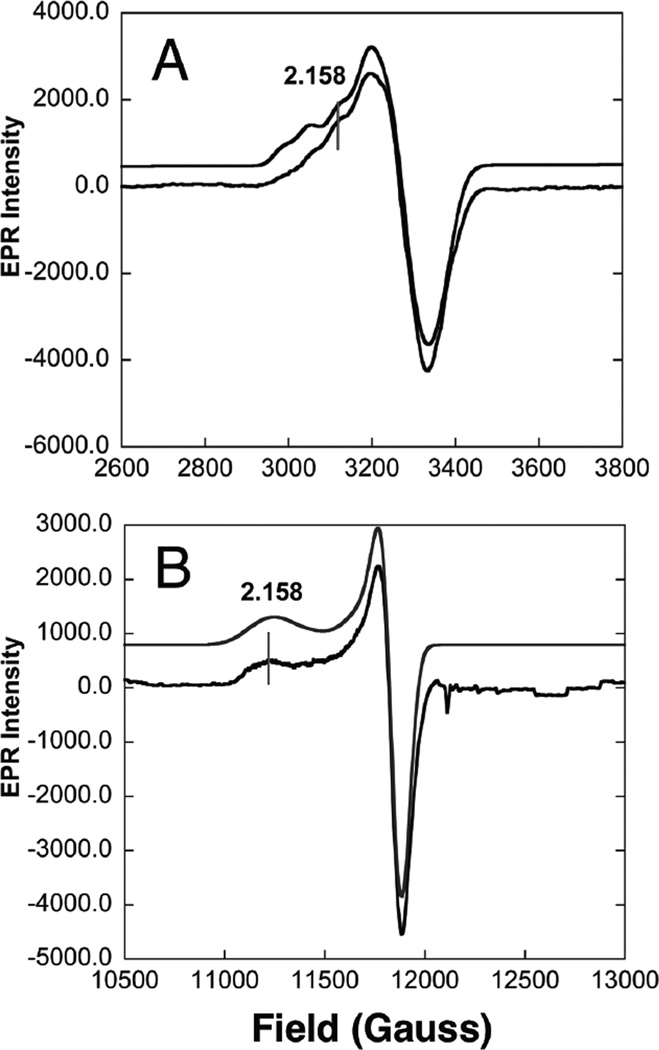
EPR spectra of 1-hole CuZ* from PnN2OR. A) X-band EPR at pH 7 and 77 K (simulated spectrum top, experimental bottom). B) Q-band EPR at pH 7 and 77 K (simulation top, experimental bottom). (Reprinted with permission from Ref. . Copyright 2007 American Chemical Society.)
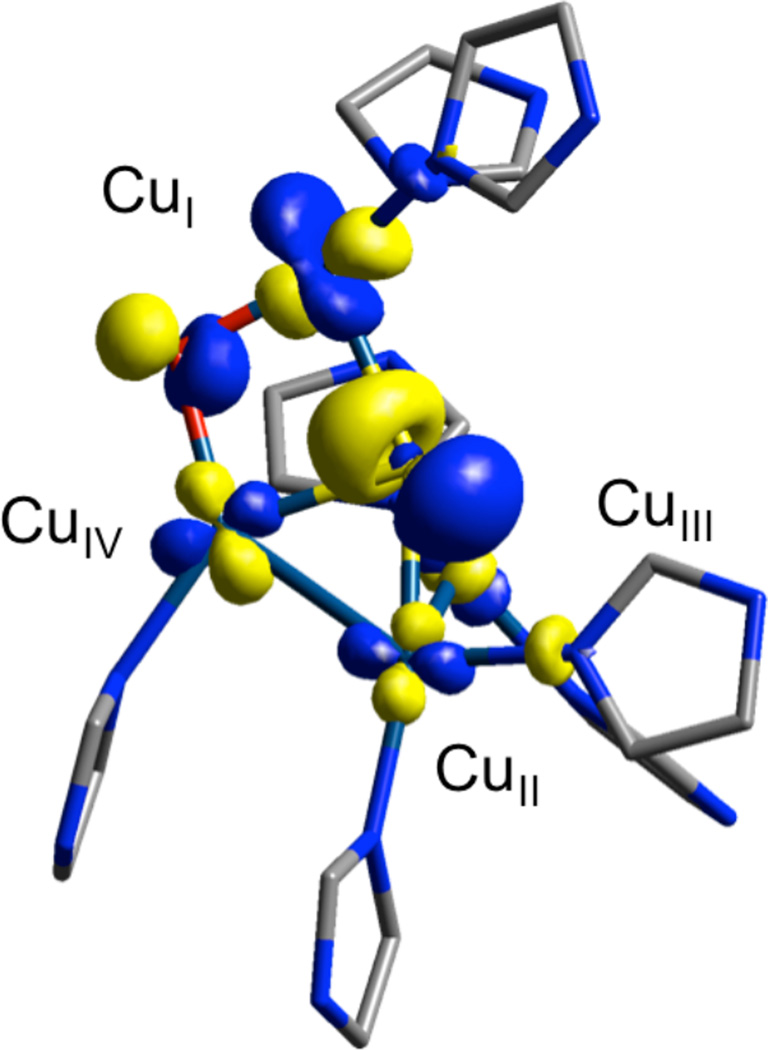
Lowest unoccupied molecular orbital of 1-hole CuZ*, labeled with Mulliken Atomic Spin Density for core atoms (B3LYP/6-311++G** on Cu4SO/6-31G* on remaining atoms).
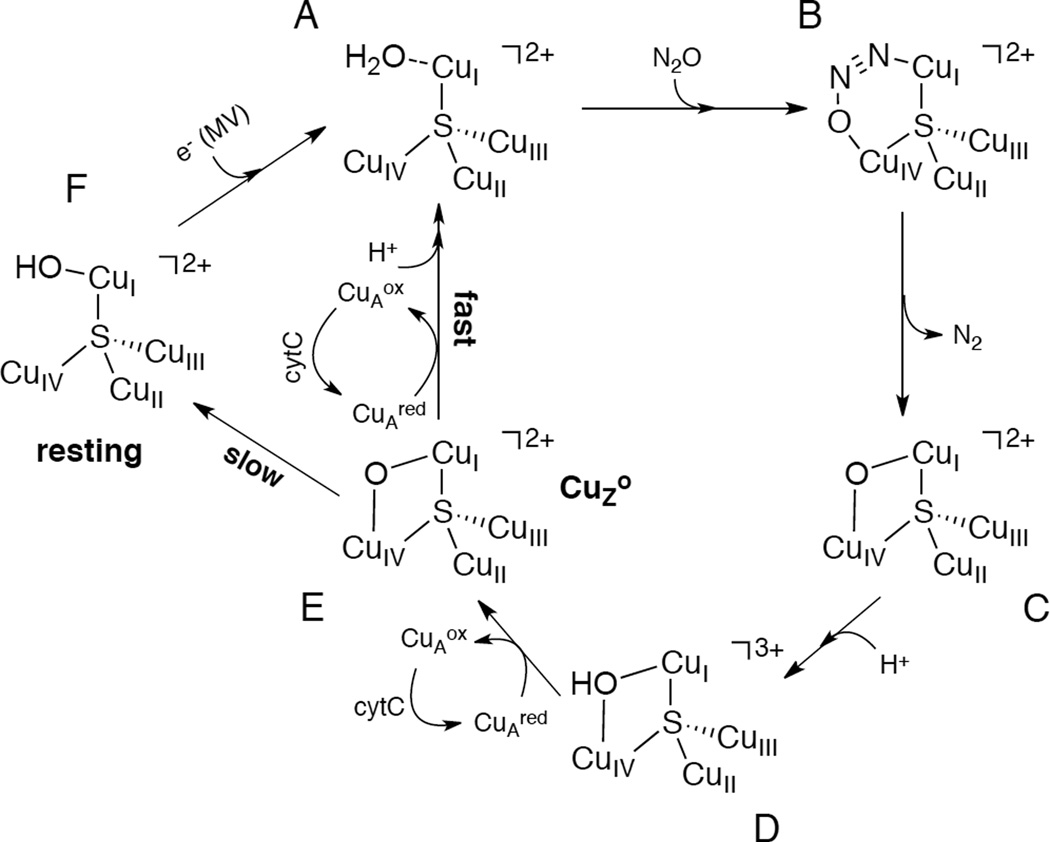
Proposed molecular mechanism for N2O reduction by CuZ* containing N2OR. MV abbreviates methyl viologen.

Computationally predicted geometry and electronic structure of N2O binding to fully reduced CuZ*. A) Optimized geometry of the lowest energy structure of N2O bound to 4CuI CuZ* (BP86, 6-311G*). B) LUMO of the N2O complex. (Reprinted with permission from Ref. . Copyright 2006 American Chemical Society.)
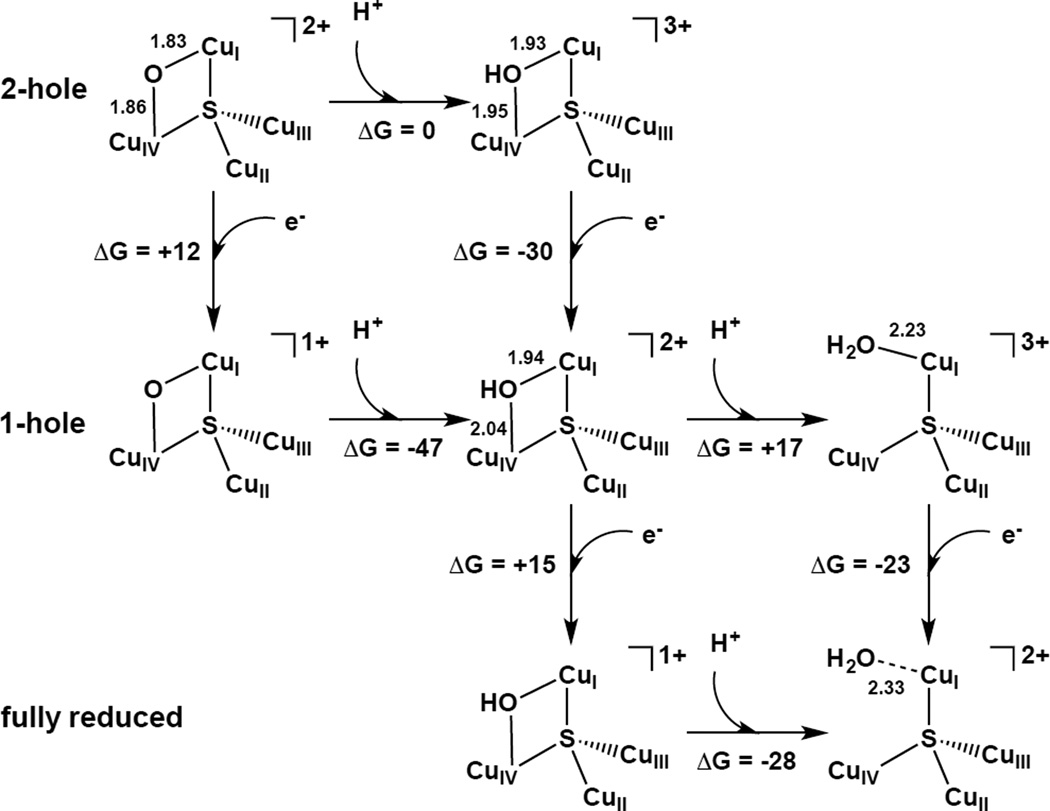
Computational evaluation of sequential protonation and reduction steps to reduce 2-hole oxo-bridged CuZ* to fully reduced aquo-CuZ* (B3LYP/6-311++G** on Cu4SL/6-31G* otherwise).

(A) Reaction of cellulose chain opening by the polysaccharide monooxygenases, via H-atom abstraction from the 1 position, as proposed by Phillips et al. (B) End-on bound superoxide structure of PMO-2 from Neurospora crassa (pdb: 4EIR). Gold sphere: Cu, Red spheres: oxygen. Second sphere residues Y168 and Q166 (<4Å from the Cu) are included
References
-
- Randall DW, Gamelin DR, LaCroix LB, Solomon EI. JBIC. 2000;5:16. - PubMed
-
- Solomon EI, Szilagyi RK, DeBeer George S, Basumallick L. Chem. Rev. 2004;104:419. - PubMed
-
- Lu Y. In: Biocoordination Chemistry, Comp. Chem. II: From Biology to Nanotech. McCleverty JA, Meyer TJ, Que L, Tolman WB, editors. Vol. 8. Oxford: Elsevier; 2004. pp. 91–122.
-
- Solomon EI, Hadt RG. Coordination Chemistry Reviews. 2011;255:774.
-
- Sawyer DT. Oxygen Chemistry. Oxford: Oxford University Press; 1991.
Publication types
MeSH terms
Substances
Grants and funding
LinkOut - more resources
Full Text Sources
Other Literature Sources
