

The marine diversity spectrum
- PMID: 24588547
- PMCID: PMC4286008
- DOI: 10.1111/1365-2656.12194
The marine diversity spectrum
Abstract
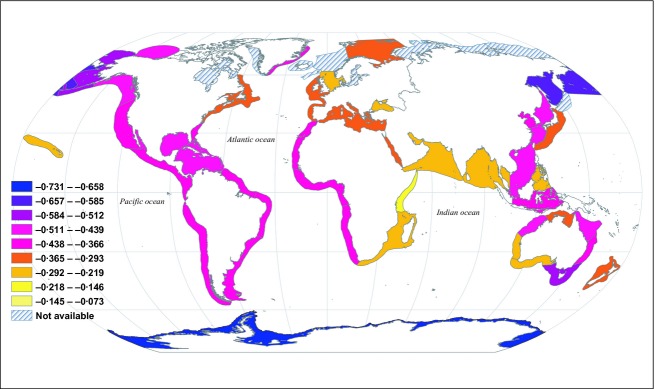
Distributions of species body sizes within a taxonomic group, for example, mammals, are widely studied and important because they help illuminate the evolutionary processes that produced these distributions. Distributions of the sizes of species within an assemblage delineated by geography instead of taxonomy (all the species in a region regardless of clade) are much less studied but are equally important and will illuminate a different set of ecological and evolutionary processes. We develop and test a mechanistic model of how diversity varies with body mass in marine ecosystems. The model predicts the form of the 'diversity spectrum', which quantifies the distribution of species' asymptotic body masses, is a species analogue of the classic size spectrum of individuals, and which we have found to be a new and widely applicable description of diversity patterns. The marine diversity spectrum is predicted to be approximately linear across an asymptotic mass range spanning seven orders of magnitude. Slope -0.5 is predicted for the global marine diversity spectrum for all combined pelagic zones of continental shelf seas, and slopes for large regions are predicted to lie between -0.5 and -0.1. Slopes of -0.5 and -0.1 represent markedly different communities: a slope of -0.5 depicts a 10-fold reduction in diversity for every 100-fold increase in asymptotic mass; a slope of -0.1 depicts a 1.6-fold reduction. Steeper slopes are predicted for larger or colder regions, meaning fewer large species per small species for such regions. Predictions were largely validated by a global empirical analysis. Results explain for the first time a new and widespread phenomenon of biodiversity. Results have implications for estimating numbers of species of small asymptotic mass, where taxonomic inventories are far from complete. Results show that the relationship between diversity and body mass can be explained from the dependence of predation behaviour, dispersal, and life history on body mass, and a neutral assumption about speciation and extinction.
Keywords: biodiversity; body mass; community; neutral theory; power law; size spectrum.
© 2014 The Authors. Journal of Animal Ecology published by John Wiley & Sons Ltd on behalf of British Ecological Society.
Figures
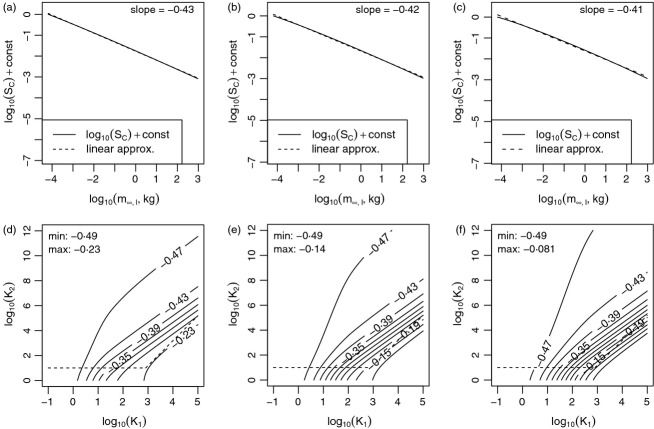
 (the dispersal distance scaling exponent). Examples of predicted regional diversity spectra (a–c) were close to linear. These panels show the log10 number of species in the region R (i.e. SC(m∞,l, αm∞,l)) plotted for lower-bound asymptotic mass m∞,l between megg and 1000 kg. SC is computed using eqn 4. K1 = 102·5 and K2 = 104 were used for a–c;
  , 0·3 and 0·4 were used for a, d; b, e; and c, f, respectively, spanning the range selected in the section Model parameters. The relationship between log10(SC) and log10(m∞,l) was always close to linear, not just in the examples shown (see text). Panels d–f are contour plots showing slopes of log10(SC) versus log10(m∞,l) for a range of values of
  , K1, and K2. Dashed lines in d–f delineate the bounds for K1 and K2 given in the section Bounds for k1 and K2. The minimum slope and maximum slope occurring in the bounds are given, and indicate that regional diversity spectrum slopes should be between −0·5 and about −0·1 for real regions.
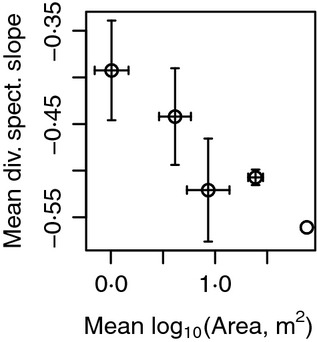
 (Fig. 3).
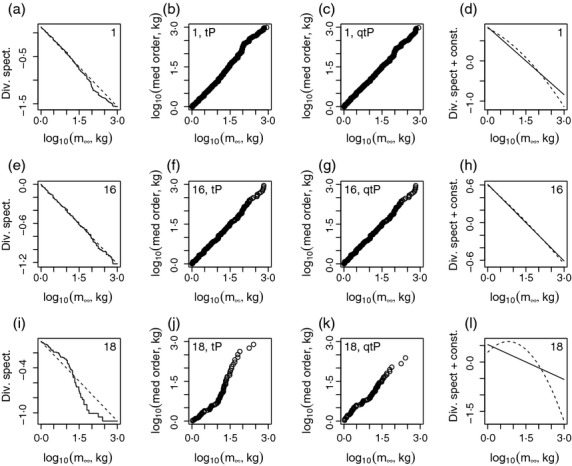
Comment in
-
Extracting order from elegant chaos: implications of the marine diversity spectrum.J Anim Ecol. 2014 Jul;83(4):741-3. doi: 10.1111/1365-2656.12242. J Anim Ecol. 2014. PMID: 26050544
References
-
- Aban I, Meerschaert M. Panorska A. Parameter estimation for the Truncated Pareto distribution. Journal of the American Statistical Association. 2006;101:270–277.
-
- Alroy J. The shifting balance of diversity among major marine animal groups. Science. 2010;329:1191–1194. - PubMed
-
- Alroy J, Aberhan M, Bottjer DJ, Foote M, Fürsich FT, Harries PJ, et al. Phanerozoic trends in the global diversity of marine invertebrates. Science. 2008;321:97–100. - PubMed
Publication types
MeSH terms
LinkOut - more resources
Full Text Sources
Other Literature Sources
Molecular Biology Databases
