Randomized Controlled Trial
. 2014 Mar 25;53(11):1724-32.
doi: 10.1021/bi5000299. Epub 2014 Mar 10.

Interactions of phosphatase and tensin homologue (PTEN) proteins with phosphatidylinositol phosphates: insights from molecular dynamics simulations of PTEN and voltage sensitive phosphatase

Affiliations
Free PMC article
Randomized Controlled Trial

Interactions of phosphatase and tensin homologue (PTEN) proteins with phosphatidylinositol phosphates: insights from molecular dynamics simulations of PTEN and voltage sensitive phosphatase

Antreas C Kalli et al. Biochemistry. .
Free PMC article

Abstract

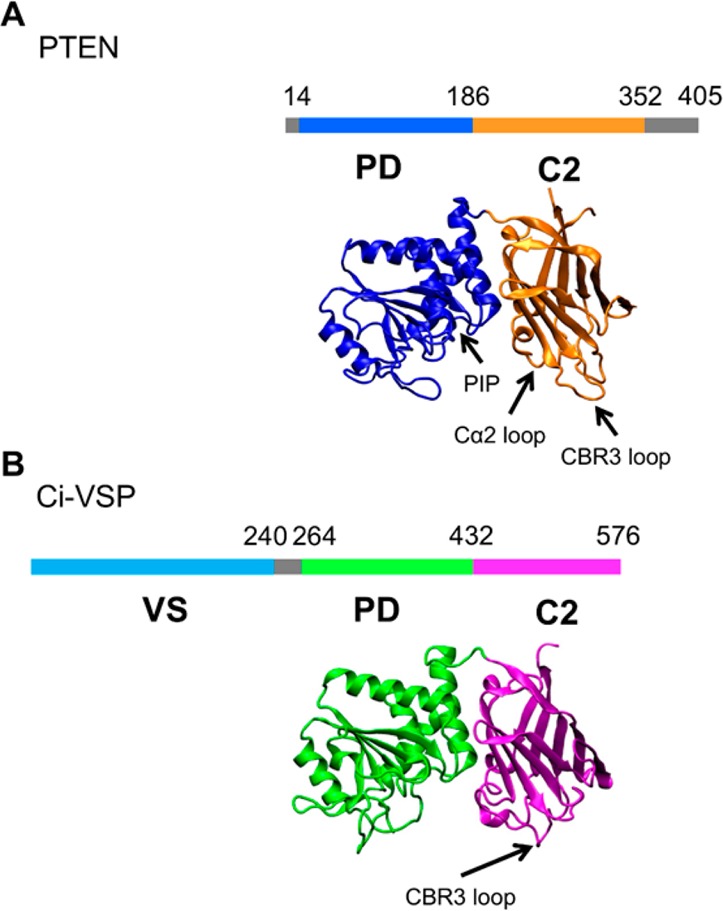
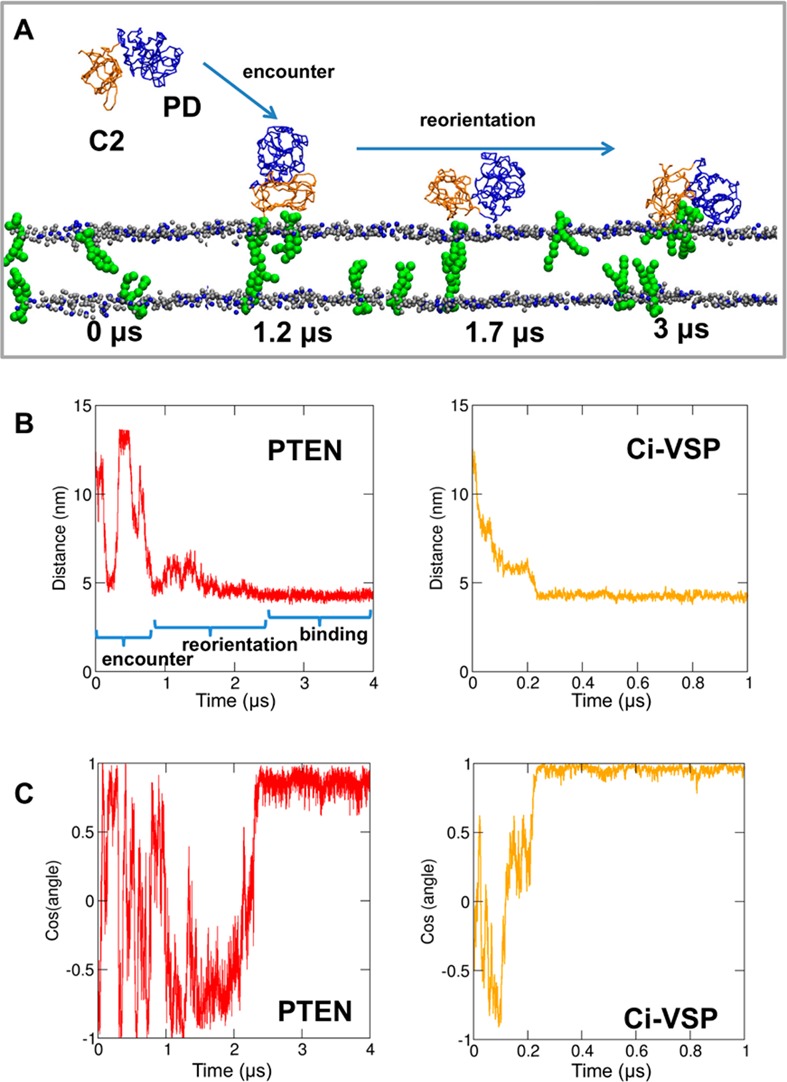
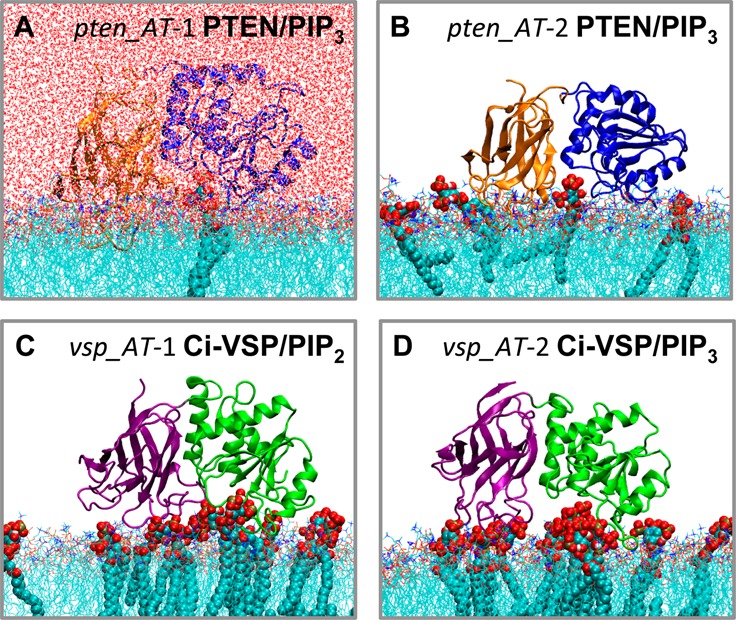
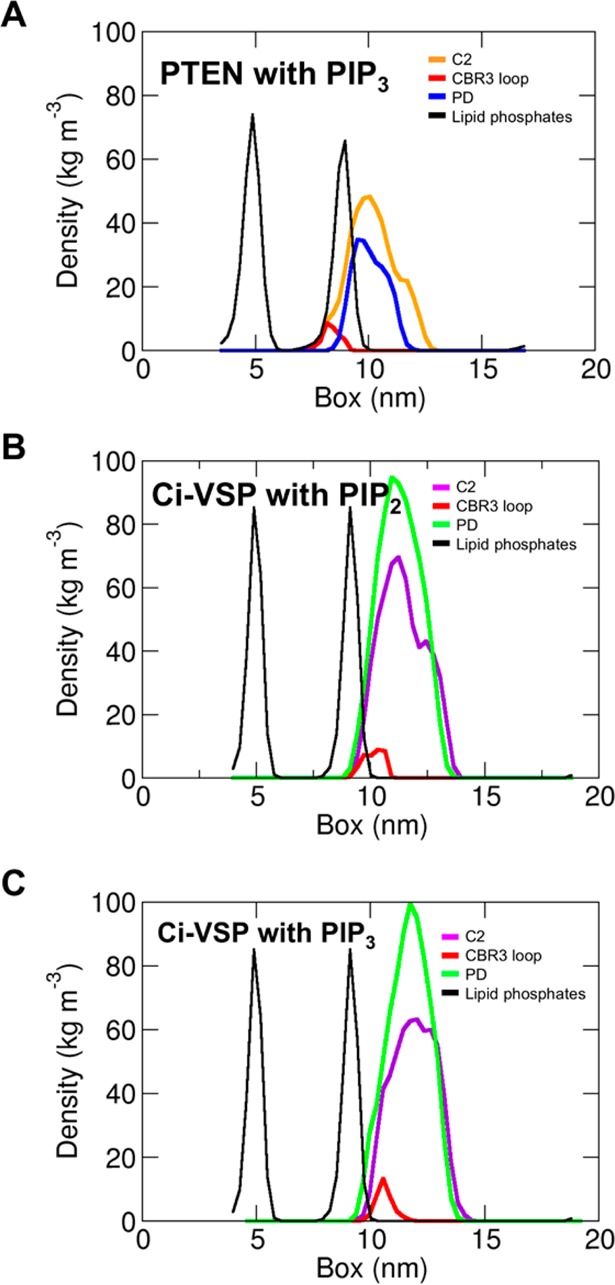
The phosphatase and tensin homologue (PTEN) and the Ciona intestinalis voltage sensitive phosphatase (Ci-VSP) are both phosphatidylinositol phosphate (PIP) phosphatases that contain a C2 domain. PTEN is a tumor suppressor protein that acts as a phosphatase on PIP3 in mammalian cell membranes. It contains two principal domains: a phosphatase domain (PD) and a C2 domain. Despite detailed structural and functional characterization, less is known about its mechanism of interaction with PIP-containing lipid bilayers. Ci-VSP consists of an N-terminal transmembrane voltage sensor domain and a C-terminal PTEN domain, which in turn contains a PD and a C2 domain. The nature of the interaction of the PTEN domain of Ci-VSP with membranes has not been well established. We have used multiscale molecular dynamics simulations to define the interaction mechanisms of PTEN and of the Ci-VSP PTEN domains with PIP-containing lipid bilayers. Our results suggest a novel mechanism of association of the PTEN with such bilayers, in which an initial electrostatics-driven encounter of the protein and bilayer is followed by reorientation of the protein to optimize its interactions with PIP molecules in the membrane. Although a PIP3 molecule binds close to the active site of PTEN, our simulations suggest a further conformational change of the protein may be required for catalytically productive binding to occur. Ci-VSP interacted with membranes in an orientation comparable to that of PTEN but bound directly to PIP-containing membranes without a subsequent reorientation step. Again, PIP3 bound close to the active site of the Ci-VSP PD, but not in a catalytically productive manner. Interactions of Ci-VSP with the bilayer induced clustering of PIP molecules around the protein.


Figures

Figure 1
Figure 1
Domain organization of PTEN (A) and Ci-VSP (B) showing the location of the phosphatase domain (PD) and the C2 domains, and of the voltage sensor (VS) domain in Ci-VSP. The crystal structures of the two proteins used in the simulations are also shown: Protein Data Bank (PDB) entry 1D5R for PTEN and PDB entry 3V0H for Ci-VSP.
Figure 2
Figure 2
(A) Snapshots of a selected simulation (pten_away-2 in Table 1) with the PTEN molecule displaced from a bilayer that contained two PIP3 molecules (green) in each leaflet. Simulation snapshots are shown at 0, 1.2, 1.7, and 3 μs. The blue arrows indicate the process of initial encounter of the protein and bilayer followed by reorientation of the protein at the bilayer surface. All the systems shown in this figure were fully solvated with CG water particles. However, for the sake of clarity, these are not shown. (B and C) Progress of selected CG-MD simulations of PTEN and Ci-VSP with PIP3-containing bilayers [simulations pten_away-2 and vsp_away-4 (Tables 1 and 2)]. Panel B shows the distance between the center of mass of the protein and the center of mass of the bilayer as a function of time. Panel C shows the cosine of the angle between the protein plane (as defined by the protein’s principal z axis) and the bilayer plane. This angle is equal to 0° (and hence the cosine is equal to 1) if the protein is in the “correct” binding orientation (see the text for more information).
Figure 3
Figure 3
(A) Seven positions in which the PIP3 molecules were placed in the pten_bound simulations (see Table 1). PTEN was placed in the center of the bilayer. POPC and POPS headgroups are shown as gray spheres. (B) Routes from two of the simulations (in one of which the PIP3 lipids reached the PTEN catalytic side via the C2 domain and one via the PD) are colored red and brown. (C) Snapshots from one of the simulations (red in panel B) are shown at 0, 0.2, 0.4, and 1 μs. Note that the systems shown in the figure were fully solvated with CG waters (omitted for the sake of clarity).
Figure 4
Figure 4
Snapshots of the lipid-bound PTEN and Ci-VSP domains, from the end of all-atom simulations in the presence of PIP2 or PIP3 lipids. (A and B) Snapshots from simulations pten_AT-1 and pten_AT-2, respectively. The PTEN C2 domain is colored orange and the PD blue. (C and D) Snapshots from simulations vsp_AT-1 and vsp_AT-2, respectively. The Ci-VSP C2 domain is colored green and the PD purple. PIP lipids are shown in VDW format. Note that the water molecules included in the simulation box are shown only for the pten_AT-1 simulation system. For the other systems, the waters were included in the simulation (see Methods), but for the sake of clarity, they are not shown in this figure.
Figure 5
Figure 5
(A) Comparison of the AT-MD simulation (pten_AT-1) and crystal structure in terms of the location of PIP3 and tartrate relative to the PTEN active site defined by catalytic residues C124 and R130. (B) Comparison of the PTEN structure of the AT-MD simulation in panel A (red; pten_AT-1) and the crystal structure (blue) reveals a rotation of ∼10° of the PD relative to the C2 domain (the two structures are superimposed via their C2 domains).
Figure 6
Figure 6
Density profiles along the membrane normal for the C2 domain (orange for PTEN to purple for Ci-VSP), the PD (blue for PTEN to green for Ci-VSP), and the C2 CBR3 loop region (red; residues 261–266 for PTEN to residues 516–524 for Ci-VSP) relative to the positions of the lipid (POPC and POPS) phosphate groups (black), from the (A) pten_AT-1, (B) vsp_AT-1, and (C) vsp_AT-2 simulations.

References

    1. Golebiewska U.; Nyako M.; Woturski W.; Zaitseva I.; McLaughlin S. (2008) Diffusion coefficient of fluorescent phosphatidylinositol 4,5-bisphosphate in the plasma membrane of cells. Mol. Biol. Cell 19, 1663–1669. - PMC - PubMed
    1. Kölsch V.; Charest P. G.; Firtel R. A. (2008) The regulation of cell motility and chemotaxis by phospholipid signaling. J. Cell Sci. 121, 551–559. - PMC - PubMed
    1. Swaney K. F.; Huang C.-H.; Devreotes P. N. (2010) Eukaryotic Chemotaxis: A Network of Signaling Pathways Controls Motility, Directional Sensing, and Polarity. Annu. Rev. Biophys. 39, 265–289. - PMC - PubMed
    1. Leonard T. A.; Hurley J. H. (2011) Regulation of protein kinases by lipids. Curr. Opin. Struct. Biol. 21, 785–791. - PMC - PubMed
    1. Raimondi C.; Falasca M. (2012) Phosphoinositides signalling in cancer: Focus on PI3K and PLC. Adv. Biol. Regul. 52, 166–182. - PubMed

Publication types

MeSH terms

Substances

Associated data