

The current state of drug discovery and a potential role for NMR metabolomics
- PMID: 24588729
- PMCID: PMC4324437
- DOI: 10.1021/jm401803b
The current state of drug discovery and a potential role for NMR metabolomics
Abstract
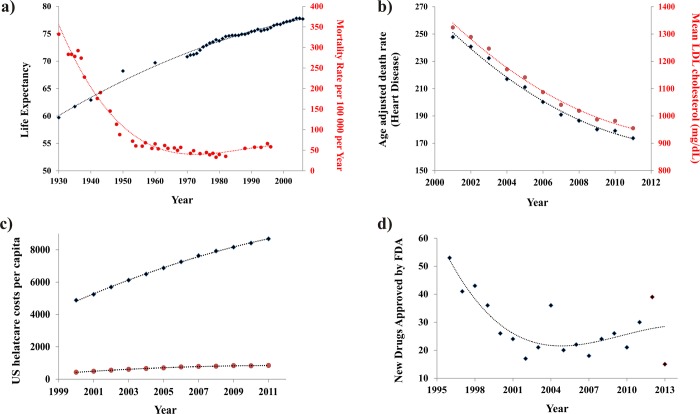
The pharmaceutical industry has significantly contributed to improving human health. Drugs have been attributed to both increasing life expectancy and decreasing health care costs. Unfortunately, there has been a recent decline in the creativity and productivity of the pharmaceutical industry. This is a complex issue with many contributing factors resulting from the numerous mergers, increase in out-sourcing, and the heavy dependency on high-throughput screening (HTS). While a simple solution to such a complex problem is unrealistic and highly unlikely, the inclusion of metabolomics as a routine component of the drug discovery process may provide some solutions to these problems. Specifically, as the binding affinity of a chemical lead is evolved during the iterative structure-based drug design process, metabolomics can provide feedback on the selectivity and the in vivo mechanism of action. Similarly, metabolomics can be used to evaluate and validate HTS leads. In effect, metabolomics can be used to eliminate compounds with potential efficacy and side effect problems while prioritizing well-behaved leads with druglike characteristics.
Figures
Similar articles
-
The emergence of metabolomics as a key discipline in the drug discovery process.Drug Discov Today Technol. 2015 Jun;13:19-24. doi: 10.1016/j.ddtec.2015.01.006. Epub 2015 Feb 28. Drug Discov Today Technol. 2015. PMID: 26190679 Review.
-
Current NMR Techniques for Structure-Based Drug Discovery.Molecules. 2018 Jan 12;23(1):148. doi: 10.3390/molecules23010148. Molecules. 2018. PMID: 29329228 Free PMC article. Review.
-
Open access high throughput drug discovery in the public domain: a Mount Everest in the making.Curr Pharm Biotechnol. 2010 Nov;11(7):764-78. doi: 10.2174/138920110792927757. Curr Pharm Biotechnol. 2010. PMID: 20809896 Free PMC article. Review.
-
NMR Metabolomics Protocols for Drug Discovery.Methods Mol Biol. 2019;2037:265-311. doi: 10.1007/978-1-4939-9690-2_16. Methods Mol Biol. 2019. PMID: 31463851 Free PMC article.
-
Application of NMR and molecular docking in structure-based drug discovery.Top Curr Chem. 2012;326:1-34. doi: 10.1007/128_2011_213. Top Curr Chem. 2012. PMID: 21915777 Free PMC article. Review.
Cited by
-
Recent Advances in NMR-Based Metabolomics.Anal Chem. 2017 Jan 3;89(1):490-510. doi: 10.1021/acs.analchem.6b04420. Epub 2016 Dec 2. Anal Chem. 2017. PMID: 28105846 Free PMC article. Review. No abstract available.
-
Metabolomic study of soft corals from the Colombian Caribbean: PSYCHE and 1H-NMR comparative analysis.Sci Rep. 2020 Mar 25;10(1):5417. doi: 10.1038/s41598-020-62413-0. Sci Rep. 2020. PMID: 32214197 Free PMC article.
-
Can NMR solve some significant challenges in metabolomics?J Magn Reson. 2015 Nov;260:144-60. doi: 10.1016/j.jmr.2015.07.014. Epub 2015 Aug 18. J Magn Reson. 2015. PMID: 26476597 Free PMC article. Review.
-
Application of metabolomics to drug discovery and understanding the mechanisms of action of medicinal plants with anti-tuberculosis activity.Clin Transl Med. 2018 Oct 1;7(1):29. doi: 10.1186/s40169-018-0208-3. Clin Transl Med. 2018. PMID: 30270413 Free PMC article. Review.
-
Nuclear Magnetic Resonance Spectroscopy in Clinical Metabolomics and Personalized Medicine: Current Challenges and Perspectives.Front Mol Biosci. 2021 Sep 20;8:698337. doi: 10.3389/fmolb.2021.698337. eCollection 2021. Front Mol Biosci. 2021. PMID: 34616770 Free PMC article. Review.
References
-
- Liu L.; Cline R. R.; Schondelmeyer S. W.; Schommer J. C. Pharmaceutical expenditures as a correlate of population health in industrialized nations. Ann. Pharmacother. 2008, 42, 368–374. - PubMed
-
- Lichtenberg F. R. The impact of new drug launches on longevity: evidence from longitudinal, disease-level data from 52 countries, 1982–2001. Int. J. Health Care Finance Econ. 2005, 5, 47–73. - PubMed
-
- Lakdawalla D. N.; Sun E. C.; Jena A. B.; Reyes C. M.; Goldman D. P.; Philipson T. J. An economic evaluation of the war on cancer. J. Health Econ. 2010, 29, 333–346. - PubMed
-
- Lichtenberg F. R.The Expanding Pharmaceutical Arsenal in the War on Cancer; National Bureau of Economic Research: Cambridge, MA, 2004; Vol. I, Feb 2004.
-
- Hoyert D. L.; Xu J. Deaths: Preliminary Data for 2011. Natl. Vital Stat. Rep. 2012, 61, 1–52. - PubMed
Publication types
MeSH terms
Substances
Grants and funding
LinkOut - more resources
Full Text Sources
Other Literature Sources
Medical
