. 2014 May;10(5):766-84.
doi: 10.4161/auto.27954. Epub 2014 Feb 20.

Hepatitis C virus core protein activates autophagy through EIF2AK3 and ATF6 UPR pathway-mediated MAP1LC3B and ATG12 expression

Affiliations

Hepatitis C virus core protein activates autophagy through EIF2AK3 and ATF6 UPR pathway-mediated MAP1LC3B and ATG12 expression

Ji Wang et al. Autophagy. 2014 May.

Abstract

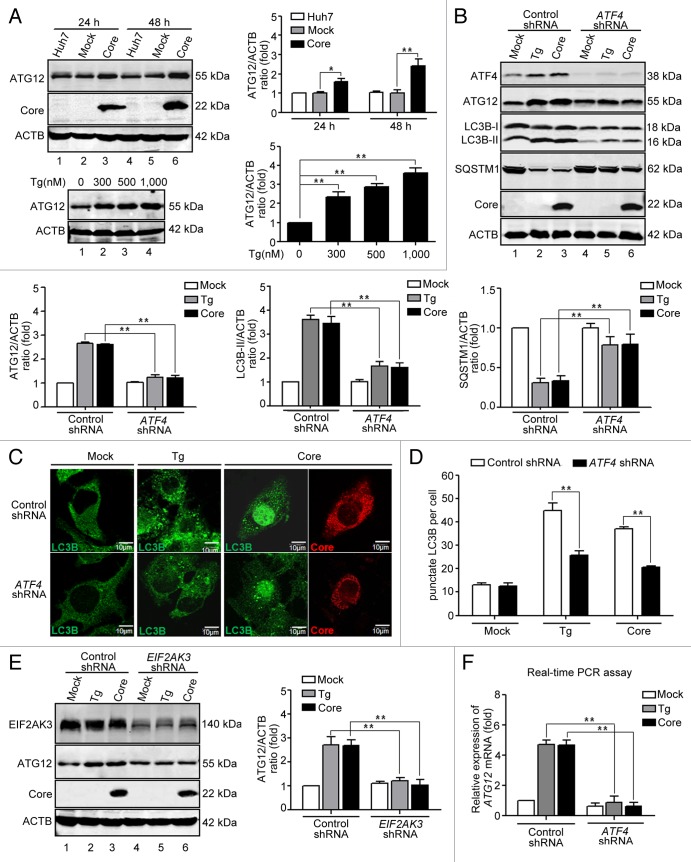
HCV infection induces autophagy, but how this occurs is unclear. Here, we report the induction of autophagy by the structural HCV core protein and subsequent endoplasmic reticular (ER) stress in Huh7 hepatoma cells. During ER stress, both the EIF2AK3 and ATF6 pathways of the unfolded protein response (UPR) were activated by HCV core protein. Then, these pathways upregulated transcription factors ATF4 and DDIT3. The ERN1-XBP1 pathway was not activated. Through ATF4 in the EIF2AK3 pathway, the autophagy gene ATG12 was upregulated. DDIT3 upregulated the transcription of autophagy gene MAP1LC3B (LC3B) by directly binding to the -253 to -99 base region of the LC3B promoter, contributing to the development of autophagy. Collectively, these data suggest not only a novel role for the HCV core protein in autophagy but also offer new insight into detailed molecular mechanisms with respect to HCV-induced autophagy, specifically how downstream UPR molecules regulate key autophagic gene expression.

Keywords: ER stress; UPR; autophagy; core; hepatitis C virus.


Figures

None
Figure 1. Multiple HCV proteins induce autophagy in Huh7 cells. (A) Huh7 cells were transfected with empty vectors or various plasmids expressing Flag-tagged HCV core, NS2, NS3, NS3/4A, NS4B, and NS5B proteins. At 48 h post-transfection, cells were harvested and western blotting was performed. Blots are representative of the 3 independent experiments. ACTB was used as sample-loading control. Densitometric LC3B-II/ACTB and SQSTM1/ACTB ratios from at least 3 independent experiments are shown. The value of Huh7 without any treatment was set at 1 for each experiment (**P < 0.01). (B) At 48 h post-transfection, the cells were fixed and analyzed by indirect immunofluorescence using anti-LC3B and anti-Flag antibodies. Patterns of LC3B expression in mock- and HCV protein-transfected cells were visualized with laser confocal microscopy. LC3B (green), HCV proteins (red) staining is shown. Scale bars: 10 μm. (C) Quantitative presentation of punctate LC3B per cell in untreated, mock- and HCV protein-transfected cells.
None
Figure 2. HCV core protein-induced autophagy is further confirmed in Huh7 cells. (A) Huh7 cells were transfected with HCV core protein expression plasmids (Core) or empty vectors (Mock). At different time points (12, 24, 26, and 48 h) post-transfection, cells were harvested and western blotting was performed. (B) Huh7 cells were transfected with various amounts (0.5, 1, 2, and 4 μg) of HCV core protein expression plasmids or empty vectors. At 48 h post-transfection, cells were harvested and western blotting was performed. (A and B) Blots are representative of the 3 independent experiments. ACTB was used as sample-loading control. Densitometric LC3B-II/ACTB and SQSTM1/ACTB ratios from at least 3 independent experiments are shown. The value of Huh7 without any treatment was set at 1 for each experiment (*P < 0.05, **P < 0.01). (C) Huh7 cells were transfected with HCV core protein expression plasmids or empty vectors for 48 h and examined under immunotransmission electron microscopy. Black arrow: autophagosome or autolysosome; White arrow: immunolabeled core protein.
None
Figure 3. HCV core protein-induced autophagy is a complete process. (A) Huh7 cells were transfected with HCV core protein expression plasmids or empty vectors for 36 h and then treated with (+) or without (–) BafA1 (10 nM) for 12 h. Cells were harvested and analyzed by western blotting using the indicated antibodies. Blots are representative of 3 independent experiments. ACTB was used as a sample-loading control. Densitometric LC3B-II/ACTB and SQSTM1/ACTB ratios from at least 3 independent experiments are shown. The value of Huh7 without any treatment was set at 1 for each experiment. aPercentage increased by BafA1 treatment (**P < 0.01). (B) Huh7 cells were cotransfected with either mTagRFP-mWasabi-LC3B plasmids and core protein expression plasmids or empty vectors for 36 h and cells were treated with (+) or without (–) BafA1 (10 nM) for additional 12 h. Cells were fixed and assessed by indirect immunofluorescence analysis using an anti-core antibody. Cells were visualized under laser confocal microscopy. Yellow punctate structures indicate autophagosomes; red punctate structures indicate autolysosomes; and blue punctate structures indicate core protein. Scale bars: 10 μm.
None
Figure 4. HCV core protein activates EIF2AK3 and ATF6 pathways of UPR. (A) The location of HCV core protein in the ER lumen of HCV core protein-transfected cells and HCVcc-infected cells. Huh7 cells were transfected with core protein expression plasmids or infected with 10 MOI of HCVcc. At 48 h post-transfection or 72 h post-infection, the cells were fixed and assessed by indirect immunofluorescence analysis using anti-core protein and anti-CANX (ER marker) antibodies, and then imaged by laser confocal microscopy. ER marker (green), staining of HCV core protein (red), DAPI staining of nuclei (blue) is shown. Scale bars: 10 μm. (B) HCV core protein activated EIF2AK3 and ATF6 pathways. Huh7 cells were transfected with core protein expression plasmids or empty vectors. Cells treated with 300 nM thapsigargin (Tg, which rapidly elicits ER stress) and 10 mM DL-dithiothreitol (DTT, a known ER stress-inducer) for 16 h before harvesting were used as positive control. At 48 h post-transfection, cells were harvested and expression of HSPA5, EIF2AK3 (p-Thr980), EIF2AK3, EIF2S1 (p-Ser51), EIF2S1, ATF4, DDIT3, and ATF6 were analyzed by western blots using the indicated antibodies. Blots are representative of 3 independent experiments. ACTB was used as a sample-loading control. Densitometric ATF4/ACTB and DDIT3/ACTB ratios from at least 3 independent experiments are shown. The value of Huh7 without any treatment was set at 1 for each experiment (*P < 0.05, **P < 0.01).
None
Figure 5. HCV core protein does not activate the ERN1-XBP1 pathway of UPR. (A) Huh7 cells were transfected with core protein expression plasmids or empty vectors. Cells treated with 300 nM Tg or 10 mM DTT for 16 h before harvesting were used as positive controls. At 48 h post-transfection, the cells were harvested and RT-PCR was performed using XBP1-specific primers. Then the PCR products were digested by Pst I, the unspliced XBP1 products were digested into 295 bp and 147 bp fragments, while the 416 bp spliced XBP1 products could not be digested by Pst I. XBP1(u) represents the unspliced XBP1 PCR products, and XBP1(s) represents the spliced XBP1 PCR products. ACTB was used as the loading control. (B) The cells treated as (A) were analyzed by western blotting using the specific anti-XBP1 antibody to detect the unspliced and spliced XBP1 proteins. (C) Frame diagrams of the reporter plasmid designated Flag-XBP1-FLuc encoding an N-terminal Flag-tagged XBP1 along with the C terminus fused to firefly luciferase (FLuc) at the second ORF of XBP1. (D) Huh7 cells were transfected with core protein expression plasmids or empty vectors along with Flag-XBP1-FLuc and Renilla luciferase pRL-SV40 plasmids, and the cells treated with 300 nM Tg or 10 mM DTT for 16 h before harvesting were used as positive controls. At 48 h post-transfection, the cells were harvested and lysed for measuring XBP1 mRNA splicing. The fold-change is expressed relative to mock-transfected control from at least 3 independent experiments (**P < 0.01). (E) Expression of firefly luciferase (FLuc) and core protein in (D) were analyzed by western blotting using the indicated antibodies. (F) Huh7 cells were transfected with core protein expression plasmids or empty vectors. Cells treated for 12 h with 0.25 μM C42 (11'-deoxyverticillin A), and which exhibited phosphorylation of MAPK9/MAPK8, were used as positive controls. At 48 h post-transfection, the cells were harvested and analyzed by western blotting using the indicated antibodies to measure the phosphorylation of MAPK9/MAPK8.
None
Figure 6. HCV core protein induces autophagy by activating the EIF2AK3 and ATF6 pathways of UPR. (A and B) Huh7 cells were transfected with HCV core protein expression plasmids or empty vectors. Lentiviral shRNA against EIF2AK3 and ATF6 were added at 6 h post-transfection (MOI = 1) and incubated for 3 h. Cells treated with 300 nM Tg for 16 h were used as positive controls. At 72 h post-transfection, cells were harvested and western blotting was performed using the indicated antibodies. Blots are representative of 3 independent experiments. ACTB was used as sample-loading control. The densitometric ATF4/ACTB and DDIT3/ACTB ratios from at least 3 independent experiments are shown. The value of mock-treated cells with control shRNA was set at 1 each experiment (**P < 0.01). (C) Huh7 cells were transfected with HCV core protein expression plasmids or empty vectors. Lentiviral shRNA against EIF2AK3 and ATF6 were added alone or combined, at 6 h post-transfection (MOI = 1) and incubated for 3 h. Cells treated with 300 nM Tg for 16 h were used as positive controls. At 72 h post-transfection, cells were harvested and expression of LC3B and SQSTM1 were analyzed by western blotting. Blots are representative of 3 independent experiments. ACTB was used as sample-loading control. The densitometric LC3B-II/ACTB and SQSTM1/ACTB ratios from at least 3 independent experiments are shown. The value of mock-treated with control shRNA was set at 1 for each experiment (*P < 0.05, **P < 0.01). (D) The cells in (C) were fixed and analyzed by indirect immunofluorescence using anti-LC3B and anti-core antibodies. Patterns of LC3B expression in mock-transfected and HCV protein-transfected cells were visualized with laser confocal microscopy LC3B (green), HCV core (red) staining is shown. Scale bars: 10 μm. (E) Quantitative presentation of punctate LC3B per cell in (D).
None
Figure 7. HCV core protein upregulation of ATG12 expression depends on ATF4 of the EIF2AK3 pathway. (A) Huh7 cells were transfected with HCV core protein expression plasmids or empty vectors. At 24 and 48 h post-transfection, cells were harvested and western blotting was performed. Huh7 cells treated with 300, 500, 1,000 nM Tg for 16 h, and then western blotting was performed. Expression of ATG12 and HCV core protein was analyzed using the indicated antibodies. Blots are representative of 3 independent experiments. ACTB was used as sample-loading control. The densitometric ATG12/ACTB ratio from at least 3 independent experiments is shown. The value of Huh7 without any treatment was set at 1 for each experiment (*P < 0.05, **P < 0.01). (B) Knockdown of ATF4 inhibited expression of ATG12 and autophagy in HCV core protein-transfected cells. Huh7 cells were transfected with HCV core protein expression plasmids or empty vectors. Lentiviral shRNA against ATF4 was added 6 h post-transfection (MOI = 1) and incubated for 3 h. At 72 h post-transfection, expression of ATF4, ATG12, LC3B, SQSTM1 and HCV core protein were analyzed by western blotting using the indicated antibodies. Blots are representative of 3 independent experiments. ACTB was used as a sample-loading control. The densitometric ATG12/ACTB, LC3B-II/ACTB and SQSTM1/ACTB ratios from at least 3 independent experiments are shown. The value of mock-treated cells with control shRNA is set on 1 each experiment (**P < 0.01). (C) The cells in (B) were fixed and analyzed by indirect immunofluorescence using anti-LC3B and anti-core antibodies. Patterns of LC3B expression in mock-transfected and HCV protein-transfected cells were visualized with laser confocal microscopy. LC3B (green), HCV core (red) staining is shown. Scale bars: 10 μm. (D) Quantitative presentation of punctate LC3B per cell in (C). (E) Knockdown of EIF2AK3 decreased expression of ATG12. Huh7 cells were transfected with HCV core protein expression plasmids or empty vectors. Lentiviral shRNA against EIF2AK3 was added at 6 h post-transfection (MOI = 1) and incubated for 3 h. At 72 h post-transfection, expression of EIF2AK3, ATG12 and HCV core protein were analyzed by western blotting using the indicated antibodies. Blots are representative of 3 independent experiments. ACTB was used as a sample-loading control. The densitometric ATG12/ACTB ratio from at least 3 independent experiments is shown. The value of mock-treated cells with control shRNA was set at 1 for each experiment (**P < 0.01). (F) Knockdown of ATF4 inhibited ATG12 mRNA expression. Huh7 cells were transfected with HCV core protein expression plasmids or empty vectors. Lentiviral shRNA against ATF4 was added 6 h post-transfection (MOI = 1) and incubated for 3 h. At 72 h post-transfection, cells were harvested and real-time PCR was performed. Data are representative of 3 independent experiments (*P < 0.05).
None
Figure 8. DDIT3 upregulates LC3B expression in HCV core-transfected cells. (A) Knockdown of DDIT3 inhibited the conversion of LC3B-I to LC3B-II and degradation of SQSTM1. Huh7 cells were transfected with HCV core protein expression plasmids or empty vectors along with DDIT3 siRNA or control siRNA. Cells treated with 300 nM Tg for 16 h were used as positive controls. At 72 h post-transfection, expression of DDIT3, LC3B, SQSTM1, and HCV core protein were analyzed by western blotting using the indicated antibodies. Blots are representative of 3 independent experiments. ACTB was used as a sample-loading control. The densitometric LC3B-II/ACTB and SQSTM1/ACTB ratios from at least 3 independent experiments are shown (**P < 0.01). (B) The cells in (A) were fixed and analyzed by indirect immunofluorescence using anti-LC3B and anti-core antibodies. Patterns of LC3B expression in mock-transfected and HCV protein-transfected cells were visualized with laser confocal microscopy. LC3B (green), HCV core (red) staining is shown. Scale bars: 10 μm. (C) Quantitative presentation of punctate LC3B per cell in (B). (D) Real-time PCR analysis for LC3B mRNA expression. The cells treated as (A) were harvested for RNA extraction and real-time PCR analysis. The results are representative of 3 independent experiments (*P < 0.05, **P < 0.01).
None
Figure 9. HCV core protein upregulation of LC3B expression occurs through DDIT3 directly binding to the LC3B promoter. (A) LC3B promoter activity was analyzed by Luciferase assay. Huh7 cells were transfected with various amounts of ATF4, DDIT3, or HCV core protein expression plasmids along with LC3B promoter plasmids and Renilla luciferase pRL-SV40 plasmids. Cells were treated with various concentrations of DTT and Tg for 16 h. At 48 h post-transfection, cells were harvested and analyzed. Luminescence was measured with a luminometer and the fold-change is expressed relative to the mock-transfected control, and the mock value was set at 1 each for experiment (*P < 0.05, **P < 0.01). Expression of ATF4, DDIT3, and core proteins in the cells were analyzed by western blotting using the indicated antibodies. (B) Location of primer sets in the LC3B promoter region used for PCR after ChIP. The number for primers is relative to the start codon. (C) DDIT3 ChIP assay for the LC3B promoter. Huh7 cells were transfected with HCV core protein expression plasmids or empty vectors. Cells treated with 300 nM Tg or 10 mM DTT for 16 h were used as positive controls. At 48 h post-transfection, the cells were processed for DDIT3 ChIP. The agarose gel electrophoresis was performed to analyze the PCR products. (D) Real-time PCR for the quantitative DDIT3 ChIP assay of the region corresponding to the primer set –253 to –99. The values represent the ratio of PCR signals from the immunoprecipitated samples to the corresponding input (percent of input DNA; **P < 0.01). Data shown are from a single ChIP, in which 3 independent dishes were pooled for each treatment. Three such independent experiments were done. (E) Knockdown of DDIT3 reduced the LC3B promoter activity activated by HCV core protein. Huh7 cells were transfected with core protein expression plasmids or empty vectors and DDIT3 siRNA or control siRNA along with LC3B promoter plasmids and Renilla luciferase pRL-SV40 plasmids. Cells treated with 300 nM Tg for 16 h were used as positive controls. At 72 h post-transfection, the cells were harvested and analyzed. The luminescence was measured using a luminometer. The fold-change is expressed relative to mock-transfected controls and the value of mock-treated cells with control siRNA was set at 1 for each experiment (*P < 0.05). Expression of DDIT3 and core proteins in the cells were analyzed by western blotting using the indicated antibodies.
None
Figure 10. Schematic model of the molecular mechanism through which HCV core protein induces autophagy. HCV core protein induces ER stress, which activates the EIF2AK3 and ATF6 pathways of UPR, but not the ERN1-XBP1 pathway. In the EIF2AK3 pathway, HCV core protein activates the phosphorylation of EIF2AK3 and EIF2S1. Phosphorylated EIF2S1 upregulates expression of ATF4, which leads to the upregulation of DDIT3, LC3B, and ATG12. In the ATF6 pathway, ATF6 (90 kDa) is cleaved to release an active form, which leads to the upregulation of DDIT3. DDIT3 increases expression of LC3B and ATG5. LC3B, a specific autophagy marker, plays an important role in the development of autophagy. ATG12 and ATG5 are components of the ATG12-ATG5-ATG16L1 complex, which promotes the conversion of LC3B-I to LC3B-II to induce autophagy.

Similar articles

Cited by

References

    1. Ray Kim W. . Global epidemiology and burden of hepatitis C. Microbes Infect 2002; 4:1219 - 25; http://dx.doi.org/10.1016/S1286-4579(02)01649-0; PMID: 12467763 - DOI - PubMed
    1. Moradpour D, Penin F, Rice CM. . Replication of hepatitis C virus. Nat Rev Microbiol 2007; 5:453 - 63; http://dx.doi.org/10.1038/nrmicro1645; PMID: 17487147 - DOI - PubMed
    1. Gale M Jr., Foy EM. . Evasion of intracellular host defence by hepatitis C virus. Nature 2005; 436:939 - 45; http://dx.doi.org/10.1038/nature04078; PMID: 16107833 - DOI - PubMed
    1. Egger D, Wölk B, Gosert R, Bianchi L, Blum HE, Moradpour D, Bienz K. . Expression of hepatitis C virus proteins induces distinct membrane alterations including a candidate viral replication complex. J Virol 2002; 76:5974 - 84; http://dx.doi.org/10.1128/JVI.76.12.5974-5984.2002; PMID: 12021330 - DOI - PMC - PubMed
    1. Gosert R, Egger D, Lohmann V, Bartenschlager R, Blum HE, Bienz K, Moradpour D. . Identification of the hepatitis C virus RNA replication complex in Huh-7 cells harboring subgenomic replicons. J Virol 2003; 77:5487 - 92; http://dx.doi.org/10.1128/JVI.77.9.5487-5492.2003; PMID: 12692249 - DOI - PMC - PubMed

Publication types

MeSH terms