. 2014 Apr 17;508(7496):392-6.
doi: 10.1038/nature13070. Epub 2014 Mar 2.

Apical constriction drives tissue-scale hydrodynamic flow to mediate cell elongation

Affiliations

Apical constriction drives tissue-scale hydrodynamic flow to mediate cell elongation

Bing He et al. Nature. .

Abstract

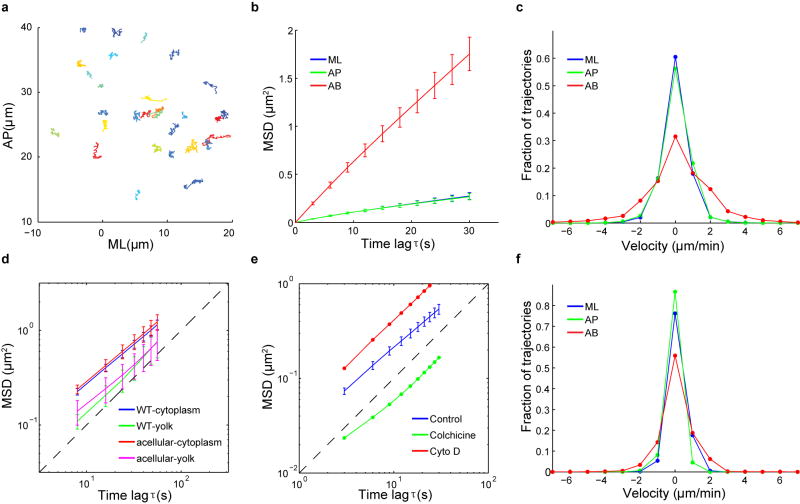
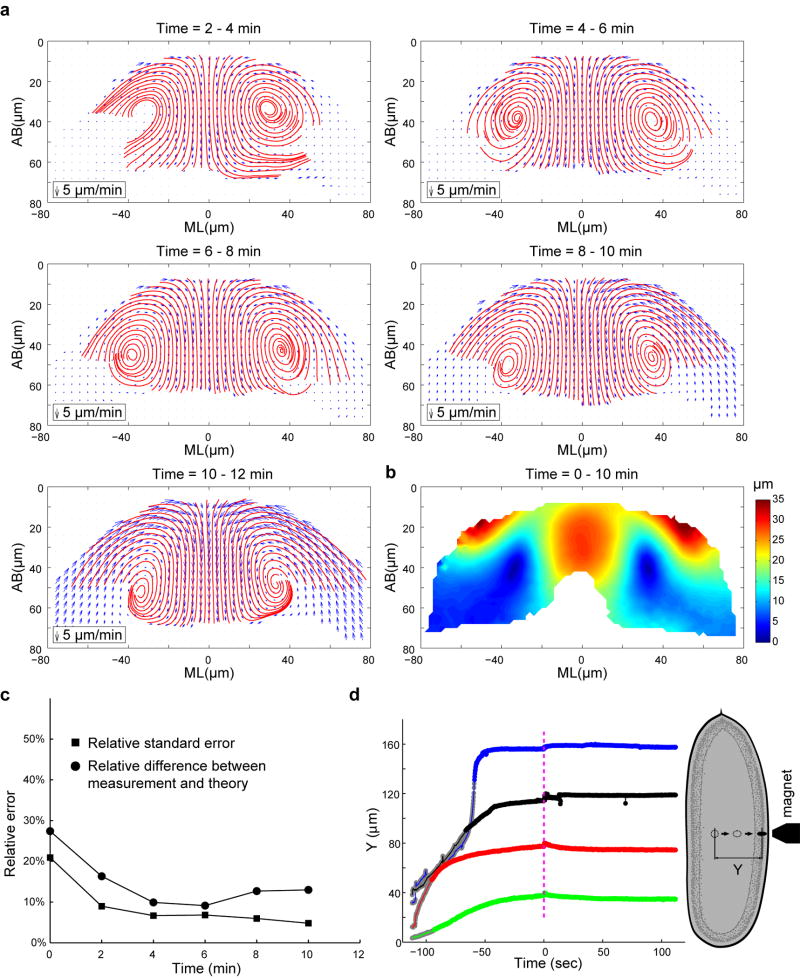
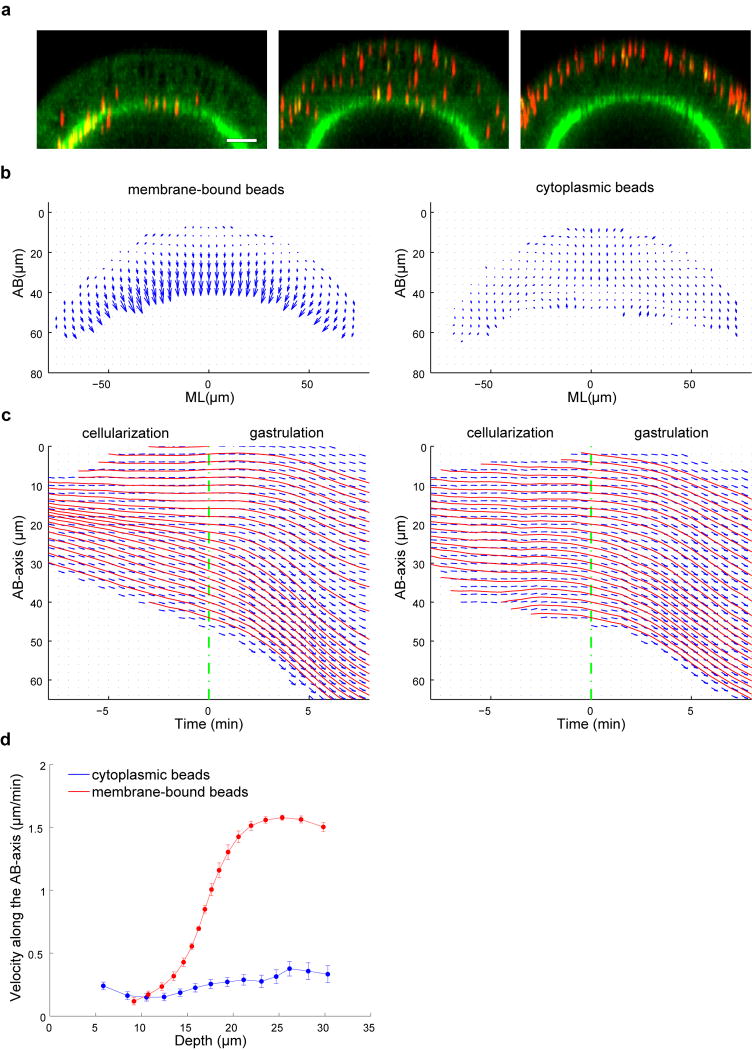
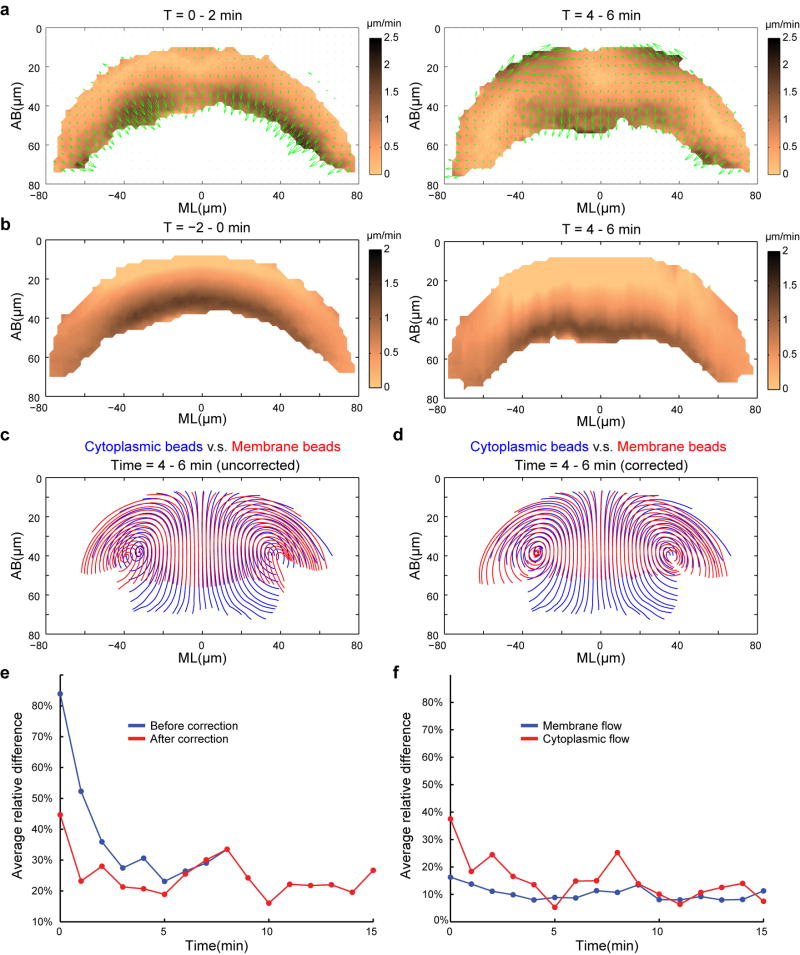
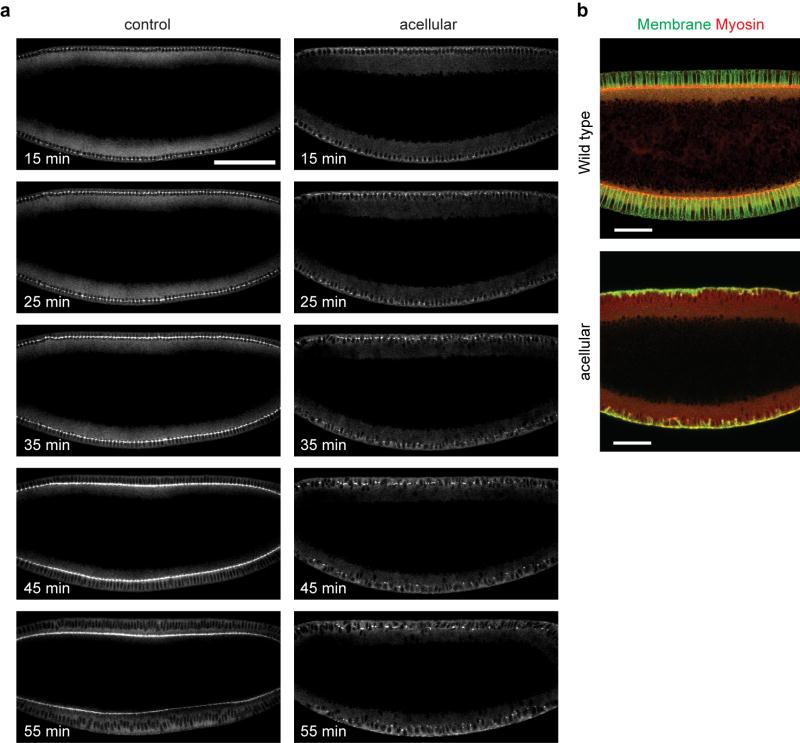
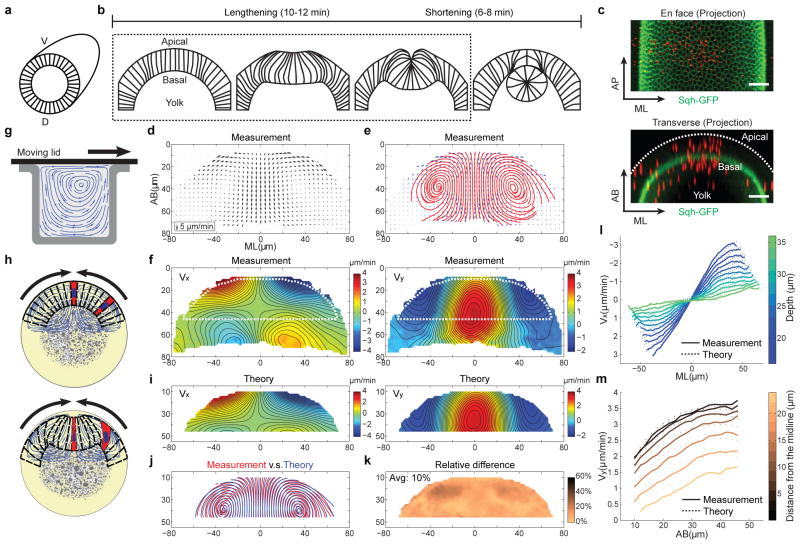
Epithelial folding mediated by apical constriction converts flat epithelial sheets into multilayered, complex tissue structures and is used throughout development in most animals. Little is known, however, about how forces produced near the apical surface of the tissue are transmitted within individual cells to generate the global changes in cell shape that characterize tissue deformation. Here we apply particle tracking velocimetry in gastrulating Drosophila embryos to measure the movement of cytoplasm and plasma membrane during ventral furrow formation. We find that cytoplasmic redistribution during the lengthening phase of ventral furrow formation can be precisely described by viscous flows that quantitatively match the predictions of hydrodynamics. Cell membranes move with the ambient cytoplasm, with little resistance to, or driving force on, the flow. Strikingly, apical constriction produces similar flow patterns in mutant embryos that fail to form cells before gastrulation ('acellular' embryos), such that the global redistribution of cytoplasm mirrors the summed redistribution occurring in individual cells of wild-type embryos. Our results indicate that during the lengthening phase of ventral furrow formation, hydrodynamic behaviour of the cytoplasm provides the predominant mechanism transmitting apically generated forces deep into the tissue and that cell individualization is dispensable.


Figures

Extended Data Figure 1
Extended Data Figure 1. Embryo orientation for beads injection and live imaging
(a) Body axis (red lines) of the Drosophila embryo. A transverse cross section of the embryo at 50% egg length is shown in blue. V: ventral; D: dorsal. (b) The definition of x, y coordinates used in this study. x-axis: ML-axis; y-axis: AB-axis. (c, d) Injection of uncoated fluorescent beads (c) or WGA-coated beads (d) into the cytoplasm or the perivitelline space of an embryo, respectively. The embryo is glued to the coverslip on its dorsal side (method 1). (e) Injection of uncoated fluorescent beads into the cytoplasm of an embryo with its ventral side glued to a coverslip (method 2). Method 1 is better suited than method 2 to introduce beads into the perivitelline space, while method 2 has the advantage of keeping the ventral side free of wound. Note that in method 2 the ventral surface of the embryo is slightly flattened due to contact with the coverslip. This nevertheless does not affect the hydrodynamic characteristics of the cytoplasmic flow. Method 1 was applied in experiments used for Fig. 1 and 2. Method 2 was applied in experiments used for Fig. 3–4 and Extended Data Fig. 10.
Extended Data Figure 2
Extended Data Figure 2. The cytoplasmic beads display extremely low mobility during cellularization
(a) Trajectories of beads within a 2-min interval during cellularization. Shown is the projection on the AP-ML plane. Colors are used to distinguish individual trajectories. (b) Ensemble time averaged MSDs of cytoplasmic beads along the AP-, ML- and AB-axis in cellularizing embryos (n = 5). Error bars represent s.d. (c) Distribution of beads velocity along the AP-axis, ML-axis and AB-axis. Velocity was calculated over a 1-min time interval. (d) Log-log plot of the average two-dimensional MSD of beads (AP-ML plane) embedded in the cytoplasm or the yolk of the wild type embryos (n = 5) undergoing cellularization, or in the acellular embryos (n = 5) at the corresponding stage. Error bars represent s.d. (e) Log-log plot of the average two-dimensional MSD of beads embedded in the cytoplasm of the control embryos (n = 5) or embryos injected with Colchicine (n = 2) or Cytochalasin D (n = 2). Error bars represent s.d. (f) Distribution of beads velocity in embryos co-injected with Colchicine. Depolymerization of MTs by Colchicine reduces the active, non-equilibrium fluctuations within the cytoplasm and causes a substantial reduction of beads mobility, in particular along the AB-axis.
Extended Data Figure 3
Extended Data Figure 3. Generating velocity field and estimating measurement error
(a) Velocity fields (blue) and streamlines (red) of the cytoplasmic flow in the wild type embryos at t = 4–6 min. Velocity fields were averaged with different sampling radius R. We selected an R value of 18 μm in our study (Supplementary Methods). (b) Heat maps showing the relative standard error for Vx, Vy and V (RSEx, RSEy and RSE, respectively). (c) Heat maps showing the number of trajectories being averaged. (d) The average RSE as a function of time.
Extended Data Figure 4
Extended Data Figure 4. Cytoplasmic flow in the wild type embryos at different t
(a) Velocity field (blue arrows) and streamlines (red) of the cytoplasmic flow in the wild type embryos at different time points during VF formation. The shortening phase starts approximately at t = 10–12 min. (b) Heat map showing the displacement field between t = 0–10 min. (c) Relative difference between the measured velocity profiles in the wild type embryos and the hydrodynamic predictions. Relative standard errors (RSE) of the velocity profiles are plotted for comparison. Note that the relative difference between measurements and predictions is within 13% between t = 4 – 12 min. (d) Displacement of ferrofluid droplets passed through yolk and cytoplasm of syncytial embryos (denoted by Y in the schematic to the right) plotted against time. Blue curve corresponds to a cellularizing wild type embryo; other curves are measurements in double mutant acellular embryos. Magenta dashed line indicates the time-point when magnetic field was removed (t = 0). Y values are normalized such that 40 μm, 80 μm, 120 μm and 160 μm correspond to the surface of the embryo for green, red, black and blue curves, respectively. Gray portion of each curve approximately corresponds to the motion of the droplet through the yolk whereas the remainder of the curve corresponds to movement through the cytoplasm layer. Fluctuations in the tracked bead position around t = 0 are due to unsteady motion of the microscope stage as magnet position was adjusted manually. If these fluctuations are disregarded, droplet behavior after removal of the magnet is essentially flat. In two of the four cases (the red and green traces), the directionality of the fluctuation is similar to that expected of recoil, but even if interpreted as such, the magnitude does not exceed 5 microns which is much smaller than the 30-micron displacement of the droplet through the cytoplasmic layer.
Extended Data Figure 5
Extended Data Figure 5. The membrane-bound beads and the cytoplasmic beads show distinct patterns of movement during cellularization
(a) Perivitelline injection of WGA-beads at different stages of cellularization leads to their binding to different portions of the plasma membrane. Left: beads injected at very early cellularization are localized to the furrow canals (FCs) and remain there throughout cellularization. Middle: beads injected during mid-cellularization bind the incipient lateral membrane and move in register with the advancing FCs. Right: beads injected during late cellularization remain in the apical region of the cell and do not follow the movement of the FCs. Scale bars: 20 μm. (b) Velocity field of the membrane-bound beads (left) and the cytoplasmic beads (right) during the last two minutes of cellularization. (c) The average displacement of beads along the AB-axis plotted as a function of time. Only beads located within 15 μm from the ventral midline were included. x = 0 is the onset of gastrulation. y = 0 is the apical surface of the embryo. Blue arrows: average apical-basal displacement of beads within Δy = 2 μm and Δt = 30 sec intervals. Red: streamlines. (d) Velocity of beads along the AB-axis during late cellularization (t = −8-0 min) as a function of their initial depth at t = −8 min. During the last 8 min of cellularization, the WGA-beads display depth-dependent directional movement along the AB-axis. Beads bound to the apical portion of the lateral membrane (approximately 0–10 μm) barely move. The velocity of beads below 15 μm rapidly increases with depth and reaches a plateau of maximal velocity at 20 μm, below which the beads moves at the same, maximal speed. In contrast, the cytoplasmic beads do not undergo substantial movement during cellularization. Error bars represent the 95% confidence intervals.
Extended Data Figure 6
Extended Data Figure 6. Compensating the membrane flow for the impact of cellularization
(a) Difference (ΔV = VmembraneVcytoplasm) between the velocity fields of the membrane-bound beads and the cytoplasmic beads. Arrows indicate the velocity vectors of ΔV, and the heat map corresponds to its magnitude. (b) Generating velocity field that corresponds to residual cellularization. The resulting velocity field was subtracted from the corresponding membrane flow to compensate for the impact of cellularization (Supplementary Methods). (c, d) Streamlines of the membrane-bound beads (red) in comparison to the cytoplasmic beads (blue). The velocity field of the membrane-bound beads was either not compensated (c) or compensated (d) for cellularization. (e) Average relative difference between the membrane flow and cytoplasmic flow before (blue) or after (red) compensating for the impact of residual cellularization. (f) Average relative left-right difference of the velocity field.
Extended Data Figure 7
Extended Data Figure 7. The acellular embryos fail to form cells prior to gastrulation
(a) Time lapse images of Sqh-GFP in the control or the acellular embryo imaged at the midsagittal plane. The control and acellular embryos are indistinguishable before cellularization. However, during cellularization, the acellular embryos only make very limited progress in membrane invagination. At the point when cellularization would normally be completed, only discontinuous thread-like strands of membrane are formed extending 10–15 μm into the cytoplasm, meanwhile the nuclei are still located in a common cytoplasm which is not partitioned into individual cells. Scale bar: 100 μm. (b) The wild type and acellular embryos fixed during mid cellularization and stained for membrane (Neurotactin, green) and myosin (Zipper, red). Scale bar: 50 μm.
Extended Data Figure 8
Extended Data Figure 8. The onset of gastrulation is normal in the acellular embryos
(a) Immunostaining of mesoderm determinant Snail in the acellular and control embryos fixed at early cellularization, late cellularization or early gastrulation. The pattern of Snail expression in the acellular embryos closely resembles that in the wild type embryos. At early cycle 14, the Snail proteins are clearly detectable in the prospective mesoderm. The staining appears graded towards the mesoderm/ectoderm boundary at this stage. At mid-cycle 14 and early gastrulation, the staining becomes uniform across the entire prospective mesoderm. Scale bar: 50 μm. (b) Quantification of duration between beginning of cycle 14 and the onset of gastrulation. On each box, the central mark (red) is the median, the edges of the box are the 25th and 75th percentiles, and the whiskers extend to the most extreme data points not considered outliers. (c) Apical myosin dynamics visualized using Sqh-GFP after the onset of gastrulation (t = 0 min). Scale bar: 30 μm. (d) Scanning EM images showing the ventral surface of the wild type and acellular embryos. Bottom panels show the enlarged view of the boxed regions in the top panels. Membrane blebs are formed in the ventral surface of the acellular embryos, indicating that apical constriction still gathers surface membrane into blebs despite the lack of cells. Scale bar: 50 μm (top); 10 μm (bottom).
Extended Data Figure 9
Extended Data Figure 9. Measuring the rate of apical constriction
(a, d) Kymograph of apical Sqh-GFP videos along the ML axis (compensated for the curvature of the embryos) demonstrating the movement of apical myosin towards the ventral midline. x-axis: ML-axis, Scale bar: 50 μm; y-axis: time, Scale bar: 5 min. (b, e) Kymographs processed with a bandpass filter. (c, f) Trajectories of apical myosin moving towards the ventral midline were tracked from the processed kymographs (showing results tracked from multiple kymographs). Colors are used to distinguish individual trajectories. (g, h) The rate of apical constriction (i.e., the rate of convergent movement of the apical cortex) at different time during VF formation as a function of ML positions. The rate of apical constriction (magenta) was averaged from measurement of individual myosin trajectories over 2-min intervals (blue dots). Red dots are outliers. (i) Average rate of apical constriction over time. For each time point, rates were averaged across the mid-ventral region (x = −50-50 μm). Insert shows the ratio of rates between the wild type and acellular embryos over time. Dashed line corresponds to 1.6×. Error bars indicate s.e.m. (j) Average Vx near the ventral cortex (y = 10–14 μm, t = 6–12 min) as a function of ML positions. (k) Average Vy near the ventral midline (x = −16-16 μm, t = 6–12 min) as a function of AB positions. Error bars indicate s.d. in (j) and (k).
Extended Data Figure 10
Extended Data Figure 10. Comparing the mutant flow profiles with the hydrodynamic predictions
(a) T48 (mild), n = 5 embryos; (b) T48 (severe), n = 6 embryos; (c) zip-RNAi, n = 10 embryos; (d) cta, n = 8 embryos. For each mutant, Top: Heat maps of Vx and Vy (measurement); Middle: Heat maps of Vx and Vy (theoretical prediction). Bottom left: Streamlines of the measured velocity field (red) in comparison to those deduced from the Stokes equations (blue); Bottom right: Relative difference between the measured velocity field and the hydrodynamic predictions. At the selected time points, the rate of apical constriction in each mutant is comparable to that in the wild type at t = 6–8 min (Extended Data Fig. 9i).
Figure 1
Figure 1. Cytoplasmic flow during VF formation
(a, b) Cross-section view of VF formation. (c) An embryo injected with fluorescent beads (red). Scale bar: 20 μm. (d, e) The velocity field (arrows) and streamlines (red) of the cytoplasmic flow at t = 4–6 min. n = 14 embryos. (f) Heat maps of Vx and Vy with smoothed contour lines of equal magnitude. Positive values indicate left-to-right flow (Vx) or basally-directed flow (Vy). The dotted line highlights the region subjected to theoretical comparison. (g) A 2-D Stokes flow driven by a moving lid. (h) Apical constriction drives cytoplasmic flow to mediate cell shape changes. (i) Vx and Vy deduced from the Stokes equations. (j) Streamlines of the measured (red) and deduced (blue) velocity fields. (k) Relative difference in (j). (l, m) Vx (l) and Vy (m) as a function of ML or AB positions, respectively.
Figure 2
Figure 2. The movement and expansion of the lateral membranes follow the cytoplasmic flow
(a) Perivitelline injection of WGA-coated beads (yellow). Scale bar: 20 μm. (b) Velocity field of the WGA-beads at t = 4–6 min. n = 10 embryos. (c) Streamlines of the WGA-beads (red) and the cytoplasmic beads (blue). (d) Relative difference in (c). (e) Vy as a function of AB positions. (f, g) Heat maps of Vx and Vy of the WGA-beads. (f): measurement; (g): theoretical prediction. (h) Streamlines of the measured (red) and deduced (blue) velocity fields. (i) Relative difference in (h).
Figure 3
Figure 3. Apical constriction induces cytoplasmic flow independent of the basolateral membranes
(a) Midsagittal view of embryos showing membrane, myosin II and DNA. Top: cellularization; bottom: early gastrulation. Scale bars: 100 μm. (b) The nuclear movements during VF (arrows) formation. Scale bars: 20 μm. (c) Cross section of the embryos showing Twist, myosin II and DNA. Scale bars: 50 μm. (d) Cross section of early gastrulae showing membrane and adherens junctions. Scale bars: 50 μm. (e, f) The velocity field and streamlines of the cytoplasmic flow. Wild type: n = 20 embryos; acellular: n = 18 embryos. (g, h) Heat maps of Vx and Vy in the acellular embryos. (g): measurement; (h): theoretical prediction. (i) Streamlines of the measured (red) and deduced (blue) velocity fields. (j) Relative difference in (i). (k) Vx as a function of the rate of apical constriction (Vac). (l) Average Vy as a function of average Vac. (m) Vx/Vac (filled circles) and Vy/Vac (open squares) over time. Color-coding is identical in k-m. Dashed lines: the best fit of the ratio. Error bars indicate s.e.m. in (k)–(m).
Figure 4
Figure 4. Virtual-cell analysis to reveal cell shape changes from the flow
(a) VF formation in the wild type embryo. Selected cells are highlighted for better comparison. Scale bar: 30 μm. (b, c) Virtual-cells for the wild type (b) and acellular (c) embryos. (d–f) The secant angle enclosed by the middle 12 ventral cells (d), their average apical and basal area (e), and the average distance between the cell apex and each lateral node (f) as a function of time. (g) The displacement of lateral nodes along the AB-axis as a function of their initial AB-positions. Error bars indicate s.d. in (e)–(g). (h) A cartoon model demonstrating that in response to apical constriction, the apical cytoplasm undergoes uniform extension independent of the basolateral membrane.

References

    1. Sawyer JM, et al. Apical constriction: a cell shape change that can drive morphogenesis. Dev Biol. 2010;341:5–19. - PMC - PubMed
    1. Leptin M, Grunewald B. Cell shape changes during gastrulation in Drosophila. Development. 1990;110:73–84. - PubMed
    1. Sweeton D, Parks S, Costa M, Wieschaus E. Gastrulation in Drosophila: the formation of the ventral furrow and posterior midgut invaginations. Development. 1991;112:775–89. - PubMed
    1. Martin AC, Kaschube M, Wieschaus EF. Pulsed contractions of an actin-myosin network drive apical constriction. Nature. 2009;457:495–9. - PMC - PubMed
    1. Sherrard K, Robin F, Lemaire P, Munro E. Sequential activation of apical and basolateral contractility drives ascidian endoderm invagination. Curr Biol. 2010;20:1499–510. - PMC - PubMed

Publication types