. 2014 Apr 10;508(7495):269-73.
doi: 10.1038/nature13034. Epub 2014 Mar 2.

Direct measurement of local oxygen concentration in the bone marrow of live animals

Affiliations

Direct measurement of local oxygen concentration in the bone marrow of live animals

Joel A Spencer et al. Nature. .

Abstract

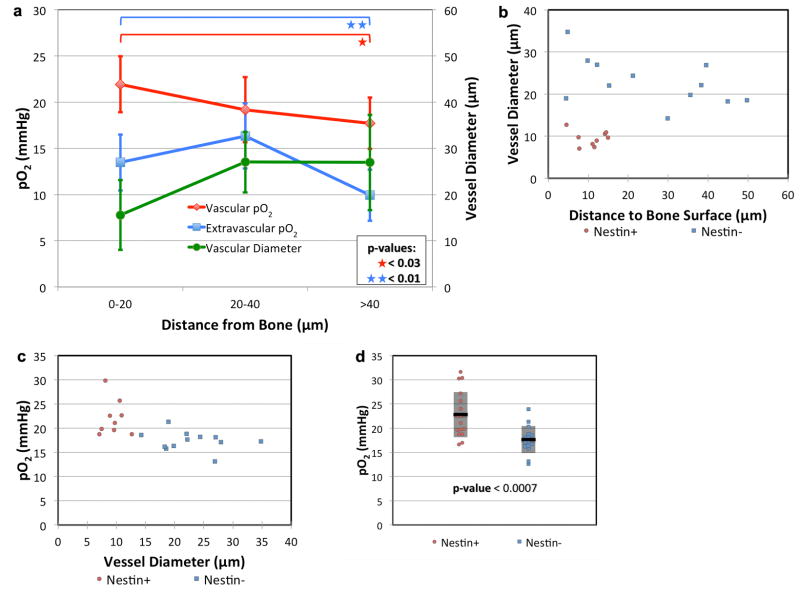
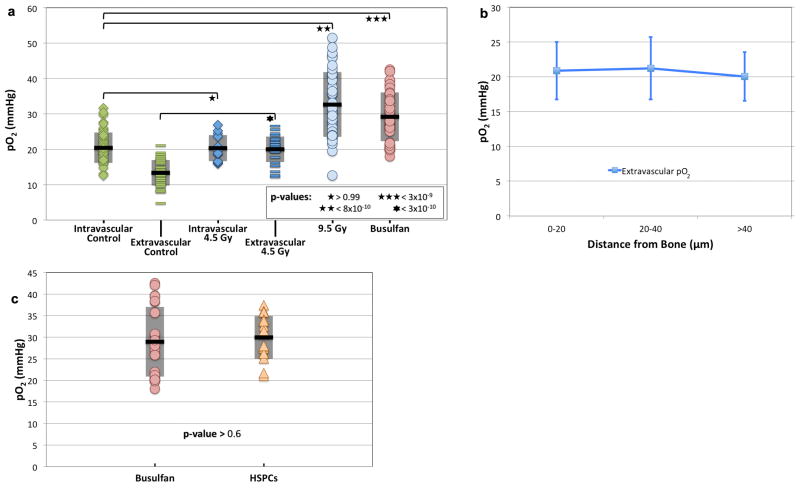
Characterization of how the microenvironment, or niche, regulates stem cell activity is central to understanding stem cell biology and to developing strategies for the therapeutic manipulation of stem cells. Low oxygen tension (hypoxia) is commonly thought to be a shared niche characteristic in maintaining quiescence in multiple stem cell types. However, support for the existence of a hypoxic niche has largely come from indirect evidence such as proteomic analysis, expression of hypoxia inducible factor-1α (Hif-1α) and related genes, and staining with surrogate hypoxic markers (for example, pimonidazole). Here we perform direct in vivo measurements of local oxygen tension (pO2) in the bone marrow of live mice. Using two-photon phosphorescence lifetime microscopy, we determined the absolute pO2 of the bone marrow to be quite low (<32 mm Hg) despite very high vascular density. We further uncovered heterogeneities in local pO2, with the lowest pO2 (∼9.9 mm Hg, or 1.3%) found in deeper peri-sinusoidal regions. The endosteal region, by contrast, is less hypoxic as it is perfused with small arteries that are often positive for the marker nestin. These pO2 values change markedly after radiation and chemotherapy, pointing to the role of stress in altering the stem cell metabolic microenvironment.


Conflict of interest statement

Author Information

The authors declare no competing financial interests. Reprints and permissions information is available at www.nature.com/reprints.

Figures

Figure 1
Figure 1. BM vascular density and oxygenation
(a) Intravital maximum intensity image (~75 μm thick) of mouse calvarial BM showing blood vessels (red, Qtracker 655 vascular dye) and bone (blue, collagen SHG). (b) Corresponding single plane of the 3D intravital imaging stack showing blood vessels (red), bone SHG (blue), and the 3D Euclidean distance measurement (EDM, green) to the nearest blood vessel wall for each extravascular pixel in the BM. (c) Histogram of all EDMs from the full 3D imaging stack. (d) BM pO2 is significantly lower compared to pO2 in periosteal and cortical bone vessels. Each point represents a pO2 measurement in a separate blood vessel or interstitial position (n = 8, 21, 55, and 40 vessels/locations for periosteum, cortical bone, BM intravascular, and BM extravascular, respectively, from 8 mice). The mean (black line) and ± standard deviation (shaded box) for each data set is shown. (e) Maximum intensity projection image montage of a blood vessel entering the BM from the bone. Bone (blue) and blood vessels (yellow) are delineated with SHG and RhodamineB-dextran/PtP-C343 fluorescence, respectively. The two arrows point to locations of pO2 measurements just before and after the vessel enters the BM. (f) Drop in pO2 when tracking along individual vessels upon entry into the BM (n = 8 vessels from 4 mice). The mean (black line) is shown for each data set. Scale bars ~100 μm.
Figure 2
Figure 2. Variation in BM pO2 according to vessel diameter and distance from the endosteal surface
(a) Average vessel diameter (green line, n = 38 vessels from 4 mice) and intravascular (red line, n = 38 vessels from 4 mice) and extravascular (blue line, n = 39 locations from 3 mice) pO2 are plotted as a function of the distance from the bone surface to the measurement location. Error bars are the ± standard deviations. (b) The diameter of nestin+ (red circles, n = 9 vessels from 3 mice) and nestin- vessels (blue squares, n = 12 vessels from 3 mice) are plotted as a function of the distance from the endosteal surface. (c) The pO2 of the same nestin+ and nestin- vessels are plotted as a function of vessel diameter. (d) Nestin+ (red circles, n = 17 vessels from 7 mice) and nestin- (blue squares, n = 16 vessels from 5 mice) vessel pO2. The mean (black line) and ± standard deviation (shaded box) for each data set is shown.
Figure 3
Figure 3. BM pO2 after cytoreductive therapy and at sites of HSPC homing
(a) BM pO2 two days after sublethal (4.5 Gy, n = 13 vessels and 29 extravascular locations from 5 mice) or lethal (9.5 Gy, n = 40 locations from 2 mice) gamma irradiation, or after busulfan (35 mg/kg, n = 40 locations from 6 mice) conditioning. The untreated control pO2 from Figure 1d is plotted for comparison. (b) Extravascular pO2 measurements are plotted as a function of distance to the bone surface from the measurement location 2 days after 4.5 Gy irradiation (n = 44 locations from 4 mice). (c) Comparison of pO2 at sites of HSPC homing to the overall BM pO2 in busulfan treated recipients (n = 17 HSPCs from 6 mice). No statistically significant difference was observed. For (a) and (c), the mean (black line) and ± standard deviation (shaded box) for each data set is shown.
Figure 4
Figure 4. BM vascular mapping and the effects of cellularity on local pO2 after cytoreductive conditioning
(a) Vascular connectivity map of a nestin-GFP mouse reveals that nestin+ vessels are upstream of and drain into sinusoids. Arrows indicating blood flow direction, determined by tracking the movement of labeled RBCs with video-rate imaging, are superimposed on a maximum intensity projection image of BM vasculature (red = vascular dye, green = nestin-GFP/RBCs, blue = SHG bone signal). A solid green line indicates a vessel with an adjacent nestin+ cell and a dashed white line indicates a nestin- vessel. Scale bar ~100 μm. (b) In vivo image of the bone marrow of a universal DsRed recipient 5 days after transplantation with 25 million total marrow cells from a universal GFP donor. Red = DsRed, Green = GFP, Blue = SHG from bone. Scale bar ~100 μm. (c) Ki-67 staining of green (donor) and red (host) BM cells by FACS on day 2 (n = 3 mice) and day 5 (n = 2 mice) after transplantation. Each symbol denotes a different mouse. Scale bars (day 2) are the ± standard deviation of the mean. (d) The in vivo pO2 values in regions with large clusters of donor cells (n = 19 locations from 4 mice) compared to small donor clusters/single cells (n = 16 locations from 4 mice) and host clusters/single cells (n = 40 locations from 5 mice). The mean (black line) and ± standard deviation (shaded box) for each data set is shown.

References

    1. Lymperi S, Ferraro F, Scadden DT. The HSC niche concept has turned 31. Annals of the New York Academy of Sciences. 2010;1192:12–18. - PMC - PubMed
    1. Suda T, Takubo K, Semenza GL. Metabolic regulation of hematopoietic stem cells in the hypoxic niche. Cell Stem Cell. 2011 - PubMed
    1. Mohyeldin A, Garzón-Muvdi T, Quiñones-Hinojosa A. Oxygen in stem cell biology: a critical component of the stem cell niche. Cell Stem Cell. 2010 - PubMed
    1. Lee KE, Simon MC. From stem cells to cancer stem cells: HIF takes the stage. Current opinion in cell biology. 2012 - PubMed
    1. Unwin RD. Quantitative proteomics reveals posttranslational control as a regulatory factor in primary hematopoietic stem cells. Blood. 2006;107:4687–4694. - PubMed

Publication types

MeSH terms