. 2014 Apr 10;508(7495):263-8.
doi: 10.1038/nature13045. Epub 2014 Mar 2.

ZMYND11 links histone H3.3K36me3 to transcription elongation and tumour suppression

Affiliations

ZMYND11 links histone H3.3K36me3 to transcription elongation and tumour suppression

Hong Wen et al. Nature. .

Abstract

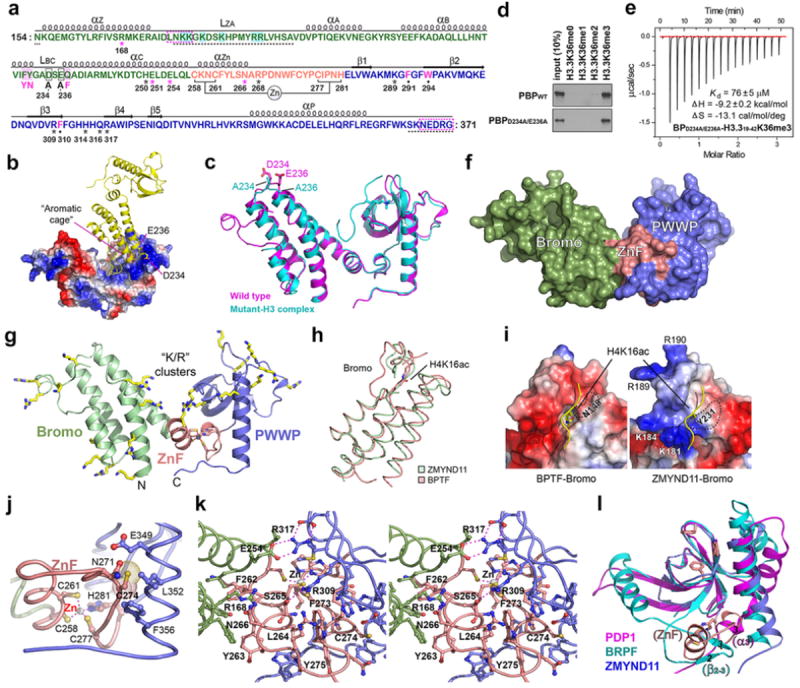
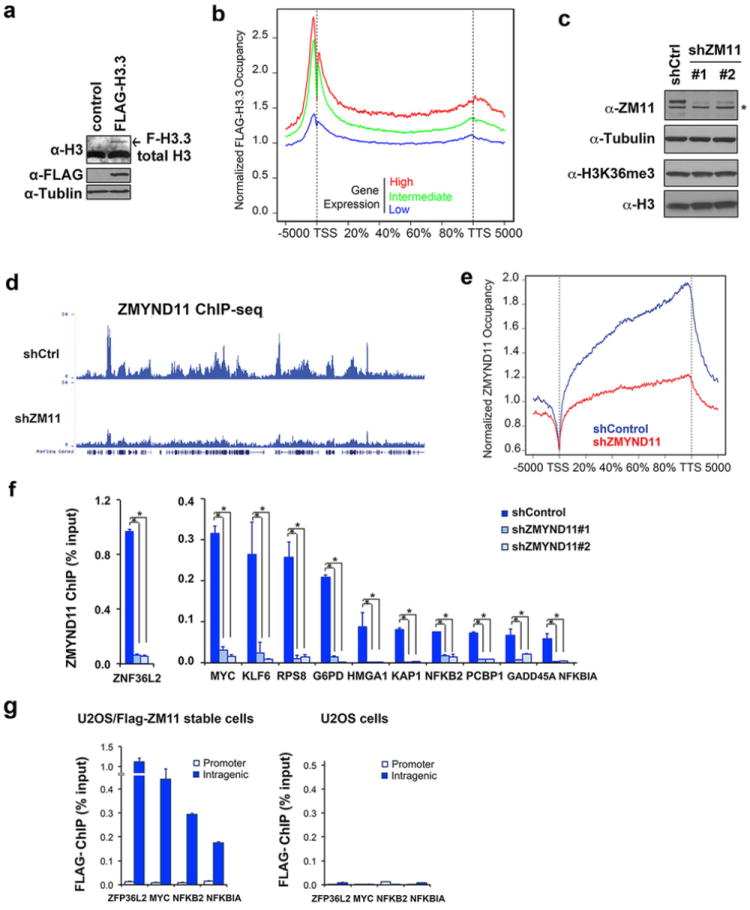
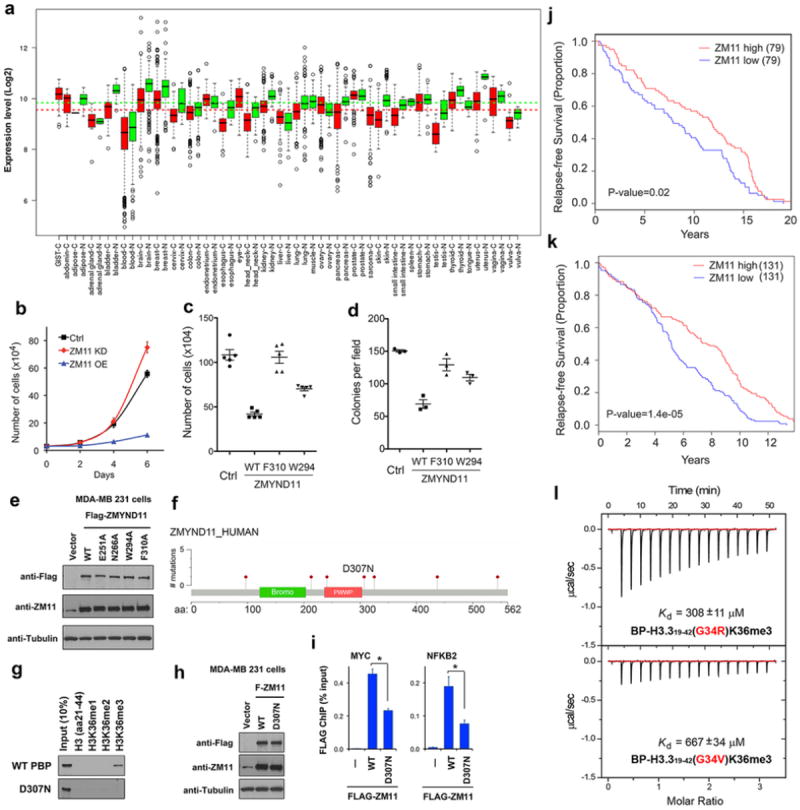
Recognition of modified histones by 'reader' proteins plays a critical role in the regulation of chromatin. H3K36 trimethylation (H3K36me3) is deposited onto the nucleosomes in the transcribed regions after RNA polymerase II elongation. In yeast, this mark in turn recruits epigenetic regulators to reset the chromatin to a relatively repressive state, thus suppressing cryptic transcription. However, much less is known about the role of H3K36me3 in transcription regulation in mammals. This is further complicated by the transcription-coupled incorporation of the histone variant H3.3 in gene bodies. Here we show that the candidate tumour suppressor ZMYND11 specifically recognizes H3K36me3 on H3.3 (H3.3K36me3) and regulates RNA polymerase II elongation. Structural studies show that in addition to the trimethyl-lysine binding by an aromatic cage within the PWWP domain, the H3.3-dependent recognition is mediated by the encapsulation of the H3.3-specific 'Ser 31' residue in a composite pocket formed by the tandem bromo-PWWP domains of ZMYND11. Chromatin immunoprecipitation followed by sequencing shows a genome-wide co-localization of ZMYND11 with H3K36me3 and H3.3 in gene bodies, and its occupancy requires the pre-deposition of H3.3K36me3. Although ZMYND11 is associated with highly expressed genes, it functions as an unconventional transcription co-repressor by modulating RNA polymerase II at the elongation stage. ZMYND11 is critical for the repression of a transcriptional program that is essential for tumour cell growth; low expression levels of ZMYND11 in breast cancer patients correlate with worse prognosis. Consistently, overexpression of ZMYND11 suppresses cancer cell growth in vitro and tumour formation in mice. Together, this study identifies ZMYND11 as an H3.3-specific reader of H3K36me3 that links the histone-variant-mediated transcription elongation control to tumour suppression.


Conflict of interest statement

The authors declare no competing financial interest.

Figures

Extended Data Figure 1
Extended Data Figure 1. The PBP domains are required for ZMYND11 binding to H3.3K36me3
a, Western blot analysis of H3K36me3 levels in calf thymus histones from pulldowns with GST or GST-ZMYND11 PBP. Bottom: GelCode Blue staining of input proteins. b, Electrophoretic mobility shift assay (EMSA) of nucleosomes reconstituted from recombinant H3K36-methyl-lysine analog (MLA) histones incubated with Flag-tagged full-length ZMYND11 proteins. Free DNA, mono nucleosome (Nu), and ZMYND11-bound nucleosome are indicated. c, Western blot analysis of histone peptide pulldowns with GST-ZMYND11 PHD finger. d, ITC curves of the H3.3K36me peptides titrated into ZMYND11 BP domains. e, Western blot analysis of histone peptide pulldowns with Flag-tagged full-length ZMYND11 or the indicated domain-deletion mutants and biotinylated peptides. Schematic of the deletion mutants are shown in the left panel. f, Western blot analysis of protein-ChIP assays using the anti-Flag antibody in HEK 293 cells transfected with Flag-tagged full-length ZMYND11 and the indicated deletion mutants.
Extended Data Figure 2
Extended Data Figure 2. Crystal structures of ZMYND11 BP domains
a, Sequence and structure-based secondary structural assignment of the ZMYND11 tandem Bromo-PWWP (BP) domains. Dashed box (magenta) and dashed line (black): unmodeled sequence in the free and complex structures, respectively; Cyan shading: Basic residues within ZA loop (LZA); Magenta shading: residues corresponding to canonical acetyl-lysine recognition motif; Black box: residues mutated to facilitate co-crystal formation. Black dot: aromatic caging residues; Aster: H3 hydrogen bonding residues with magenta unique to H3.3 variant. b, Burial of the K36me3-binding aromatic cage by an adjacent bromodomain during crystal packing. Two acidic residues, D234 and E236, contribute to such packing contacts through electrostatic interaction with the positive surface patch (blue) of PWWP. c, An overall view of superimposed free and H3K36me3 peptide-bound ZMYND11 bromo-PWWP double mutant. d, Western blot analysis of histone peptide pulldowns with WT ZMYND11 PBP and the PBP-D234A/E236A mutant. e. ITC curves of the histone H3.3K36me3 peptide titrated into ZMYND11 BP-D234A/E236A mutant. f. Solvent accessible surface representations of ZYMND11 bromo-ZnF-PWWP in its free state. Note the tight integration of the paired modules. g, Ribbon view of bromo-ZnF-PWWP with basic lysine/arginine clusters highlighted as yellow sticks. h, Superimposition of ZMYND11 bromodomain with H4K16ac-bound BPTF bromodomain (PDB ID: 3QZT). i, Surface representation of BPTF bound to H4K16ac and its comparison with ZMYND11 bromodomain. The Kac pocket is missing in ZMYND11 bromo due to the occurrence of Y231. Note the positive residue clusters around the peptide binding surface of ZMYND11 bromo (right). j, Zinc coordination sphere of the newly identified ZnF motif of ZMYND11. Note the burial of non-zinc-coordinating C274 at the hydrophobic interface between ZnF (salmon) and PWWP (blue) of ZMYND11. k, Encapsulation of ZnF (salmon) by bromo (green) and PWWP (blue) in stereo view. Dashed line denotes hydrogen bonding or zinc coordinating interactions. Note the burial of hydrophobic residues including F262, L264, F273, C274 and Y275 from ZnF at the bromo-ZnF and ZnF-PWWP interfaces. l, Structural alignment of ZMYND11 ZnF-PWWP (salmon and blue) with Pdp1 PWWP (PDB ID: 2L89) (magenta) and BRPF1 PWWP (PDB ID: 2X4W) (cyan) showing the structural overlaps of ZMYND11 ZnF with Pdp1 α3 and BRPF1 β2-β3 insertion.
Extended Data Figure 3
Extended Data Figure 3. Comparison of ZMYND11 PWWP with other Kme3-binding PWWP domains
a-b, Stereo view of ZMYND11 PWWP domain in superimposition with H3K36me3-bound BRPF1 PWWP (PDB ID: 2X4W) (a) and H3K79me3-bound HDGF PWWP (PDB ID: 3QJ6) (b). c, Sequence alignment of Kme3-binding PWWP domains. Conserved residues are in blue box; identical residues are shaded in red. Underscored dots: residues forming the aromatic cage. Sequence alignment was produced using the ESPript. d, Western analysis of histone peptide pulldowns with indicated point mutants in the context of Flag-tagged full-length ZMYND11 and biotinylated peptides. e, Western blot analysis of the protein-ChIP assays in cells expressing Flag-tagged full-length ZMYND11 or the indicated mutants. f, Point mutations in ZMYND11 bromo-ZnF-PWWP domains do not affect protein folding. Circular dichroism (CD) spectroscopy analysis of the WT ZMYND11 BP domains and indicated mutants used in this study. g, Steady-state analysis of the biolayer interferometry (BLI) sensorgrams of ZMYND11 BP binding to unmethylated (black square) and fully methylated (blue triangle) 22-mer duplex DNA derived from the Widom 601 sequence. Unmethylated duplex DNA: 5’-CAGCTGAACATCGCTTTTGATG-3’; fully methylated duplex DNA: 5’-CAGCTGAACAT[5medC]GCTTTTGATG-3’.
Extended Data Figure 4
Extended Data Figure 4. Crystal structure of ZMYND11 BP in complex with H3.1K36me3 and its comparison with the H3.3K36me3-bound complex
a. ITC curves of H3.3K36me3 or H3.1K36me3 peptides titrated into ZMYND11 BP and PBP domains. Titration c-values are 1.41 for BP-H3.3, 0.15 for BP-H3.1, 1.26 for PBP-H3.3 and 0.16 for PBP-H3.1, respectively. The “n” value was fixed at 1 for curve fitting. b, Western blot analysis of peptide pulldowns under stringent binding condition. c. Western blot analysis of Flag IP in cells co-expressing Flag-H3.3 or H3.1 and Myc-ZMYND11. d, Structure of ZMYND11-BP in complex with H3.1K36me3 peptide. BP is in surface representation with bromo, ZnF and PWWP colored green, salmon, and blue respectively. 2Fo-Fc omit map around H3 peptide, Polyethylene glycol (PEG) and phosphate (PO4) are shown as cyan mesh contoured at 1σ level. e and f, Simulated annealing Fo-Fc omit map countered at 2.5σ level around the histone segments containing H3.1Ala31 (e) or H3.3Ser31(f) in complex with ZMYND11 BP. Residues R168, H250, E251, E254, N266, R268, R309, R317 of BP, a bridging water (Wat), and segment “Ala29-Val35” of histone H3.1 or H3.3 peptides were omitted for simulated annealing (starting temperature 2500 K and 500 cooling steps) map calculation by the program Phenix. Magenta dashes, hydrogen bonds. Note that the Nε atom of R268 side chain (e) and side chains of R168 (e, f) displayed poor densities, suggesting their conformational flexibility. g, Western analysis of histone peptide pulldowns with indicated point mutants and biotinylated peptides. h, Structural alignment of ZMYND11 BP-H3.3K36me3 (blue), ZMYND11 BP-H3.1K36me3 (salmon), and BRPF1 PWWP-H3.1K36me3 (PDB ID: 2X4W)(yellow). i, Structural alignment of H3K36me3-bound ZMYND11 PWWP (blue), PHF19 Tudor (PDB ID: 4BD3) (red) and PHF1 Tudor (PDB ID: 4HCZ) (cyan). Both BP and H3 peptides are presented as backbone coils, with key residues depicted as stick.
Extended Data Figure 5
Extended Data Figure 5. Analysis of Flag-H3.3 ChIP-seq and ZMYND11 ChIP-seq data
a, Western blot analysis of U2OS cells stably expressing Flag-H3.3 with the indicated antibodies. The arrow indicates the ectopic Flag-H3.3 protein. b, Average occupancy of Flag-H3.3 along the transcription unit on genes with high, intermediate, and low expression levels. The gene expression levels were grouped according to the RNA-seq RPKM value as low (<1), medium (1-20), or high (>20). The gene body length is aligned by percentage from the TSS to TTS as in Fig. 3b. c, Western analysis of ZMYND11 protein and H3K36me3 levels in control and ZMYND11 knockdown U2OS cells. The asterisk indicates a non-specific band. d, Genome browser view of ZMYND11 occupancy in the chromosome 16p13.3 regions (as shown in Fig. 3d) in control and ZMYND11 knockdown cells. e, The average genome-wide occupancy of ZMYND11 along the transcription unit in cells as in d. f, qPCR analysis of ZMYND11 ChIP in the gene bodies of the indicated genes in cells as in c. Error bars: s.e.m. of three experiments. P<0.01 (Student t-test). g, qPCR analysis of Flag ChIP in cells stably expressing Flag-ZMYND11 and control U2OS cells. Error bars indicate the s.e.m. of three independent experiments.
Extended Data Figure 6
Extended Data Figure 6. ZMYND11 occupancy in gene body depends on SETD2-mediated H3K36me3
a, Average genome-wide ZMYND11 occupancy on genes with high, intermediate, or low levels of H3K36me3. Genes were aligned as described in Fig. 3b, and were grouped according to the H3K36me3 ChIP-seq normalized tag numbers as low (<2), intermediate (2-10), or high (>10). ZMYND11 ChIP-seq occupancies were normalized to 10 million total tag numbers. b, qPCR analysis of the expression of ZMYND11 target genes and SETD2 in control and SETD2 knockdown cells. c, Western blot analysis of H3K36me3 and ZMYND11 levels in SETD2 knockdown cells. Asterisks indicate non-specific bands. Bottom panel: Western blot analysis of Flag-SETD2-expressing cells cotransfected with SETD2-targeting shRNAs using the M2 anti-Flag antibody, indicating efficient knockdowns. d, qPCR analysis of the ZMYND11 and H3K36me3 ChIP in the intragenic regions of NFKB2 gene in control and SETD2 knockdown cells. e, Western blot analysis of NSD2 and H3K36me2 in NSD2 knockdown cells. f, qPCR analysis of H3K36me2, H3K36me3 and ZMYND11 ChIP in MYC and NFKB2 genes in NSD2 knockdown cells. g, Western blot analysis of ZMYND11 expression levels in U2OS cells stably expressing the WT ZMYND11 and the indicated H3.3K36me3 binding-deficient mutants. h, qPCR analysis of Flag ChIP in NFKB2 gene in cells as in g. in b,d,f,h, error bars indicate the s.e.m. of three independent experiments. *: all p values <0.05 (Student t-test).
Extended Data Figure 7
Extended Data Figure 7. ZMYND11 has a role in both transcriptional activation and repression
a, Western blot analysis of ZMYND11 and MYC protein levels in control and ZMYND11 knockdown cells. The asterisk indicates a non-specific band. b, qPCR analysis of the expression of ZMYND11 and ZMYND11 target genes in control and ZMYND11 knockdown U2OS cells. Signals were normalized to GAPDH expression. Error bars represent the s.e.m. of three experiments. *: Two-tailed unpaired Student t-test, p <0.01. c. No cryptic transcripts observed in ZMYND11 knockdown cells. Northern blot analysis of indicated ZMYND11 direct target genes on the total RNA extracted from control and ZMYND11 knockdown U2OS cells. GAPDH was used as a loading control.
Extended Data Figure 8
Extended Data Figure 8. ZMYND11 knockdown increases the occupancies of total Pol II and Pol II S2P in gene bodies
a, Venn diagram showing the overlap of ZMYND11- and Pol II-occupied genes. P < 1e-322 (Fisher’s exact test). A comprehensive list of Pol II ChIP-seq peaks is given in Supplementary Table 6. b, Average genome-wide ZMYND11 occupancy on genes with high, intermediate, and low levels of Pol II occupancy. Genes were aligned as described in 3b, and were grouped according to the Pol II ChIP-seq normalized tag numbers as low (<2), intermediate (2-10), or high (>10). ZMYND11 ChIP-seq occupancies were normalized to 10 million total tag numbers. c. Average genome-wide occupancies of Pol II along the transcription unit of all ZMYND11-activated direct target genes (left) and all non-ZMYND11 target genes (right) in control and ZMYND11 knockdown cells as in Fig. 4e. d, Average genome-wide occupancies of Pol II S2P near the TTS of all ZMYND11-repressed direct target genes in control and ZMYND11 knockdown cells. e, qPCR analysis of the ZMYND11, H3K36me3 and Pol II S2P ChIP in the intragenic regions of MYC and NFKB2 gene in control and ZMYND11 knockdown cells. f, Pol II traveling ratio (TR) on ZMYND11-repressed direct target genes in control and ZMYND11 knockdown cells. Lower TR values indicate a higher degree of elongating Pol II. The left panel shows the schematic representation of the calculation of Pol II TR. The right panel shows the whisker plot of Pol II TR. P= 2.5e-5 (Student’s t-test).
Extended Data Figure 9
Extended Data Figure 9. ZMYND11 suppresses tumor cell growth and is downregulated and mutated in human cancers
a, ZMYND11 is downregulated in cancers. ZMYND11 gene expression in ~40,000 tumor or normal tissue samples from three data sets (Gene Expression Omnibus, ArrayExpress, and Expression Project for Oncology) were analyzed using GENT. N: normal; C: cancer. All p values < 0.0001. b, Cell proliferation assay of U2OS cells (mean ± s.e.m., n=3) with knockdown (KD) or overexpression (OE) of ZMYND11. c, Cell proliferation assay of U2OS cells stably expressing the WT or mutant ZMYND11 proteins (mean ± s.e.m., n=5). Cells were counted 6 days after seeding. d, Colony formation assay of cells as in c. Cell colonies (mean ± s.e.m., n=3) were counted 2 weeks after seeding. e, Western blot analysis of ZMYND11 expression levels in stable MDA-MB 231 cells used in Fig. 4f, g. f, Schematic representation of ZMYND11 missense somatic mutations in colon and rectum adenocarcinoma identified in TCGA database. g, Peptide pulldowns of WT ZMYND11 PBP and the D307N mutant with H3.3K36me peptides. h, Western blot analysis of Flag-tagged WT ZMYND11 and the D307N mutant stably expressed in MDA-MB 231 cells. i, qPCR analysis of Flag ChIP in MYC and NFKB2 genes in the stable cells as in g. Error bars indicate the s.e.m. of three independent experiments *: p <0.01 (Student t-test). j, k. Low ZMYND11 expression levels in breast cancer patients correlate with worse disease-free survival. Kaplan-Meier survival curves of breast cancer patients from cohort studies NIH GEO GSE6532 (j) and GSE7390 (k). P-values were calculated by chi-square test. l, ITC curves of the histone H3.3(G34R)K36me3 and H3.3(G34V)K36me3 peptides titrated into ZMYND11 BP domains.
Figure 1
Figure 1. Molecular basis for H3.3K36me3 recognition by ZMYND11 bromo-PWWP domains
a, Schematic representation of ZMYND11 protein structure. b, Histone peptide microarray (details in Supplementary Table 1) probed with GST-ZMYND11 PBP domains. c and d, Western blot analysis of histone peptide pulldowns with GST-ZMYND11 PBP (c) or individual domains (d) and the indicated biotinylated peptides. e, ITC curves of histone H3.3K36me peptides titrated into ZMYND11 PBP domains. n.d.: not detectable. f, Cartoon view of ZMYND11 BP domains in the free state. g, Structure of ZMYND11 BP in complex with H3.3K36me3 peptide. BP is shown as charge distribution surface. Blue: positive charges; red: negative charges. 2Fo-Fc omit maps around H3 peptide, polyethylene glycol (PEG) and phosphate (PO4) are shown as green mesh contoured at 1 σ level. h, Details of the K36me3 recognition by the PWWP domain. Close-up views: left: the hydrogen-bonding network around G34-H39; right: conformational adjustment of the PWWP aromatic cage upon H3K36me3 peptide binding. ZMYND11 BP in free state is shown in light grey and BP in complex state in dark blue; histone peptide is shown in yellow; small red balls indicate water. i, Western blot analysis of peptide pulldowns with GST-PBP or mutants and the indicated peptides. All the H3K36 peptides used in these experiments were H3.3-based.
Figure 2
Figure 2. H3.3 variant-specific K36me3 recognition by ZMYND11
a, Sequence alignment of H3.3 and H3.1 spanning aa 19-42. The yellow line denotes visible segment in the complex structures. b, Encapsulation of the “S31-T32” segment and “K36me3” by the paired bromo (pale green), ZnF (salmon), and PWWP (blue) modules of ZMYND11 rendered as solvent accessible surface. The “S31-T32” segment, K36me3, and two water (Wat) molecules are highlighted in spacing-filling mode. PO4: phosphate. c, Western blot analysis of peptide pulldowns with ZMYND11-PBP and the H3.3 or H3.1 variant peptides bearing K36me. d, ITC curves of H3.3K36me3 and H3.1K36me3 peptides titrated into ZMYND11 PBP or BP domains. e and f, Recognition of the “A29-G33” segment of H3.3 (e) or H3.1 (f) by ZMYND11 at the junction of bromo (pale green), ZnF (salmon), and PWWP (blue). Panel e is prepared in stereo view with H3.1 complex (grey) superimposed for comparison. Histone peptides are highlighted as yellow sticks. Hydrogen bonding interactions were shown as dashes with cyan for those between H3 peptide and BP, and magenta for those within H3 peptide or BP. Small red balls: waters. g and h, Ligplot diagrams showing critical contacts between ZMYND11 BP and the “A29-G33” segment of H3.3 (g) and H3.1 (h). H3 segment and key hydrogen bonding residues from ZMYND11 BP are depicted in ball-and-stick mode. Cyan circle: water; Blue dashed line: hydrogen bonds; Curved brush: hydrophobic contact. i, ITC curves of ZMYND11-BP domains and the indicated point mutants with the H3.3K36me3 peptide.
Figure 3
Figure 3. ZMYND11 colocalizes with H3K36me3 and H3.3 in gene body
a, Genomic distribution of ZMYND11 ChIP-seq peaks in U2OS cells. The peaks are enriched in introns and exons. P < 1e-1208 (binomial test). b, Average genome-wide occupancies of ZMYND11 and H3K36me3 along the transcription unit. The gene body length is aligned by percentage from the Transcription start sites (TSS) to transcription termination site (TTS). 5 kb upstream of TSS and 5kb downstream of TTS are also included. c, Venn diagram showing the overlap of ZMYND11-, H3K36me3- and Flag-H3.3-occupied genes. P< 1e-465 (3-way Fisher’s exact test). d, Genome-browser view of ChIP-seq peaks in chromosome 16p13.3 regions. TSSs are indicated with arrows. e, Heatmaps of normalized density of ChIP-seq tags in a 20 kb window centered on TTS. f, Average genome-wide ZMYND11 occupancy on genes enriched with both H3K36me3 and H3.3 (red), genes with H3K36me3 (blue) or H3.3 (green) only, or genes with no H3K36me3 and H3.3 enrichment (black). Genes were aligned as described in b, and were grouped according to the H3K36me3 and Flag-H3.3 ChIP-seq normalized tag numbers >10 (high) or < 2 (none). g, qPCR analysis of ZMYND11, H3K36me3 and Flag-H3.3 ChIP. Error bars: s.e.m. of three experiments. h, qPCR analysis of ZMYND11 and H3K36me3 ChIP in MYC gene body in SETD2 knockdown cells. IgG ChIP is shown as a negative control. i, qPCR analysis of Flag ChIP in the cells stably expressing Flag-tagged WT or mutant ZMYND11. In g-i, all error bars represent s.e.m. of three experiments. *: P<0.05.
Figure 4
Figure 4. ZMYND11 modulates Pol II elongation and represses oncogene expression and tumor growth
a, Heatmap representation of differentially expressed genes in control and ZMYND11 knockdown cells. Blue indicates relative low expression; yellow indicates high expression (Details in Supplementary Table 5). b, KEGG and IPA pathway analyses of upregulated genes in ZMYND11 knockdown cells. Genes are shown as the percentage of genes (KEGG) or number of genes (IPA) within a functional group. False discovery rate (FDR) and p-values are shown in the right. c, The genome browser view of Pol II and Pol II-S2P ChIP-seq signals in MYC and NFKB2 genes in control and ZMYND11 knockdown cells. TSS are indicated with arrows. d, Average Pol II occupancy on ZMYND11-repressed direct target genes in control (blue) and ZMYND11 knockdown (red) cells. The left panel shows the entire gene averages, and the right panel shows the close-up view of the elongating Pol II near the TTS. P<2.47e-5 (two-way unpaired Student’s t-test). e, Cell proliferation assay in MDA-MB 231 cells overexpressing WT ZMYND11 or the indicated mutants. Cells (mean ± s.e.m., n=4) were counted for 6 days after seeding. f, Volumes of tumors (mean ± s.e.m., n=5) derived from MDA-MB 231 cells overexpressing WT ZMYND11 or the indicated mutants over 8 weeks following subcutaneous xenograft transplants in immunodeficient nude mice. In e, f, P < 0.001 (one-way repeated-measures ANOVA). g, Kaplan-Meier curves of overall recurrence-free survival of 120 patients with triple-negative molecular subtype of breast cancer. Logrank P =0.0032 (chi-square test).

Comment in

References

    1. Ruthenburg AJ, Li H, Patel DJ, Allis CD. Multivalent engagement of chromatin modifications by linked binding modules. Nat Rev Mol Cell Biol. 2007;8:983–994. - PMC - PubMed
    1. Venkatesh S, et al. Set2 methylation of histone H3 lysine 36 suppresses histone exchange on transcribed genes. Nature. 2012;489:452–455. - PubMed
    1. Elsaesser SJ, Goldberg AD, Allis CD. New functions for an old variant: no substitute for histone H3.3. Curr Opin Genet Dev. 2010;20:110–117. - PMC - PubMed
    1. Hateboer G, et al. BS69, a novel adenovirus E1A-associated protein that inhibits E1A transactivation. EMBO J. 1995;14:3159–3169. - PMC - PubMed
    1. Ladendorff NE, Wu S, Lipsick JS. BS69, an adenovirus E1A-associated protein, inhibits the transcriptional activity of c-Myb. Oncogene. 2001;20:125–132. - PubMed

Publication types

MeSH terms