. 2014 Mar 3;204(5):839-56.
doi: 10.1083/jcb.201306088.

Twist1-induced dissemination preserves epithelial identity and requires E-cadherin

Affiliations

Twist1-induced dissemination preserves epithelial identity and requires E-cadherin

Eliah R Shamir et al. J Cell Biol. .

Abstract

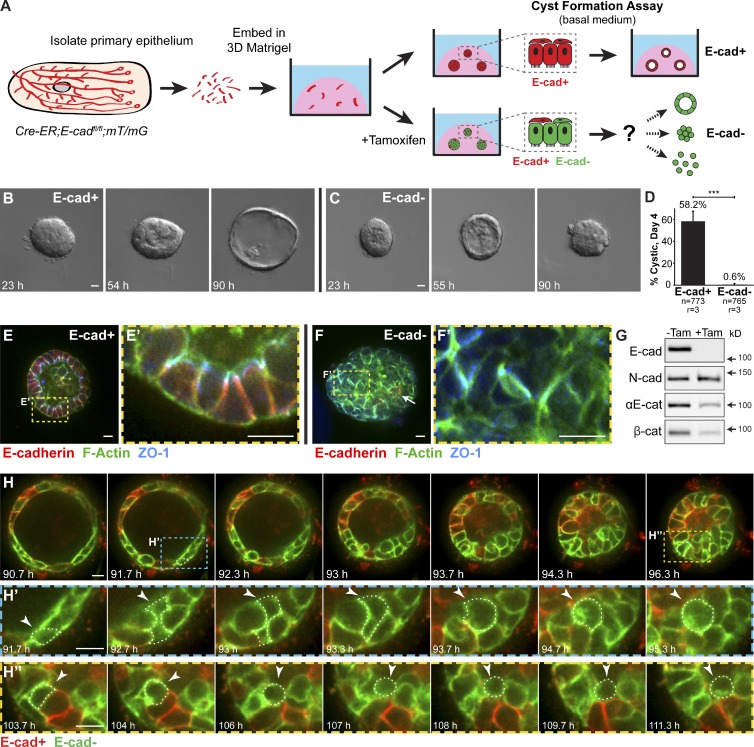
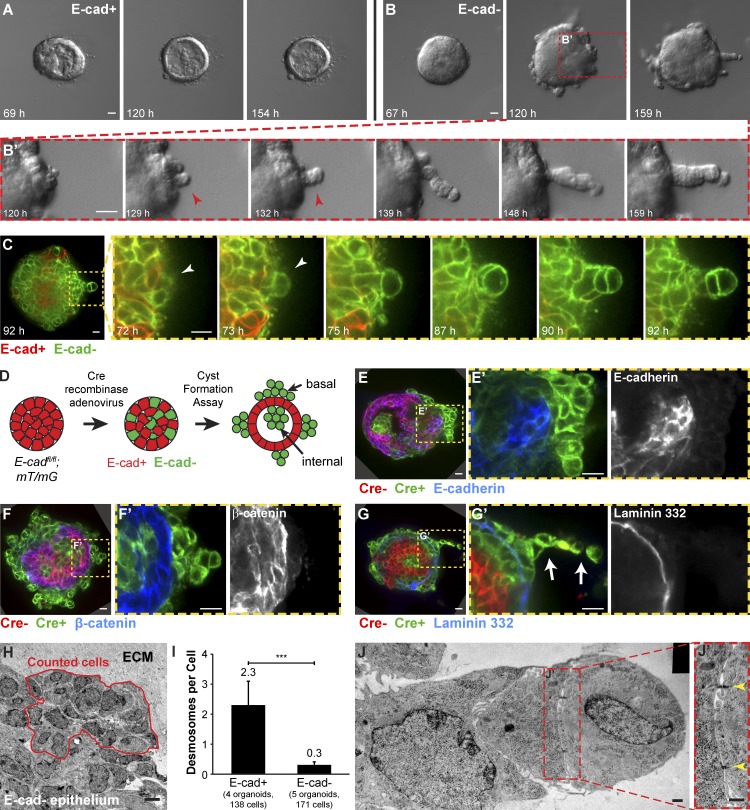
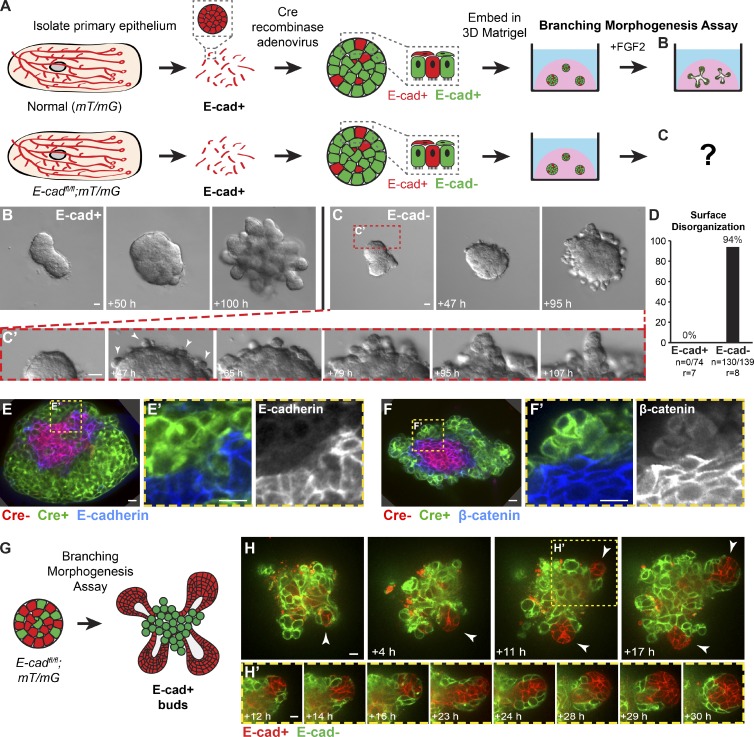
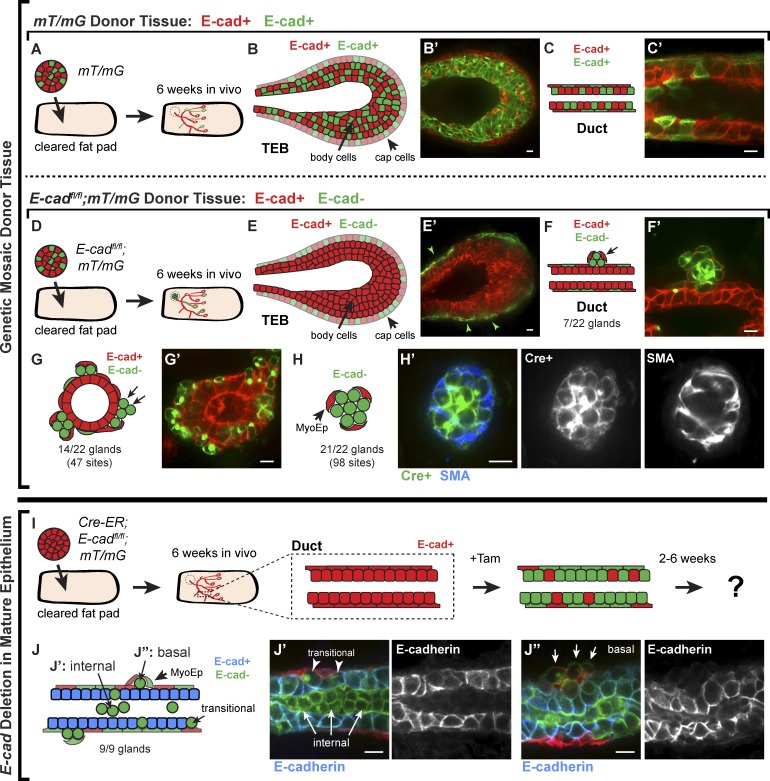
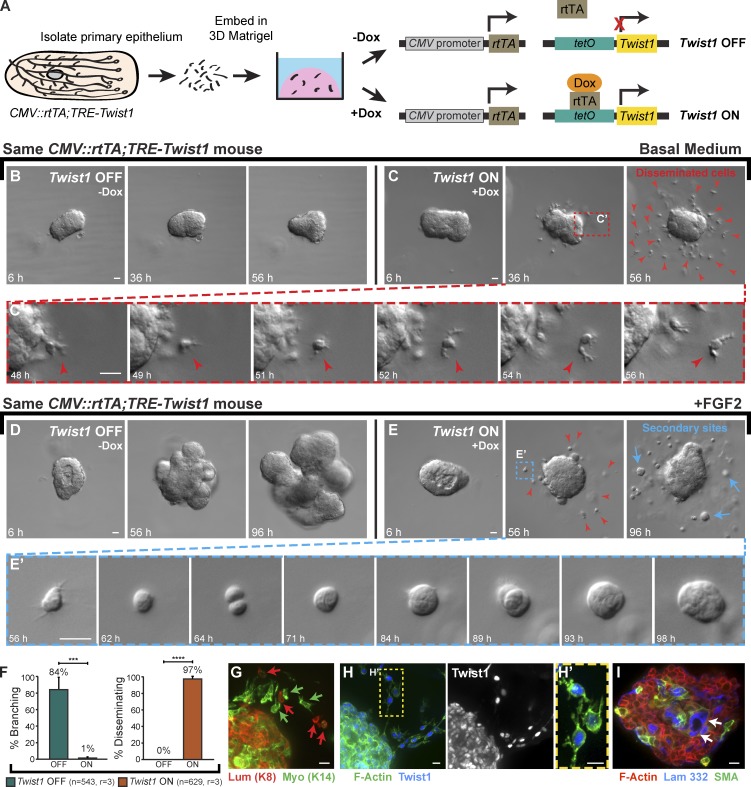
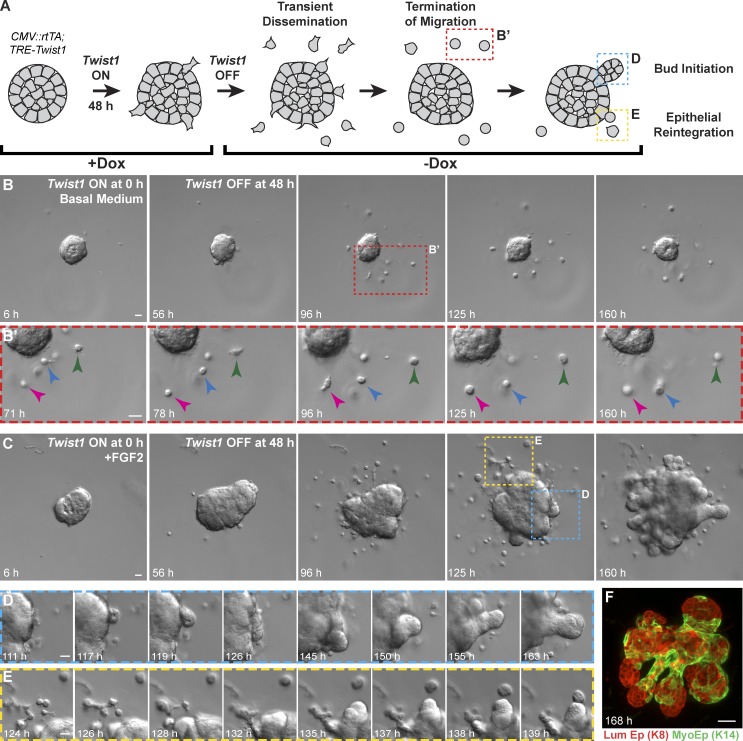
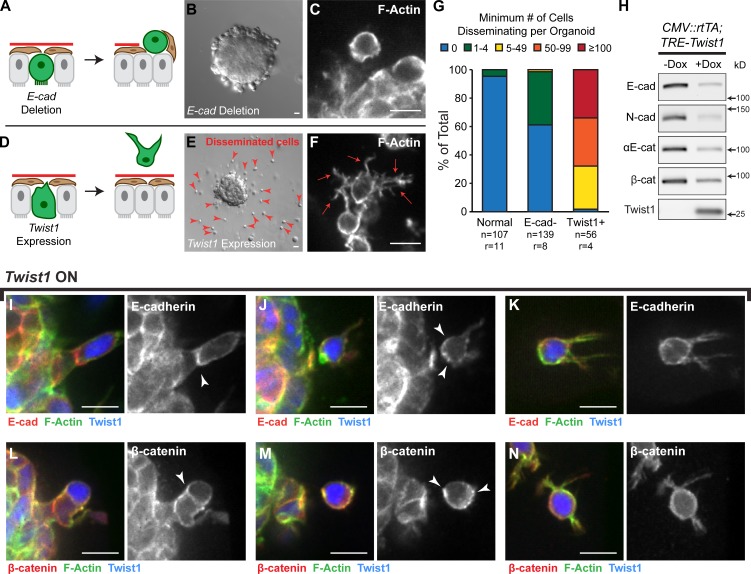
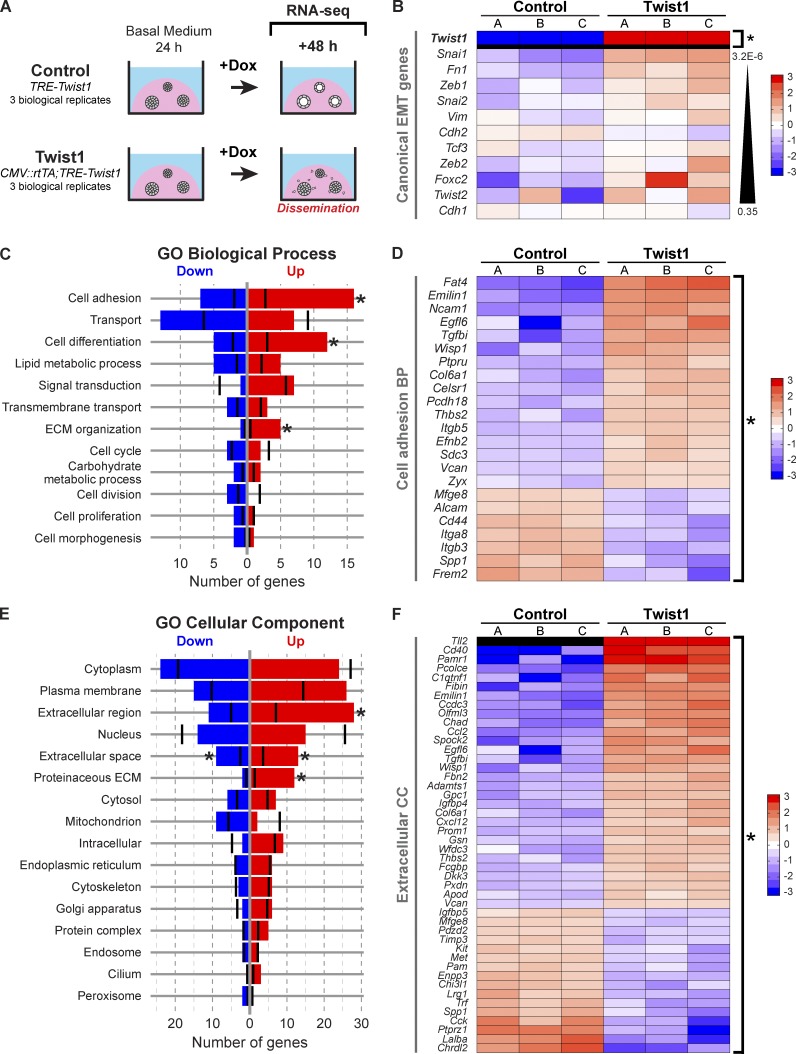
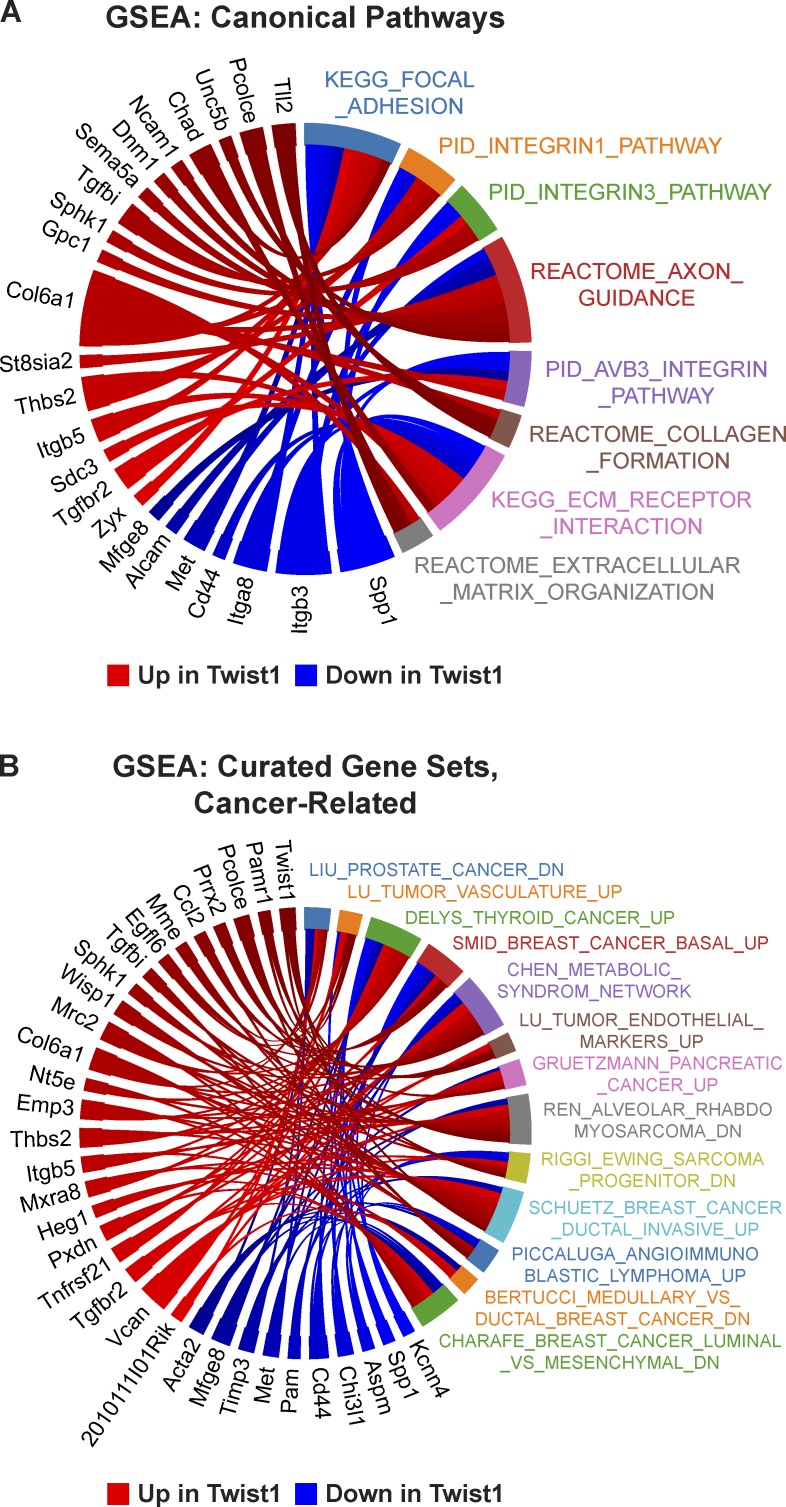
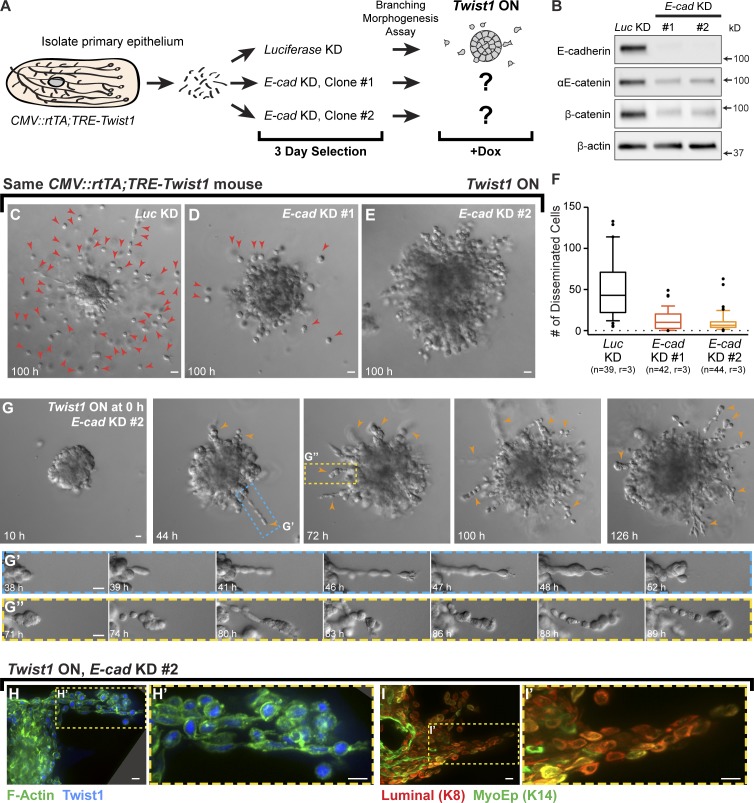
Dissemination of epithelial cells is a critical step in metastatic spread. Molecular models of dissemination focus on loss of E-cadherin or repression of cell adhesion through an epithelial to mesenchymal transition (EMT). We sought to define the minimum molecular events necessary to induce dissemination of cells out of primary murine mammary epithelium. Deletion of E-cadherin disrupted epithelial architecture and morphogenesis but only rarely resulted in dissemination. In contrast, expression of the EMT transcription factor Twist1 induced rapid dissemination of cytokeratin-positive epithelial cells. Twist1 induced dramatic transcriptional changes in extracellular compartment and cell-matrix adhesion genes but not in cell-cell adhesion genes. Surprisingly, we observed disseminating cells with membrane-localized E-cadherin and β-catenin, and E-cadherin knockdown strongly inhibited Twist1-induced single cell dissemination. Dissemination can therefore occur with retention of epithelial cell identity. The spread of cancer cells during metastasis could similarly involve activation of an epithelial motility program without requiring a transition from epithelial to mesenchymal character.


Figures

Figure 1.
Figure 1.
E-cad deletion induced loss of simple epithelial architecture. (A) E-cad deletion was induced in half of Cre-ER;E-cadfl/fl organoids with tamoxifen. (B) Control, E-cad+ organoids (−Tam) formed cysts. (C) E-cad organoids (+Tam) failed to form cysts (28/42 movies across three biological replicates) or transiently established and then lost lumens (14/42 movies). (D) E-cad deletion blocked cyst formation. n, total number of organoids; r, number of biological replicates. Error bars indicate SD. ***, P = 0.0004, two-tailed Student’s t test with equal variance. (E) Control organoids formed cysts with enrichment of E-cad and ZO-1 along apicolateral membranes (E’). (F) E-cad organoids were multilayered, lacked E-cad immunoreactivity, and displayed abnormal ZO-1 localization. Arrow indicates rare E-cad+ cells. (G) By Western blot, E-cad deletion (+Tam) resulted in complete loss of E-cad protein and significant reductions in αE-catenin and β-catenin (see also Fig. S1, A and B). Whole cell lysate samples were loaded for equal protein based on BCA analysis. (H) The Cre biosensor mT/mG was used to observe E-cad cell behaviors by confocal microscopy (Video 1). Cre+, E-cad cells (green) changed shape, from columnar to round, before shifting apically (H’ and H’’, arrowheads). Gamma adjustments were performed in E and F to improve image clarity. Bars: (B and C) 20 µm; (E, F, and H) 10 µm.
Figure 2.
Figure 2.
E-cad cells displayed reductions in multiple classes of intercellular junctions. Cre-ER;E-cadfl/+ and Cre-ER;E-cadfl/fl organoids were isolated, and widespread recombination was induced with tamoxifen. (A) Control organoids (E-cad+) maintained a smooth basal epithelial border. (B) E-cad organoids collectively migrated into Matrigel as single file columns (B’, red arrowhead). (C) Basally positioned E-cad cells (white arrowhead) were observed to round up and initiate single file cell columns. (D) Adeno-Cre was used to generate genetic mosaic organoids with a mixture of E-cad+ and E-cad cells. (E and F) Green, Cre+ cells reliably lacked E-cad (E and E’) and β-catenin (F and F’). (G) Basally positioned E-cad cells were located beyond the basement membrane protein laminin 332. Arrows in G′ indicate a single file column. (H) TEM was used to quantify desmosomes in Adeno-Cre–transduced E-cadfl/+ (control) and E-cadfl/fl organoids. Red outline indicates a representative region used for analysis. (I) E-cad epithelium had significantly fewer desmosomes compared with control E-cad+ epithelium. Error bars indicate SD. ***, P = 0.0008; two-tailed Student’s t test with equal variance. (J) Small desmosomes (J’, yellow arrowheads) were detected connecting cells in single file columns. Gamma adjustments were performed in E and F to improve image clarity. Bars: (A and B) 20 µm; (C and E–G) 10 µm; (H) 5 µm; (J) 0.5 µm. The black rectangle in the top right corner of J is a region of the image mosaic where no pixels were collected.
Figure 3.
Figure 3.
Loss of E-cad inhibited branching morphogenesis and induced epithelial disorganization in 3D culture. (A) E-cad+/+;mT/mG and E-cadfl/fl;mT/mG organoids were isolated, recombination was induced with Adeno-Cre, and branching morphogenesis was induced with FGF2. (B) E-cad+ organoids completed branching morphogenesis (Video 2). (C) E-cad organoids developed a disorganized basal surface composed of rounded cells (C’; Video 2). (D) This disorganized surface morphology was observed in 94% of E-cad organoids. n, number of time-lapse movies; r, number of biological replicates. (E and F) Basally positioned cells were green (Cre+), E-cad (E), and β-catenin (F). (G and H) In genetic mosaic organoids with a mixture of E-cad+ and E-cad cells, E-cad+ cells (red) were observed to initiate new buds (arrowheads; H’; Video 3). Bars: (B and C) 20 µm; (E, F, and H) 10 µm.
Figure 4.
Figure 4.
E-cad cells were excluded from polarized ducts and the body cell compartment of the TEB in vivo. (A) Adeno-Cre–transduced mT/mG organoids (E-cad+) were transplanted into cleared mammary fat pads, and glands were harvested after 6 wk. (B and C) Both TEBs (B) and polarized ducts (C) contained a mixture of red and green cells in the luminal and myoepithelial cell layers. (D) Adeno-Cre–transduced E-cadfl/fl;mT/mG organoids were transplanted into contralateral no. 4 glands. (E) E-cad luminal cells were markedly excluded from the body cell region of the TEB in ductal outgrowths. Arrowheads indicate green cells in the cap cell layer. (F and G) E-cad luminal cells were observed on the basal surfaces of polarized epithelium in the gland periphery (F) and near the injection site (G). (H) E-cad cells were also observed in disorganized clusters surrounded by myoepithelial cells (H’, SMA+). (I) Cre-ER;E-cadfl/fl;mT/mG organoids (E-cad+) were transplanted into cleared mammary fat pads and allowed to grow out for 6 wk. Tamoxifen was injected to induce E-cad deletion, and glands were harvested after 2–6 wk. (J) E-cad cells were observed in the lumens (J’) and on the basal surfaces (J’’) of E-cad+ polarized ducts (nine glands). Bars, 10 µm.
Figure 5.
Figure 5.
Twist1 induced robust dissemination of normal epithelial cells. (A) Organoids were isolated from CMV::rtTA;TRE-Twist1 mice, and Twist1 was induced in half of the organoids with doxycycline. (B and C) In basal medium, control organoids maintained epithelial organization (B), whereas Twist1 expression induced robust dissemination (C; Video 4). Disseminating cells (red arrowheads) migrated away from the epithelium with extensive protrusions (C’). (D and E) In FGF2-containing medium, control organoids completed branching morphogenesis (D), whereas Twist1 expression blocked branching and induced robust dissemination (E; Video 5). Red arrowheads in E indicate disseminated cells. With FGF2, disseminated cells proliferated to form secondary epithelial sites (blue arrows; E’; 6/9 biological replicates). (F) Less than 1% of Twist1+ organoids branched (***, P = 0.0006, two-tailed Student’s t test with equal variance), whereas 97% disseminated (****, P = 4 × 10⁻⁷, two-tailed Student’s t test with equal variance). n, total number of organoids; r, number of biological replicates. Error bars indicate SD. (G) Both luminal (K8+; red arrows) and myoepithelial (K14+; green arrows) cells disseminated. (H) Both disseminated single cells and cells within the main epithelial group were Twist1+. (I) Myoepithelial cells (SMA+) and basement membrane (laminin 332; arrows) were inappropriately localized to the organoid interior. Gamma adjustments were performed in H, H′, and I to improve image clarity. Bars: (B–E) 20 µm; (G–I) 10 µm.
Figure 6.
Figure 6.
Organoids recovered epithelial behaviors when Twist1 was turned off. (A) Twist1 was transiently activated in CMV::rtTA;TRE-Twist1 epithelium by a 48-h pulse of doxycycline. (B) In basal medium, organoids transiently disseminated, but disseminated cells stopped migrating after doxycycline removal (arrowheads; Video 6). (C–E) In the presence of FGF2, organoids initiated new buds after doxycycline removal (D), and disseminated cells reintegrated with the main organoid (E; Video 7). (F) Branched organoids displayed normal mammary epithelial organization, with inner luminal epithelial cells (K8+) and outer myoepithelial cells (K14+). Bars, 20 µm.
Figure 7.
Figure 7.
Twist1 induced single cell dissemination despite membrane-localized adherens junction proteins. (A and B) E-cad deletion blocks branching and induces epithelial disorganization. (C) Rare E-cad disseminated cells maintain a rounded morphology. (D and E) Twist1 expression blocks branching and induces single cell dissemination (red arrowheads). (F) Disseminated Twist1+ cells exhibit extensive actin-rich protrusions (red arrows). (G) In time-lapse movies, E-cad cells were only rarely observed to disseminate. In contrast, >100 cells per Twist1+ organoid were routinely observed to disseminate. n, number of time-lapse movies; r, number of biological replicates. (H) By Western blot, Twist1 expression resulted in reductions in protein levels of E-cad, N-cad, αE-catenin, and β-catenin (see also Fig. S3, A and B). Whole cell lysate samples were loaded for equal protein based on BCA analysis. (I–N) Membrane-localized E-cad and β-catenin (arrowheads) were detected in basally positioned cells protruding into the ECM (I and L), in cells that had just disseminated (J and M), and in disseminated cells migrating through the ECM (K and N). Bars: (B and E) 20 µm; (C, F, and I–N) 10 µm.
Figure 8.
Figure 8.
Twist1 induced changes in genes regulating cell–ECM interactions and the extracellular space. (A) RNA-seq was used to compare gene expression 48 h after Twist1 induction in control versus Twist1+ organoids. (B) Heat map of canonical EMT genes. Only Twist1 was significantly differentially expressed. Genes are sorted by increasing p-value. (C–F) The 183 DE genes were mapped to direct associations with GO Slim biological process (C) and cellular component (E) terms. Black vertical bars indicate the expected number of DE genes per category. Asterisks specify significantly enriched terms. (D) DE genes associated with cell adhesion. (F) DE genes associated with extracellular space, extracellular region, and proteinaceous ECM. Genes are sorted by descending fold change in D and F. BP, biological process; CC, cellular component.
Figure 9.
Figure 9.
Significantly enriched pathways relate to cell–matrix adhesion. Gene set enrichment analysis (GSEA) identified eight significant canonical pathways (A), all related to cell–matrix adhesion and ECM organization, and 51 significant curated gene sets, 13 of which were characterized as cancer related (B). The Circos plots depict DE genes associated with each gene set. PID, Pathway Interaction Database.
Figure 10.
Figure 10.
E-cad is required for Twist1-induced single cell dissemination. (A) Organoids from CMV::rtTA;TRE-Twist1 mice were divided into three groups for treatment with lentiviral shRNA against Luc or E-cad (two clones). Puromycin was used to select for transduced cells. Organoids were monitored for dissemination after Twist1 induction. (B) E-cad shRNA induced loss of E-cad protein and reductions in αE-catenin and β-catenin. Whole cell lysate samples were loaded for equal protein based on BCA analysis. (C–E) In FGF2-containing medium with doxycycline, E-cad KD organoids disseminated significantly fewer cells than Luc KD organoids (Video 8). Red arrowheads in C and D indicate disseminated cells. (F) Disseminated cells per organoid were quantified from movies after 100 h of Twist1 induction. E-cad KD significantly reduced single cell dissemination. Box-and-whisker plots are drawn with the box extending from the 25th to 75th percentiles and whiskers at the 10th and 90th percentiles. n, number of time-lapse movies; r, number of biological replicates. P < 0.0001 between Luc shRNA and E-cad shRNA #1 or #2; P = 0.014 between E-cad shRNA #1 and #2 (negative binomial generalized estimating equations model). (G) E-cad KD organoids extended collective chains of cells into the matrix (orange arrowheads; Video 9; G’ and G’’). (H and I) Cells within collective chains stained positive for Twist1 and luminal (K8+) and/or myoepithelial (K14+) cytokeratins. Bars: (C–E and G) 20 µm; (H and I) 10 µm.

References

    1. Abramoff M.D., Magalhaes P.J., Ram S.J. 2004. Image processing with ImageJ. Biophotonics International. 11:36–42
    1. Anders S. 2010. HTSeq: Analysing high-throughput sequencing data with Python. Available at http://www-huber.embl.de/users/anders/HTSeq/doc/index.html (Accessed on December 26, 2012) - PMC - PubMed
    1. Anders S., Huber W. 2010. Differential expression analysis for sequence count data. Genome Biol. 11:R106 10.1186/gb-2010-11-10-r106 - DOI - PMC - PubMed
    1. Ashburner M., Ball C.A., Blake J.A., Botstein D., Butler H., Cherry J.M., Davis A.P., Dolinski K., Dwight S.S., Eppig J.T., et al. 2000. Gene ontology: tool for the unification of biology. Nat. Genet. 25:25–29 10.1038/75556 - DOI - PMC - PubMed
    1. Badea T.C., Wang Y., Nathans J. 2003. A noninvasive genetic/pharmacologic strategy for visualizing cell morphology and clonal relationships in the mouse. J. Neurosci. 23:2314–2322 - PMC - PubMed

Publication types

MeSH terms