. 2014 Apr;124(4):1608-21.
doi: 10.1172/JCI71195. Epub 2014 Mar 3.

Endothelial mitochondrial oxidative stress determines podocyte depletion in segmental glomerulosclerosis

Endothelial mitochondrial oxidative stress determines podocyte depletion in segmental glomerulosclerosis

Ilse Daehn et al. J Clin Invest. 2014 Apr.

Abstract

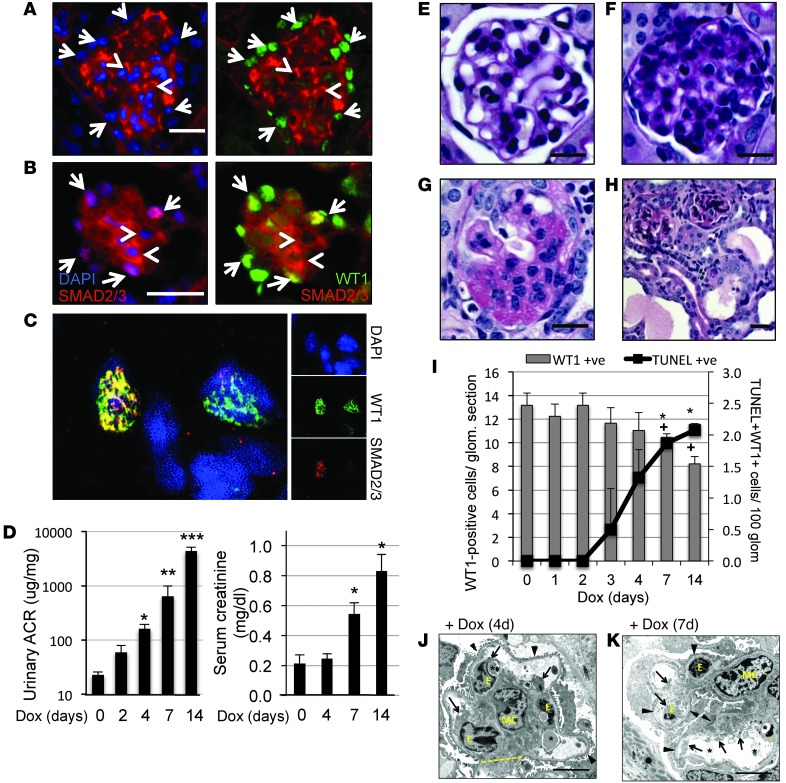
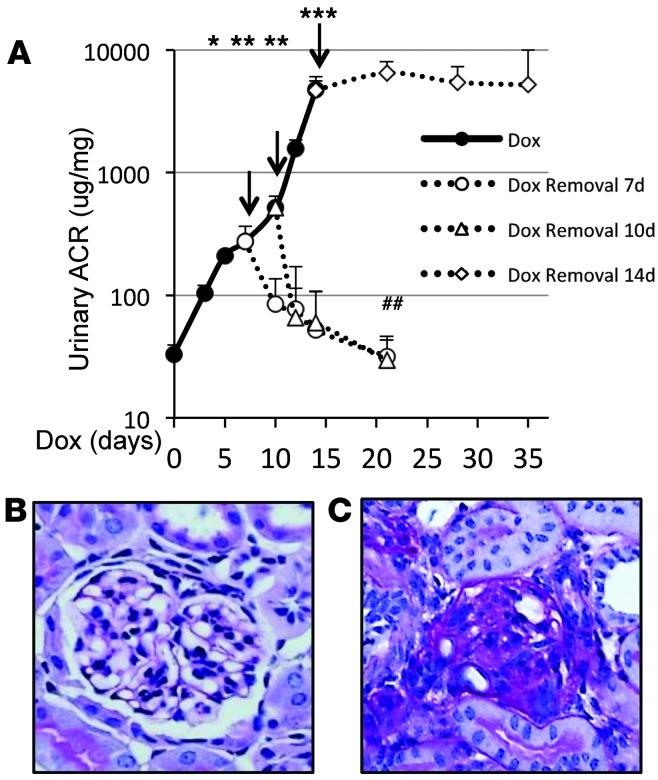
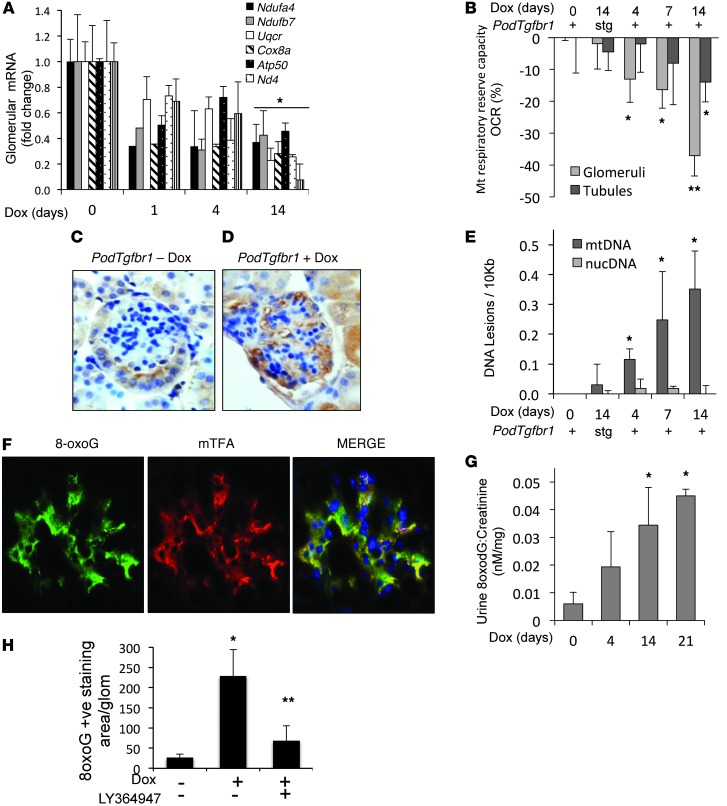
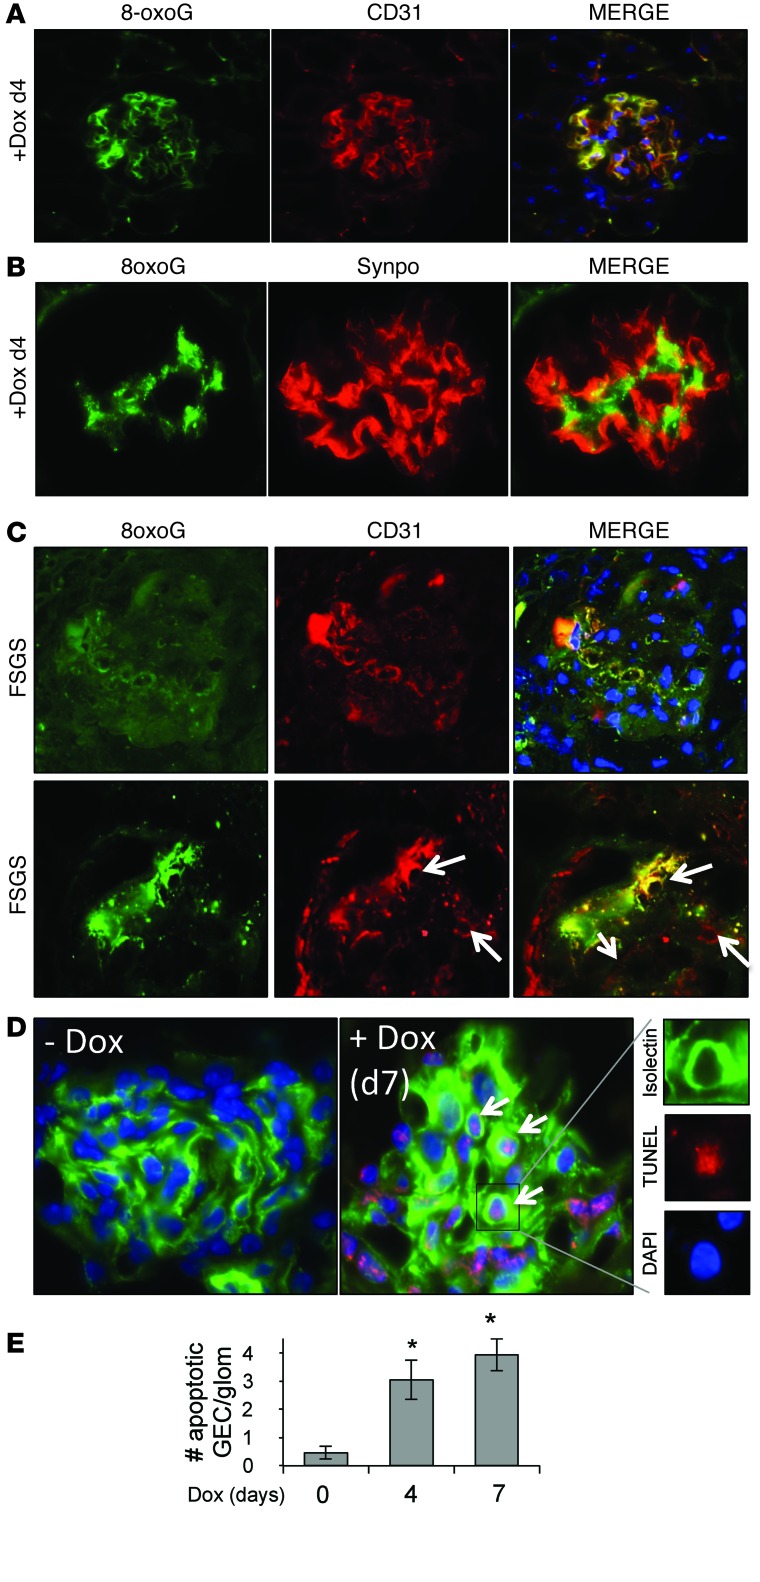
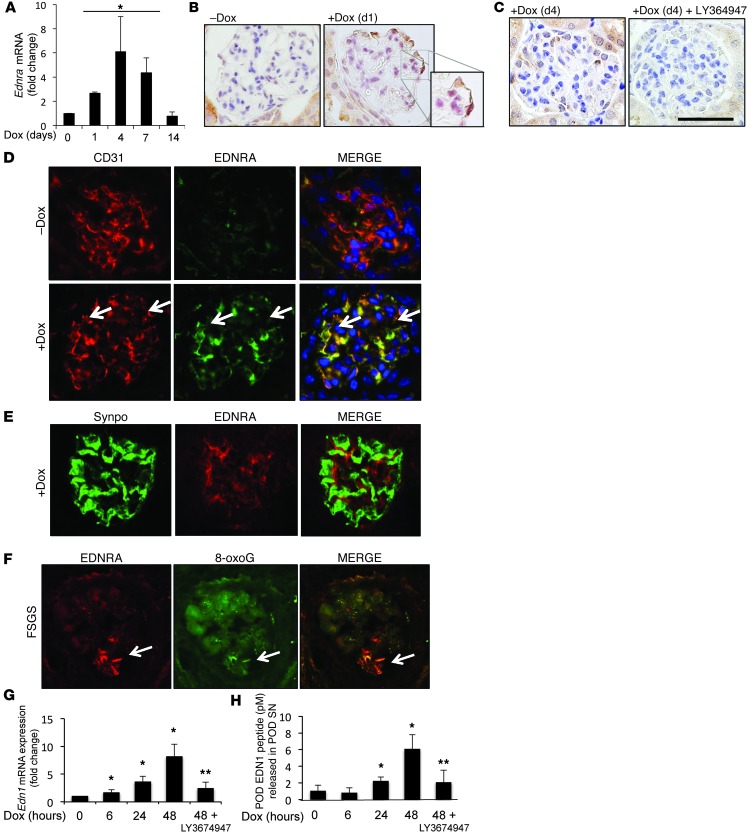
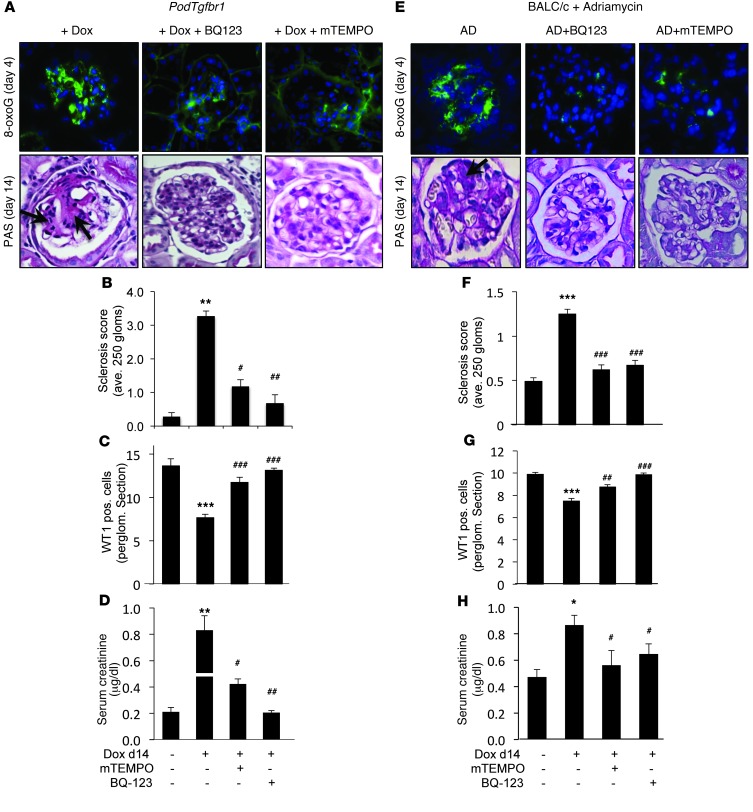
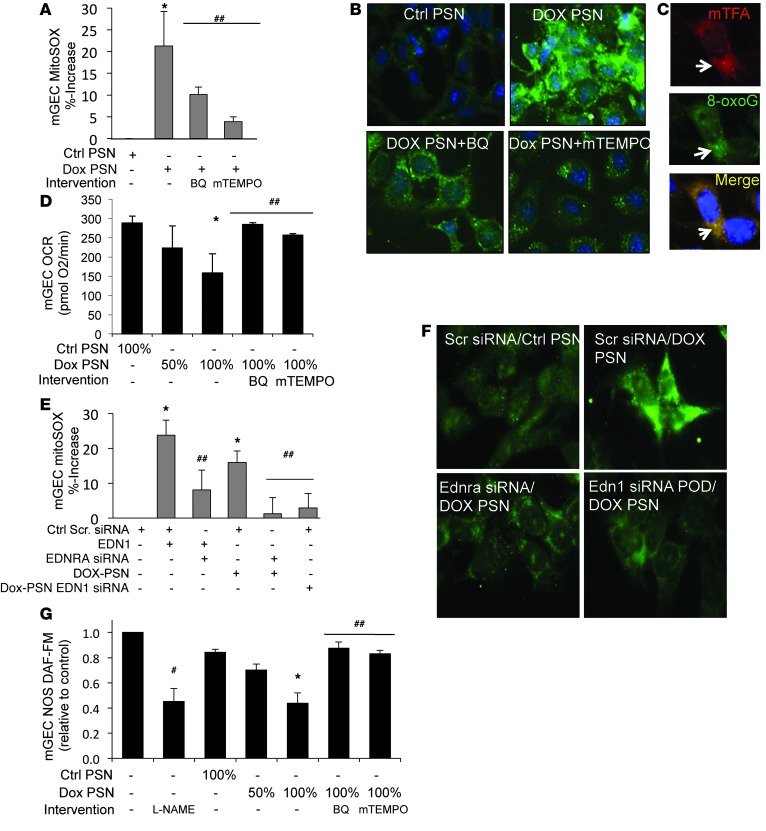
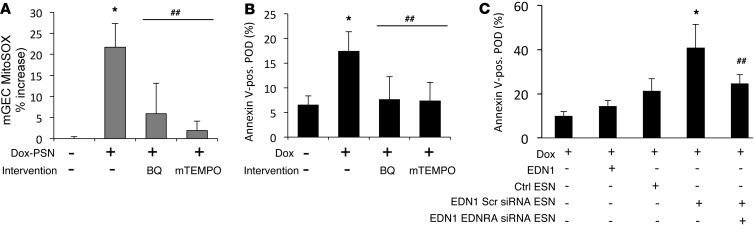
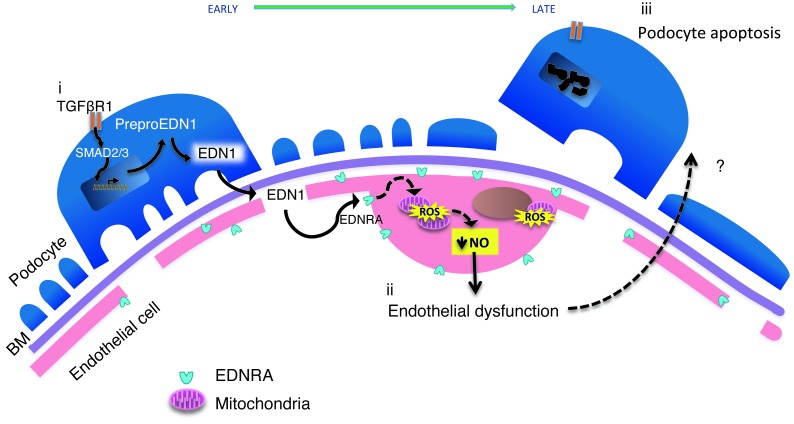
Focal segmental glomerular sclerosis (FSGS) is a primary kidney disease that is commonly associated with proteinuria and progressive loss of glomerular function, leading to development of chronic kidney disease (CKD). FSGS is characterized by podocyte injury and depletion and collapse of glomerular capillary segments. Progression of FSGS is associated with TGF-β activation in podocytes; however, it is not clear how TGF-β signaling promotes disease. Here, we determined that podocyte-specific activation of TGF-β signaling in transgenic mice and BALB/c mice with Adriamycin-induced glomerulosclerosis is associated with endothelin-1 (EDN1) release by podocytes, which mediates mitochondrial oxidative stress and dysfunction in adjacent endothelial cells via paracrine EDN1 receptor type A (EDNRA) activation. Endothelial dysfunction promoted podocyte apoptosis, and inhibition of EDNRA or scavenging of mitochondrial-targeted ROS prevented podocyte loss, albuminuria, glomerulosclerosis, and renal failure. We confirmed reciprocal crosstalk between podocytes and endothelial cells in a coculture system. Biopsies from patients with FSGS exhibited increased mitochondrial DNA damage, consistent with EDNRA-mediated glomerular endothelial mitochondrial oxidative stress. Our studies indicate that segmental glomerulosclerosis develops as a result of podocyte-endothelial crosstalk mediated by EDN1/EDNRA-dependent mitochondrial dysfunction and suggest that targeting the reciprocal interaction between podocytes and endothelia may provide opportunities for therapeutic intervention in FSGS.


Figures

Figure 1
Figure 1. Activation of podocyte-specific TGFβR1 induces podocytopathy with progressive glomerular disease and renal failure.
Representative glomerular triple-immunofluorescence staining in PodTgfbr1 mice on (A) regular chow and (B) after 2 days of Dox chow, showing SMAD2/3 and DAPI and SMAD2/3 and WT1 localization. Arrows depict nuclear WT1 and DAPI in podocytes in A and colocalization with SMAD2/3 in B. Arrowheads denote cytoplasmic SMAD2/3 staining. (C) Superresolution image of SMAD2/3 (red) specifically localized to WT1- (green) and DAPI-positive (blue) cells. (D) ACR in PodTgfbr1 mice treated with Dox (days 0–14; n = 6 mice per group) and serum creatinine in Dox-treated PodTgfbr1 mice (n = 5 mice per group; mean ± SEM). (EH) Histopathology stain (PAS) of PodTgfbr1 mice: (E) control mice without Dox, (F) day 4 of Dox, (G) day 14 of Dox, and (H) day 14 of Dox. (I) Podocyte number (gray bars) and podocyte apoptosis (black line) of Dox-treated PodTgfbr1 mice (mean ± SD; >50 glomerular profiles per mouse; >5 mice per time point). (J) Ultrastructural analysis by electron microscopy of day 4 Dox PodTgfbr1 mice. Glomerular area with mesangial expansion and endothelial cells (E) that protrude (arrows) and shed material (asterisks) into capillary lumens. Podocytes show normal foot process pattern (arrowheads). MC, mesangial cell. (K) Electron microscopy images of day 7 Dox PodTgfbr1 mice. Glomerular area with similar mesangial and endothelial changes. Podocytes show extensive foot process effacement (arrowheads). Scale bar: 50 μm (A, B, and EH); 5 μm (J and K). Original magnification, ×63 (A, B, and EG); ×100 (C); ×20 (H). *P < 0.05, **P < 0.01, ***P < 0.001 versus controls.
Figure 2
Figure 2. TGFβR1 signaling in podocyte-induced albuminuria is reversible at days 7 and 10 but not day 14 of Dox treatment.
(A) ACR in PodTgfbr1 mice treated with Dox (days 0–14) (>10 mice per time point). Arrows indicate Dox withdrawal at day 7, day 10, or day 14 for mice returned to normal diet (n = 6 per time point; mean ± SEM). (B) Representative image of a PodTgfbr1 mouse with 2 weeks of recovery after days 10 of Dox withdrawal. (C) Representative image of a PodTgfbr1 mouse with 3 weeks of recovery after days 14 of Dox withdrawal. *P < 0.05, **P < 0.01, ***P < 0.001 versus controls; ##P < 0.01 versus time of Dox withdrawal, i.e., 7 days and 10 days. Original magnification, ×40 (B and C).
Figure 3
Figure 3. TGF-β signaling in podocytes decreased mitochondrial genes and function and increased mtDNA damage in glomerular epithelial cells.
(A) mRNA expression of mitochondrial proteins in isolated glomeruli from PodTgfbr1 mice after Dox for 0 to 14 days (n = 3; mean ± SEM). (B) Mitochondrial respiratory reserve capacity was measured by OCR of isolated glomeruli and tubules in single transgenic mice (stg) or double-transgenic PodTgfbr1 mice (+) treated with Dox for the days indicated (values are mean percentage reduction in OCR ± SEM; n = 8 mice per time point). (C) Immunoperoxidase detecting 3-nitrotyrosine in control untreated PodTgfbr1 (–Dox) and (D) day 4 Dox-treated PodTgfbr1 (+Dox) mice. (E) Quantification of lesion frequencies in mtDNA and nuclear DNA by QPCR in isolated glomeruli of stg or PodTgfbr1 mice treated with Dox for up to day 14 relative to untreated day 0 controls (n = 6; mean ± SEM relative amplification normalized to nondamaged day 0 controls). (F) Representative images of double immunofluorescence detection of 8-oxoG (green) and mitochondrial transcription factor A (mTFA; red) in glomeruli of a day 4 Dox-treated PodTgfbr1 mouse. (G) Urine 8-oxodG relative to urine creatinine in PodTgfbr1 mice left untreated (control) or treated with Dox for up to 21 days (n = 6; mean ± SEM). (H) Quantification of 8-oxoG staining of glomeruli from Dox control PodTgfbr1 mice, mice fed Dox chow for 7 days, or Dox-fed PodTgfbr1 mice treated with 1 mg/kg LY364947 from day 4 to day 7 (mean ± SEM). *P < 0.05, **P < 0.01 versus controls. Original magnification, ×40 (C and D); ×100 (F).
Figure 4
Figure 4. TGF-β signaling in podocytes induces oxidative stress specifically in endothelial cells.
(A) Representative double-immunofluorescence images of 8-oxoG (green), endothelial cell marker CD31 (red), and merge showing colocalization. (B) Representative double-immunofluorescence images of 8-oxoG (green), podocyte marker synaptopodin (red), and merge in glomeruli of a day 4 Dox-treated PodTgfbr1 mouse showing no colocalization in podocytes. (C) 8-oxoG (green) and endothelial cell marker CD31 (red) in glomeruli of kidney biopsies from subjects diagnosed with FSGS. Higher-magnification images showing capillary loops are shown on the bottom row (arrows) (original magnification, ×63). (D) Immunofluorescence staining showing TUNEL and isolectin localization with DAPI in untreated mice and mice treated with Dox for 7 days. Arrows depict nuclear TUNEL with DAPI- and isolectin-positive endothelial cells. (E) Quantification of TUNEL- and isolectin-positive cells per glomeruli in untreated PodTgfbr1 mice and in PodTgfbr1 mice treated with Dox for 4 or 7 days (*P < 0.05; mean ± SD). Original magnification, ×63 (A, B, C [bottom row], and D); ×40 (C [top row]).
Figure 5
Figure 5. TGF-β signaling in podocytes induces EDNRA specifically in endothelial cells.
(A) Quantification by RT-PCR of Ednra mRNA in isolated glomeruli of untreated control PodTgfbr1 mice and PodTgfbr1 mice at day 1 to day 14 of Dox diet (n = 3 mice per group; mean ± SEM; *P < 0.05 versus controls). (B) Immunoperoxidase detection of preproendothelin-1 in control untreated PodTgfbr1 mice or mice with Dox treatment for 1 day (original magnification, ×100 [inset]) or (C) 4 days with or without LY364947 (1 mg/kg). Scale bar: 50 μm. (D) Representative double-immunofluorescence detection of endothelial cell marker CD31 (red) and EDNRA (green) in glomeruli of untreated or day 7 Dox-treated PodTgfbr1 mice. (E) Synaptopodin (green) and EDNRA (red) in glomeruli of a day 7 Dox-treated PodTgfbr1 mouse showing no colocalization in podocytes. (F) EDNRA (red) and 8-oxoG (green) in kidney biopsy from a subject diagnosed with FSGS. (G) mRNA expression of Edn1 and Ednra by POD cell line treated with Dox (1 μg/ml) without or with LY364947 (3 μM) for 0, 6, 24, and 48 hours. (H) Quantification by ELISA of EDN1 release in SN by POD cells treated with DOX for 6 to 48 hours without or with LY364947. Colocalization is indicated by arrows in D and F. Mean ± SEM of 3 independent experiments (A, G, and H). *P < 0.05, **P < 0.01 versus untreated controls. Original magnification, ×63 (D and E); ×40 (F).
Figure 6
Figure 6. TGF-β signaling in podocytes induces specific EDN1-mediated mitochondrial oxidative stress specifically in endothelial cells.
(A) Immunofluorescence detection of mtDNA 8-oxoG in kidneys of day 4 Dox PodTgfbr1 mice, showing prominent glomerular staining; day 4 Dox PodTgfbr1 mice cotreated with BQ-123 (0.1 nM/kg/d); or day 4 Dox PodTgfbr1 mice cotreated with mitoTEMPO (1 mg/kg/d). PAS staining of day 14 Dox PodTgfbr1 kidneys, showing severe sclerosis (arrows), and day 14 Dox PodTgfbr1 kidneys cotreated with BQ-123 (0.1 nM/kg/d) or with mitoTEMPO (1 mg/kg/d). (B) Sclerosis index score (see Supplemental Methods). (C) Podocyte number and (D) serum creatinine levels of untreated PodTgfbr1 mice, Dox-treated PodTgfbr1 mice (day 14), or Dox-treated PodTgfbr1 mice cotreated with BQ-123 or mitoTEMPO (n = 5; mean ± SEM). (E) Immunofluorescence for 8-oxoG in kidneys of BALB/c mice after AD treatment, treatment with AD and BQ-123 (0.1 nM/kg/d), or treatment with AD and mitoTEMPO (1 mg/kg/d). PAS staining of glomeruli of BALB/c mice after AD treatment, showing severe sclerosis; after cotreatment with AD and BQ-123; or after cotreatment with AD and mitoTEMPO. (F) Sclerosis index score. (G) Podocyte number and (H) serum creatinine levels in BALB/c mice with or without AD treatment or with cotreatment with AD and BQ-123 or AD and mitoTEMPO (n = 6; mean ± SEM). (B, C, F, and G) Mean ± SEM of at least 250 glomeruli from 5 to 8 mice per group. *P < 0.05, **P < 0.01, ***P < 0.001 versus control mice. #P < 0.05, ##P < 0.01, ###P < 0.001 versus mice treated with Dox or AD only. Original magnification, ×63 (A and E).
Figure 7
Figure 7. Validation of in vivo results using a defined PodTgfbr1-derived podocyte and in mGEC coculture system.
(A) Percentage increase of MitoSOX bright fluorescent mGECs after culture with Control-PSN or Dox-PSN (1 μg/ml) for 24 hours in the absence or presence of BQ-123 (1 ng/ml) or mitoTEMPO (5 μg/ml). (B) Immunofluorescence detection of 8-oxoG in mGECs cultured as described in A. (C) Double-immunofluorescence detection of 8-oxoG (green) and mitochondrial transcription factor A (red) in mGECs cocultured in Dox-PSN (arrows indicates colocalization). (D) OCR in mGECs cultured 24 hours with 100% Control-PSN or 50% or 100% Dox-PSN in the absence or presence of BQ-123 or mitoTEMPO. (E) Percentage increase of MitoSOX fluorescent mGECs transfected with control SCR siRNA or EDNRA siRNA and treated with EDN1 (200 nM), Dox-PSN, or Dox-PSN from EDN1 siRNA-transfected podocytes. (F) 8-oxoG immunofluorescence in mGECs transfected with control SCR siRNA or EDNRA siRNA and cultured 24 hours with either Control-PSN or Dox-PSN, as indicated. (G) NOS activity detected by DAF-FM fluorescence in mGECs in RPMI control media without or with L-NAME (100 μM) or in mGECs cultured for 24 hours with 100% Control-PSN or 50% to 100% Dox-PSN in absence or presence of BQ-123 or mitoTEMPO. (A, D, E, and G) Each bar represents n = 3; mean ± SEM. *P < 0.05 versus SN controls, #P < 0.05 versus RPMI controls, ##P < 0.05 versus Dox. Cocultures performed in 10% FCS. Original magnification, ×100 (B, C, and F).
Figure 8
Figure 8. EDN1-mediated endothelial cell mitochondrial oxidative stress and dysfunction are required for podocyte apoptosis induced by TGF-β/SMAD signaling in cell death.
(A) Percentage of MitoSOX bright fluorescent mGECs after 48 hours transwell coculture with POD cells with or without Dox or Dox in the presence of BQ-123 (1 ng/ml) or mitoTEMPO (5 μg/ml). (B) Percentage apoptotic POD cells after coculture with mGECs in transwell inserts without or with Dox or Dox in the presence of BQ-123 (1 ng/ml) or mitoTEMPO (5 μg/ml) for 48 hours. (C) POD cells treated with Dox were treated directly with EDN1 or cultured with control mGEC SN (Ctl ESN), SN from EDN1-treated mGECs transfected with scrambled siRNA (EDN1 SCR siRNA ESN), or SN from EDN1-treated mGECs transfected with EDNRA siRNA (EDN1 EDNRA siRNA ESN), as indicated. Cocultures performed in 10% FCS. For all histograms, each bar represents n = 3 independent experiments ± SEM. *P < 0.05 versus SN controls, #P < 0.05 versus RPMI controls, ##P < 0.05 versus Dox.
Figure 9
Figure 9. Working model of podocyte–glomerular endothelial cell crosstalk.
(i) Podocyte selective injury by TGFβR1 activation (or loss of miRNA [Dicer KO] or treatment with AD) results in SMAD2/3-mediated preproendothelin-1 synthesis and release of EDN1 as well as increased EDNRA on cell surface of glomerular endothelial cells. (ii) Podocyte-derived EDN1 acts on endothelial cells with increased EDNRA expression to induce mitochondrial ROS, mtDNA damage, mitochondrial dysfunction, and endothelial dysfunction with decreased NO synthesis. (iii) Factors that are either applied or deficient in dysfunctional endothelial cells are required for foot process effacement, apoptosis, and/or detachment of podocytes.

References

    1. United States Renal Data System. Atlas of Chronic Kidney Disease and End-Stage Renal Disease in the United States. USRDS 2011 Annual Data Report. In: NIH, ed. Bethesda, Maryland, USA: National Institute of Diabetes and Digestive and Kidney Diseases; 2011.
    1. Shlipak MG, et al. Cardiovascular mortality risk in chronic kidney disease: comparison of traditional and novel risk factors. JAMA. 2005;293(14):1737–1745. doi: 10.1001/jama.293.14.1737. - DOI - PubMed
    1. Agarwal S, Shlipak MG, Kramer H, Jain A, Herrington DM. The association of chronic kidney disease and metabolic syndrome with incident cardiovascular events: multiethnic study of atherosclerosis. Cardiol Res Pract. 2012;2012:806102. - PMC - PubMed
    1. D’Agati VD, Kaskel FJ, Falk RJ. Focal segmental glomerulosclerosis. N Engl J Med. 2011;365(25):2398–2411. doi: 10.1056/NEJMra1106556. - DOI - PubMed
    1. Fogo AB, Kon V. The glomerulus — a view from the inside — the endothelial cell. Int J Biochem Cell Biol. 2010;42(9):1388–1397. doi: 10.1016/j.biocel.2010.05.015. - DOI - PubMed

Publication types

MeSH terms

Substances