. 2014 Mar 10;211(3):457-72.
doi: 10.1084/jem.20131587. Epub 2014 Mar 3.

Interplay of host microbiota, genetic perturbations, and inflammation promotes local development of intestinal neoplasms in mice

Affiliations

Interplay of host microbiota, genetic perturbations, and inflammation promotes local development of intestinal neoplasms in mice

Gerold Bongers et al. J Exp Med. .

Abstract

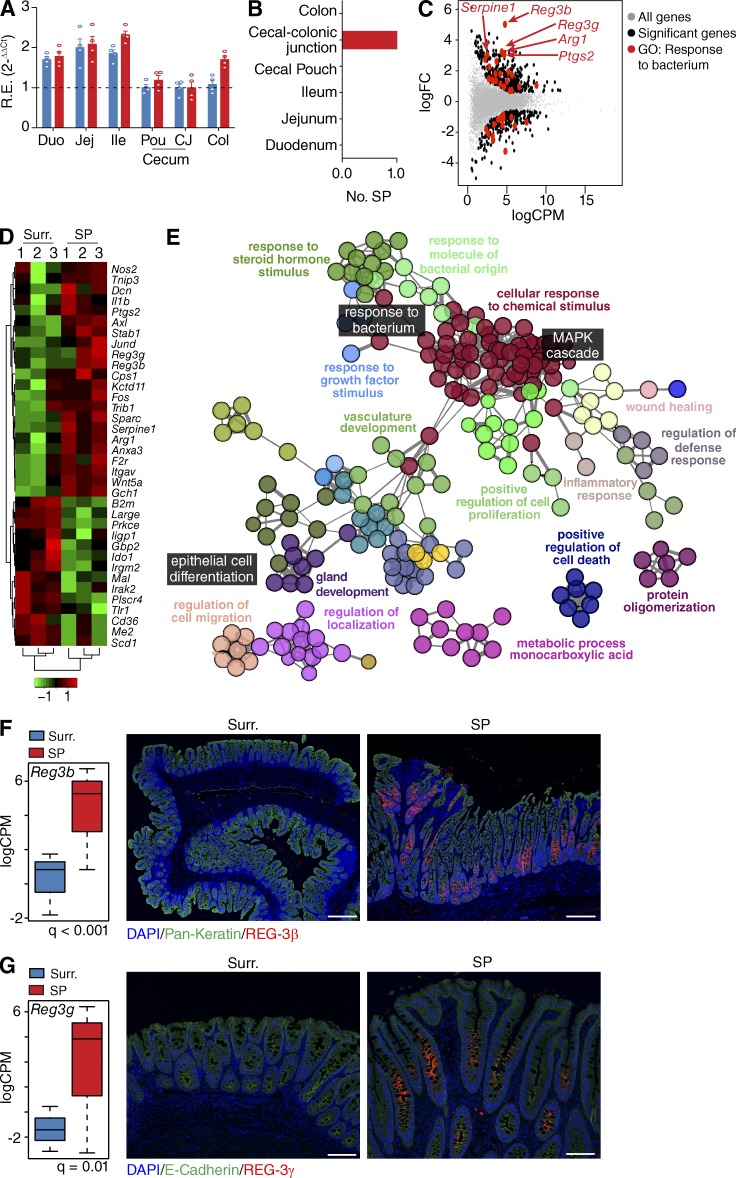
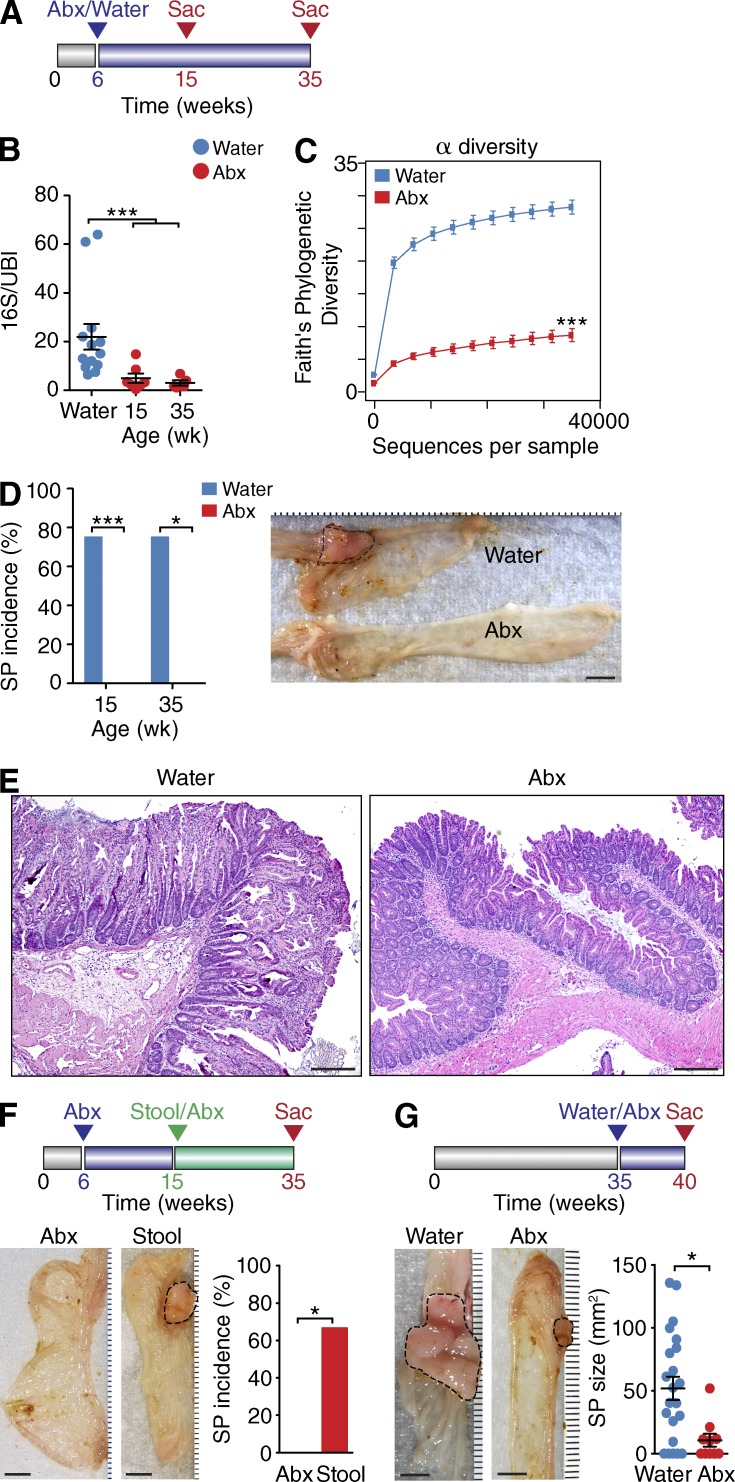
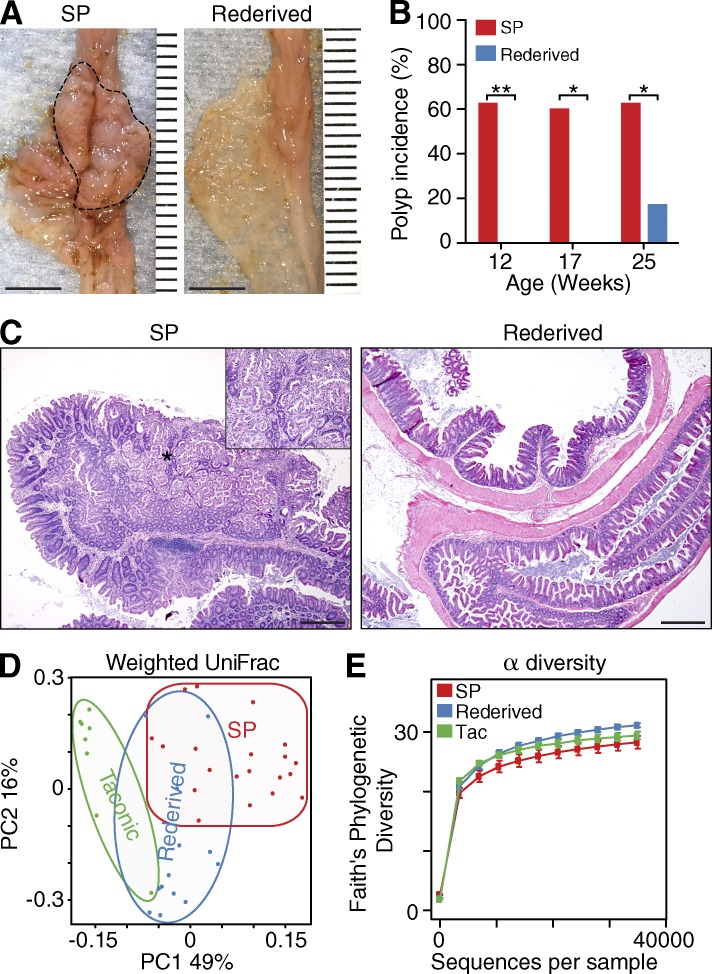
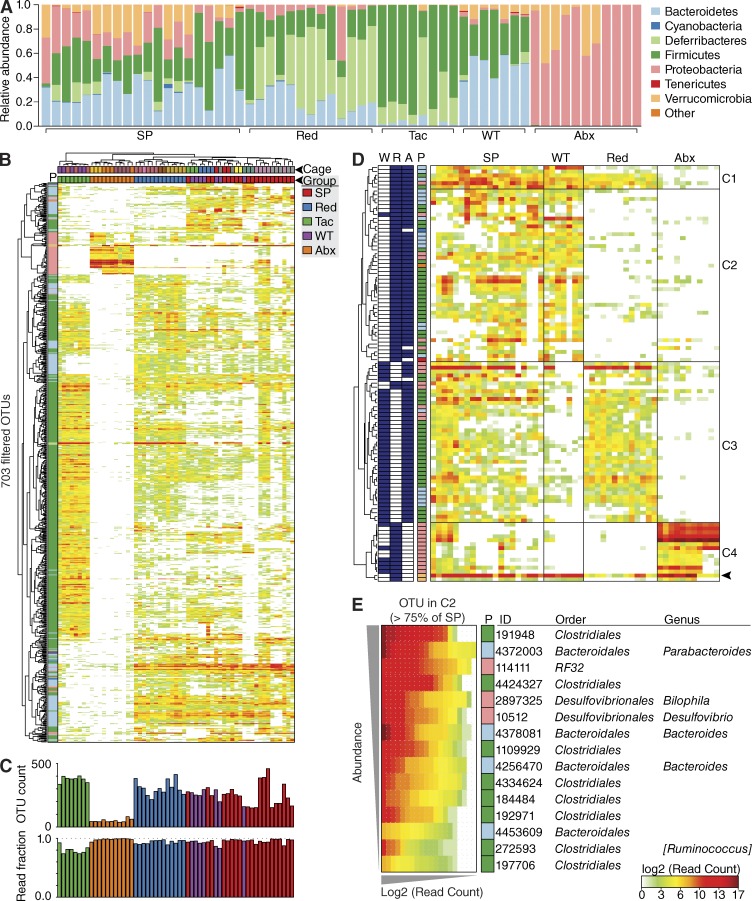
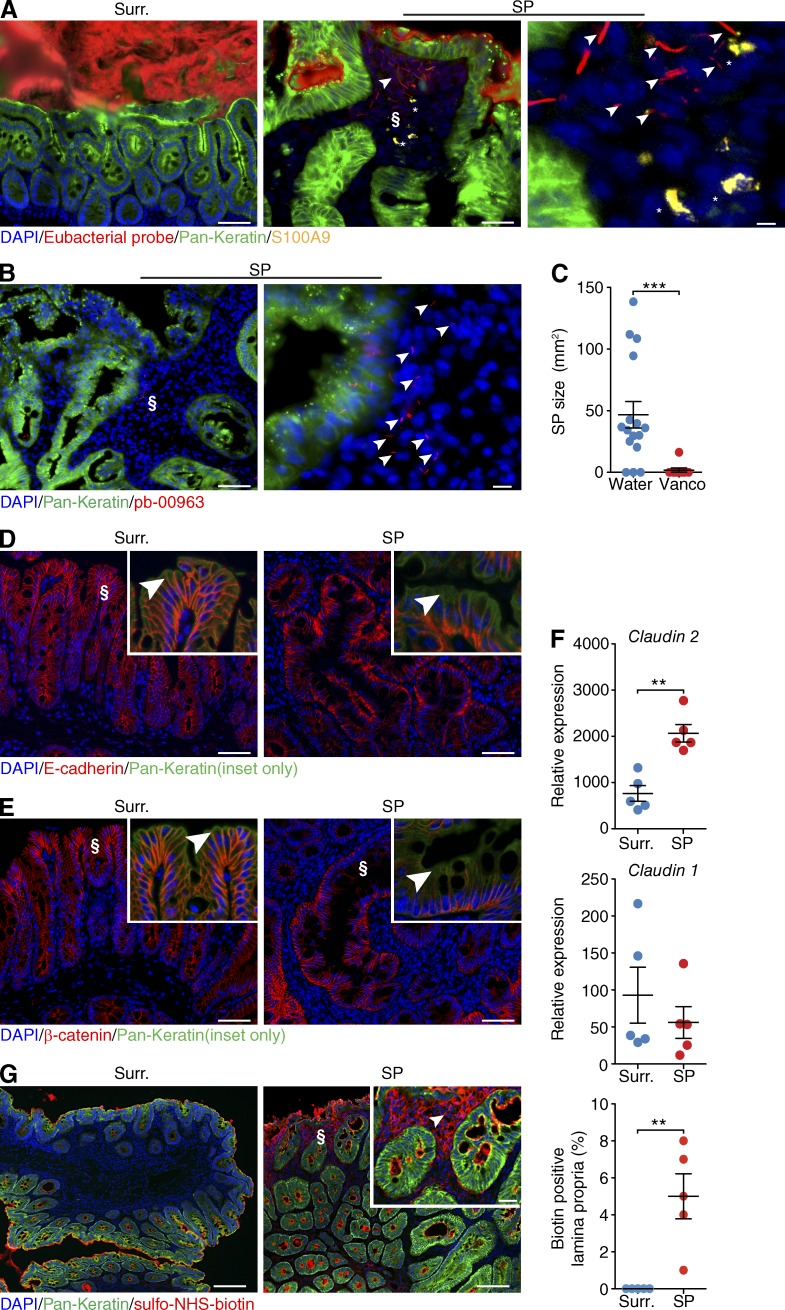
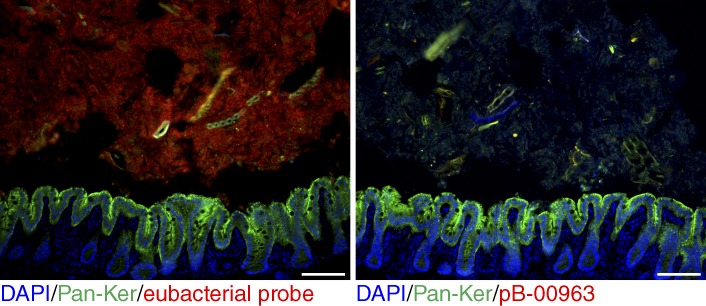
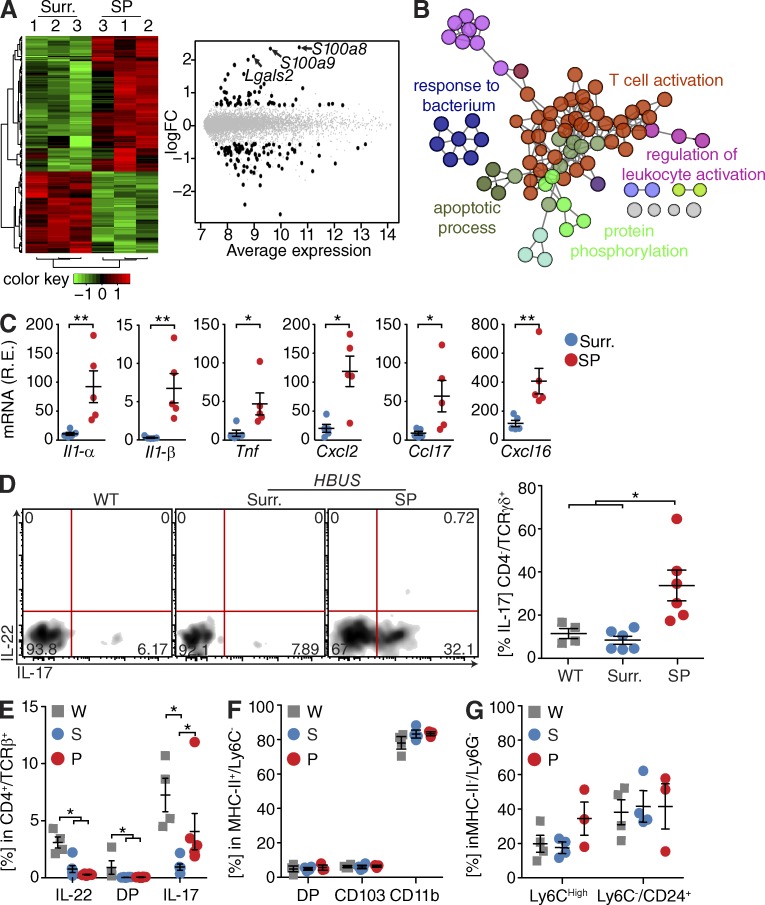
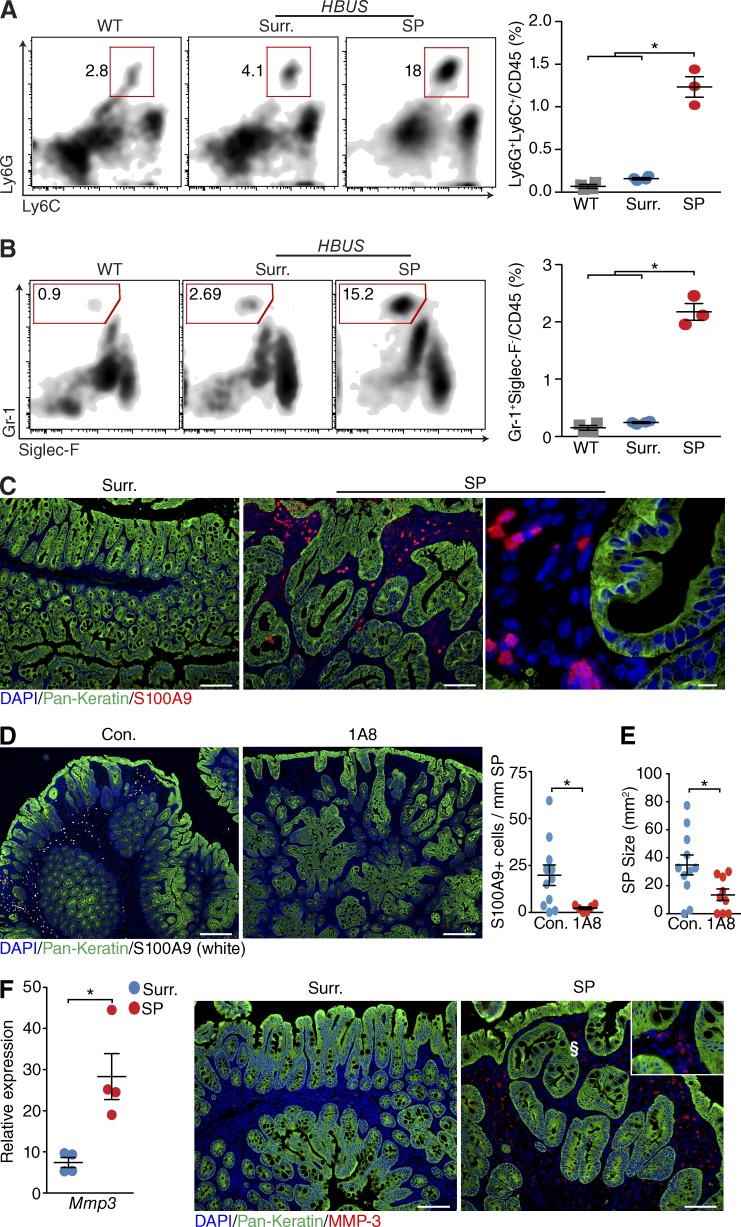
The preferential localization of some neoplasms, such as serrated polyps (SPs), in specific areas of the intestine suggests that nongenetic factors may be important for their development. To test this hypothesis, we took advantage of transgenic mice that expressed HB-EGF throughout the intestine but developed SPs only in the cecum. Here we show that a host-specific microbiome was associated with SPs and that alterations of the microbiota induced by antibiotic treatment or by embryo transfer rederivation markedly inhibited the formation of SPs in the cecum. Mechanistically, development of SPs was associated with a local decrease in epithelial barrier function, bacterial invasion, production of antimicrobials, and increased expression of several inflammatory factors such as IL-17, Cxcl2, Tnf-α, and IL-1. Increased numbers of neutrophils were found within the SPs, and their depletion significantly reduced polyp growth. Together these results indicate that nongenetic factors contribute to the development of SPs and suggest that the development of these intestinal neoplasms in the cecum is driven by the interplay between genetic changes in the host, an inflammatory response, and a host-specific microbiota.


Figures

Figure 1.
Figure 1.
Expression changes in SPs of HBUS mice. (A) Expression of HBUS transgenes (n = 4) US28 (red) and HB-EGF (blue) in duodenum (Duo), jejunum (Jej), Ileum (Ile), cecal pouch (Pou), cecal–colonic junction (CJ), and colon (Col). The experiment was performed once. R.E., relative expression. (B) Number of SPs found in various gut segments of HBUS mice (n = 210). (C) HBUS SPs and surrounding (Surr.) cecal tissue were analyzed by RNA-Seq/edgeR using a paired design (n = 3/group). Plot of logFC (log fold change) versus logCPM (log counts per million) of all detected transcripts. Points are colored according to expression status: nonsignificant genes (gray), significant genes (676 genes; Q < 0.05; black), and defense response genes (red). The experiment was performed once. (D) Z-scored heat map of genes associated with the GO term “response to bacterium”; red indicates increased and green decreased expression in SPs compared with surrounding tissue. (E) ClueGO analysis of significantly regulated genes shown in C. Shown are the GO overview terms selected by %Genes/Term in color and relevant individual GO terms in black (Q < 0.05; terms > 25 genes; kappa 0.5). (F and G) Increased transcript levels (left, n = 3/group) and immunoreactivity (right, n = 8/group) of REG-3β (F) and REG-3γ (G) in SPs compared with surrounding tissue (representative figure of three independent experiments). All histology sections were counterstained with DAPI (F and G) and pan-Keratin (F) or E-cadherin (G). Bars: (F) 250 µm; (G) 100 µm.
Figure 2.
Figure 2.
Alterations in the microbiota affect formation of SPs in HBUS mice. (A) Overview of the antibiotics (Abx) treatment plan. At 6 wk of age, HBUS mice started receiving broad-spectrum antibiotics or water and were examined for the presence of SPs at 15 and 35 wk of age. (B) Bacterial content in antibiotics-treated HBUS mice at 15 (n = 7) and 35 (n = 5) wk of age compared with water-treated HBUS mice (n = 13). Determined by pan-bacterial 16S qPCR amplification relative to host ubiquitin (UBI). ***, P < 0.001 (pairwise Wilcoxon rank sum test [FDR]; representative of two independent experiments). (C) α diversity, a measure of species richness, in antibiotics-treated HBUS mice (n = 11) and HBUS mice on regular water (n = 20). ***, P < 0.001 (Wilcoxon rank sum test; experiment was performed once). (D) SP incidence in antibiotics-treated HBUS mice after 9 (n = 14) and 29 (n = 6) wk compared with HBUS mice on regular water (75% at 15 [n = 16] and 35 wk [n = 12]). (right) Gross picture of the cecum of antibiotics and water-treated HBUS mice at 35 wk of age showing an SP (dashed lines). *, P < 0.05; ***, P < 0.001 (Fisher’s exact test; combined data of two independent experiments). (E) Representative histological section of the cecum of 35-wk-old HBUS mice treated with water or antibiotics as described in D. (F) HBUS mice were treated with antibiotics for 9 wk and subsequently gavaged with stools from unmolested HBUS mice (Abx/Stool). Control HBUS mice were maintained on antibiotics. Ceca of HBUS mice were analyzed by gross inspection and histological sectioning. SP incidence in HBUS mice treated with Abx/Stool (n = 8) and HBUS mice maintained on antibiotics (n = 9). *, P < 0.05 (Wilcoxon rank sum test; experiment was performed once). (G) At 35 wk of age, the drinking water of HBUS mice was supplemented with antibiotics, whereas control mice were maintained on regular water. After 5 wk of antibiotic treatment, HBUS mice were checked for the presence of SPs by gross and histological analysis. Graph represents SP size of HBUS mice treated with antibiotics for 5 wk starting at 35 wk of age (n = 10) compared with age-matched HBUS controls on water (n = 17). *, P < 0.05 (Wilcoxon rank sum test; experiment was performed once). Bars: (D, F, and G) 5 mm; (E) 250 µm. Error bars indicate SEM.
Figure 3.
Figure 3.
Biota modification through rederivation prevents SP formation in HBUS mice. Two HBUS colonies were established; one was maintained by interbreeding with C57BL/6 mice obtained from the Jackson Laboratory and developed SPs (dashed line); the second colony was generated through embryo transfer using Swiss Webster mothers freshly obtained from Taconic (rederived). (A–C) HBUS mice were examined grossly (A) and histologically (B and C) for the presence of SPs. Shown is the SP incidence of regular HBUS mice (n = 16, n = 10, and n = 12 at 12, 17, and 25 wk of age, respectively) and rederived HBUS mice (n = 7, n = 9, and n = 10 at 12, 17, and 25 wk of age, respectively) as determined by gross and histological analysis. *, P < 0.05; **, P < 0.01 (Fisher’s exact test; experiment was performed once). Inset shows a higher-magnification image of the area in C indicated by the asterisk. (D) Weighted UniFrac analysis of Taconic mothers (n = 8) compared with HBUS mice that develop SPs (n = 20) and rederived HBUS mice (n = 13; Adonis test; experiment was performed once). (E) α diversity of Taconic mothers, rederived HBUS mice, and HBUS mice with SPs (pairwise Wilcoxon rank sum test; experiment was performed once). Bars: (A) 5 mm; (C) 500 µm. Error bars indicate SEM.
Figure 4.
Figure 4.
Biome analysis of SPs. (A) Relative abundance of phyla present in HBUS mice with SPs (n = 20), WT littermates (n = 7), rederived HBUS mice (Red; n = 13), and HBUS mice treated with antibiotics (Abx; n = 11). Data shown represent the most abundant phyla, whereas low abundant and unclassified OTUs were grouped in “Other.” (B, top) Pearson hierarchical clustering of the abundance profiles of all 703 OTUs after filtering. Phyla (P) are colored according to the legend in A. Mice were clustered (Spearman) by cage (color coded, top) and sample group (colored according to the legend). (bottom) Number of OTUs above background in each sample (OTU count) and fraction of total sample reads accounted for by the set of 703 filtered OTUs (read fraction). (D) Pearson hierarchical clustering identified four major clusters (C1–C4) in the abundance profiles of 106 OTUs that were significantly different between HBUS mice with SPs and rederived HBUS mice or WT controls (ANOVA Q < 0.05 [FDR]; Tukey P < 0.05; fold > 1.6). OTUs significantly enriched in SPs compared with rederived (R), WT (W), or antibiotics-treated (A) mice are shaded blue (left). Phyla (P) are colored according to the legend in A. OTU abundance is expressed as the log2-normalized read count in each sample. The OTU corresponding to A. muciniphila is indicated (arrowhead). (E) 15 OTUs from C2 that were present in >75% of SPs. OTUs are ranked by abundance (vertical axis) and according to abundance within each dataset (horizontal axis). OTU are annotated with Greengenes ID, color coded phyla (P) annotations (according to A), taxonomic family, and genus assignments. Each bar (A and C) or column (B, D, and E) represents a different mouse.
Figure 5.
Figure 5.
Bacterial infiltration SPs and decreased barrier function in SPs. (A and B) In situ hybridization with a eubacterial probe (A) or Clostridium cluster XIVa and XIVb (pb-00963; B) on frozen sections obtained from HBUS mice. Shown is a representative image obtained from two independent experiments of surrounding cecal tissue (Surr.) and an SP (middle; higher magnification of § on right; n = 6). S100A9-positive cells are indicated by asterisks. Arrowheads indicate bacteria that invaded the lamina propria (A) or bacteria recognized by pb-00963 that invaded the lamina propria (B). (C) At 35 wk of age, the drinking water of HBUS mice was supplemented with 1 mg/ml vancomycin, whereas control mice were maintained on regular water. After 4 wk of treatment, HBUS mice were checked for the presence of SPs by gross and histological analysis. Shown is SP size of HBUS mice treated with vancomycin for 4 wk starting at 35 wk of age (n = 9) compared with age-matched HBUS controls on water (n = 17). ***, P < 0.001 (Wilcoxon rank sum test; experiment was performed once). (D and E) Immunofluorescent analysis of the adherens junction protein E-cadherin (D) and its binding partner β-catenin (E) in surrounding cecal tissue (left) and an SP (right). Insets show a higher-magnification image of §. Arrowheads indicate the apical adherens junction. Representative images of three independent experiments are shown (n = 5). (F) Expression of Claudin-2 and Claudin-1 mRNA in SPs of HBUS mice compared with surrounding tissue (n = 5/group). **, P < 0.01 (Wilcoxon rank sum test, experiment was performed once). (G) Immunofluorescent analysis of proteins labeled with sulfo-NHS-biotin in the ceca of HBUS mice. Shown is a representative image of two independent experiments of biotin signal in cecal surrounding tissue and SPs of HBUS mice. The arrowhead indicates biotin signal in the lamina propria (inset shows higher-magnification image of §). Immunofluorescent sections were counterstained with DAPI and pan-Keratin (A, B, D, E, and G). Bar graphs represent combined data of two independent experiments (n = 5). Bars: (A [left and middle], B [left], D, and E) 50 µm; (A, right) 2 µm; (B, right) 10 µm; (G) 100 µm; (G, inset) 25 µm. Error bars indicate SEM.
Figure 6.
Figure 6.
Clostridial probe signal in antibiotic-treated HBUS mice. Representative image of an experiment performed once showing in situ hybridization with a eubacterial probe (left) or Clostridium cluster XIVa and XIVb (pb-00963) on frozen sections obtained from HBUS mice treated with antibiotics (n = 3). Bars, 50 µm.
Figure 7.
Figure 7.
Marked inflammatory changes in SPs. (A) Leukocytes (CD45+ cells) isolated from HBUS SPs and surrounding (Surr.) tissue were analyzed by Illumina BeadArray/limma. Quantile-normalized expression values were analyzed using a paired design (n = 3/group) and filtered for Q < 0.05 and −1.5 > fold change > 1.5. Z score–normalized data were subjected to hierarchical clustering (left): red indicates increased and green indicates decreased expression in SPs compared with surrounding tissue. Plot of logFC (log fold change) versus mean expression (right) of all detected transcripts (gray) and significant genes (153 genes; black). (B) ClueGO analysis of significantly regulated genes in an Illumina BeadArray analysis of SPs of HBUS mice compared with unaffected surrounding cecal tissue. Shown are GO overview terms selected by %Genes/Term in color (Q < 0.05; terms > 15 genes; kappa 0.5). (C) Cytokine and chemokine mRNA expression in tissue obtained from SPs compared with unaffected surrounding proximal cecal tissue (n = 5/group). *, P < 0.05; **, P < 0.01 (Wilcoxon rank sum test; experiment was performed twice). R.E., relative expression. (D) Il-17 production by TCR-γδ cells in SPs (n = 6) from HBUS mice compared with WT (n = 4) and unaffected surrounding HBUS cecal tissue (n = 6); cells were gated on CD45+/CD4/TCR-γδ+. *, P < 0.05 (Wilcoxon rank sum test; experiment was performed once). Shown are representative FACS plots and a summary scatter dot plot. (E–G) FACS analysis in SPs from HBUS mice (P; n = 3) compared with unaffected surrounding HBUS cecal tissue (S; n = 4) and WT cecal tissue (W; n = 4). For production of IL-17 and IL-22 by CD4/TCR-αβ, cells were gated on CD45+/CD4+/TCR-αβ+ (E). For DC subsets, cells were gated on CD45+/CD11b+/MHC-II+/Ly6C (F). For monocytes and eosinophils as defined by Ly6C and CD24 expression, cells were gated on CD45+/CD11b+/MHC-II/Ly6G (G). Shown are representative summary scatter dot plots. *, P < 0.05 (Wilcoxon rank sum test; experiment was performed once). Error bars indicate SEM.
Figure 8.
Figure 8.
Marked neutrophil infiltration in SPs. (A and B) Relative number of neutrophils determined by the number of Ly6G/Ly6C double-positive cells (A; gated on CD45+/CD11b+/MHC-II) and Gr-1–positive, Siglec-F–negative cells (B; gated on CD45+/CD11b+/MHC-II) in SPs (n = 3) of HBUS mice compared with unaffected surrounding cecal tissue (Surr.; n = 4) and WT littermate controls (n = 4). Shown are representative FACS plots and a summary scatter plot. *, P < 0.05 (Wilcoxon rank sum test; experiment was performed once). (C) Representative image of three independent experiments showing S100A9-positive cells in SPs and unaffected surrounding cecal tissue (n = 6). (D and E) At 35 wk of age, HBUS mice were treated with 0.4 mg anti-1A8 i.p. every other day for 30 d. Shown are representative immunofluorescent images (left) and quantification (right) of the number of S100A9-positive cells in SPs (D) and the size of SPs (E) in control (n = 11) and 1A8-treated (n = 9) HBUS mice. *, P < 0.05 (Wilcoxon rank sum test; experiment was performed once). (F) Expression of Mmp3 mRNA by qPCR analysis and immunofluorescent staining (MMP-3) in SPs and surrounding tissue (n = 4/group). Inset shows higher-magnification image of the area indicated by §. *, P < 0.05 (Wilcoxon rank sum test; experiment was performed twice). Sections were counterstained with DAPI and pan-Keratin. Bars: (C [left and middle] and F) 100 µm; (C, right) 10 µm; (D) 250 µm. Error bars indicate SEM.

Comment in

  • Do bugs define cancer geography?
    Jobin C. Jobin C. J Exp Med. 2014 Mar 10;211(3):385. doi: 10.1084/jem.2113insight3. J Exp Med. 2014. PMID: 24616475 Free PMC article. No abstract available.

References

    1. Arthur J.C., Perez-Chanona E., Mühlbauer M., Tomkovich S., Uronis J.M., Fan T.J., Campbell B.J., Abujamel T., Dogan B., Rogers A.B., et al. 2012. Intestinal inflammation targets cancer-inducing activity of the microbiota. Science. 338:120–123 10.1126/science.1224820 - DOI - PMC - PubMed
    1. Bates J.M., Mittge E., Kuhlman J., Baden K.N., Cheesman S.E., Guillemin K. 2006. Distinct signals from the microbiota promote different aspects of zebrafish gut differentiation. Dev. Biol. 297:374–386 10.1016/j.ydbio.2006.05.006 - DOI - PubMed
    1. Bindea G., Mlecnik B., Hackl H., Charoentong P., Tosolini M., Kirilovsky A., Fridman W.H., Pagès F., Trajanoski Z., Galon J. 2009. ClueGO: A Cytoscape plug-in to decipher functionally grouped gene ontology and pathway annotation networks. Bioinformatics. 25:1091–1093 10.1093/bioinformatics/btp101 - DOI - PMC - PubMed
    1. Bokulich N.A., Subramanian S., Faith J.J., Gevers D., Gordon J.I., Knight R., Mills D.A., Caporaso J.G. 2013. Quality-filtering vastly improves diversity estimates from Illumina amplicon sequencing. Nat. Methods. 10:57–59 10.1038/nmeth.2276 - DOI - PMC - PubMed
    1. Bongers G., Maussang D., Muniz L.R., Noriega V.M., Fraile-Ramos A., Barker N., Marchesi F., Thirunarayanan N., Vischer H.F., Qin L., et al. 2010. The cytomegalovirus-encoded chemokine receptor US28 promotes intestinal neoplasia in transgenic mice. J. Clin. Invest. 120:3969–3978 10.1172/JCI42563 - DOI - PMC - PubMed

Publication types

MeSH terms

Substances