. 2014 Spring;13(1):111-30.
doi: 10.1187/cbe-13-08-0152.

A course-based research experience: how benefits change with increased investment in instructional time

Affiliations

A course-based research experience: how benefits change with increased investment in instructional time

Christopher D Shaffer et al. CBE Life Sci Educ. 2014 Spring.

Abstract

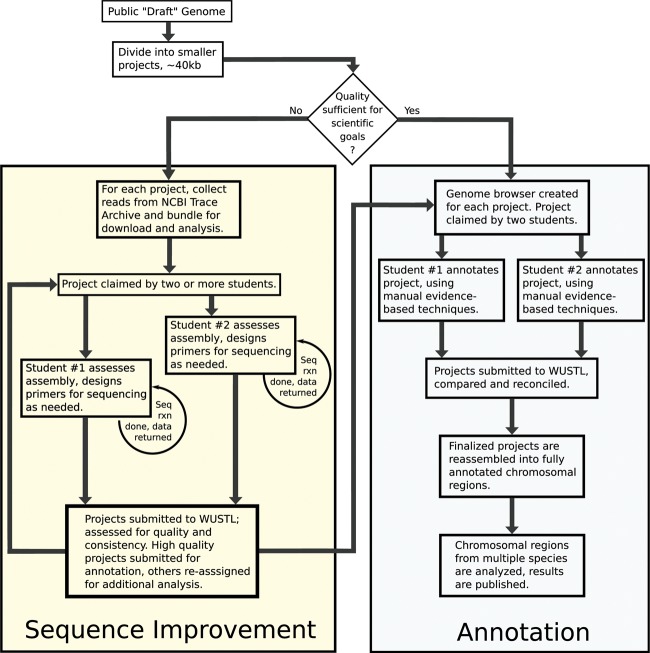
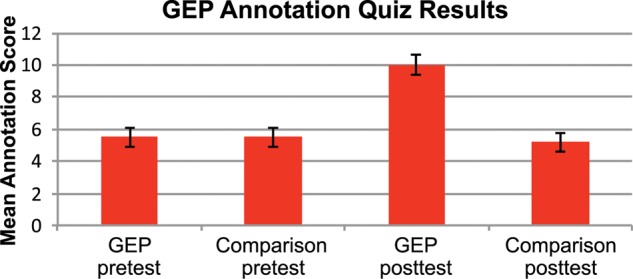
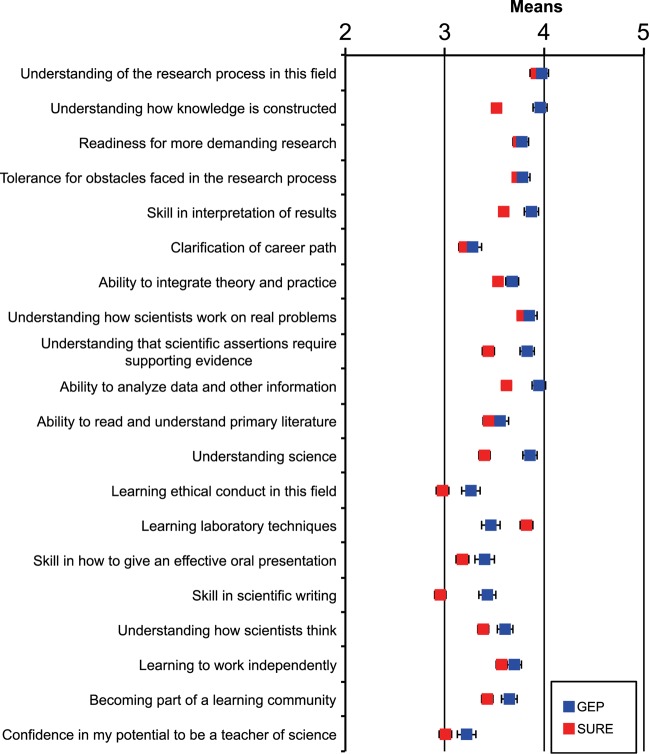
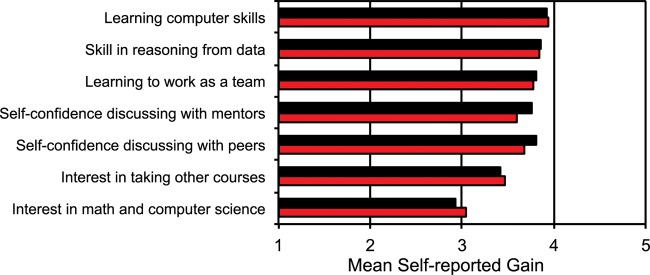
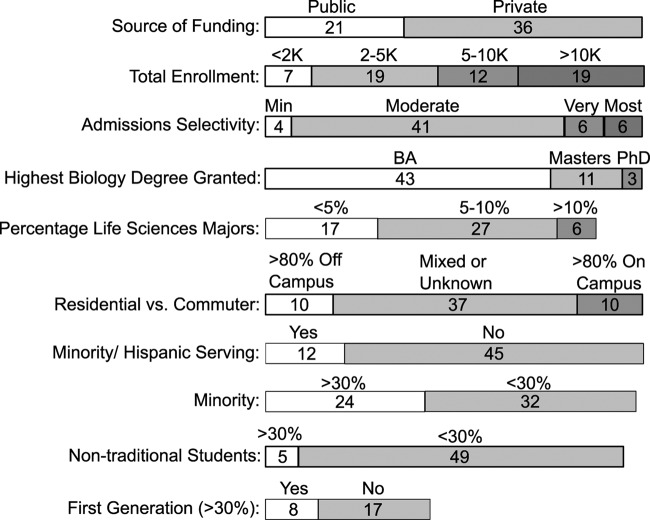
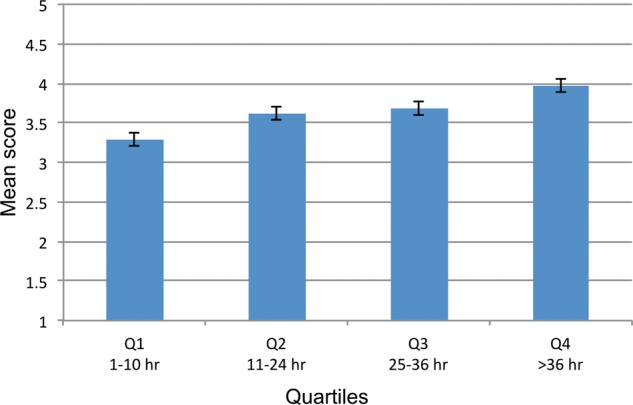
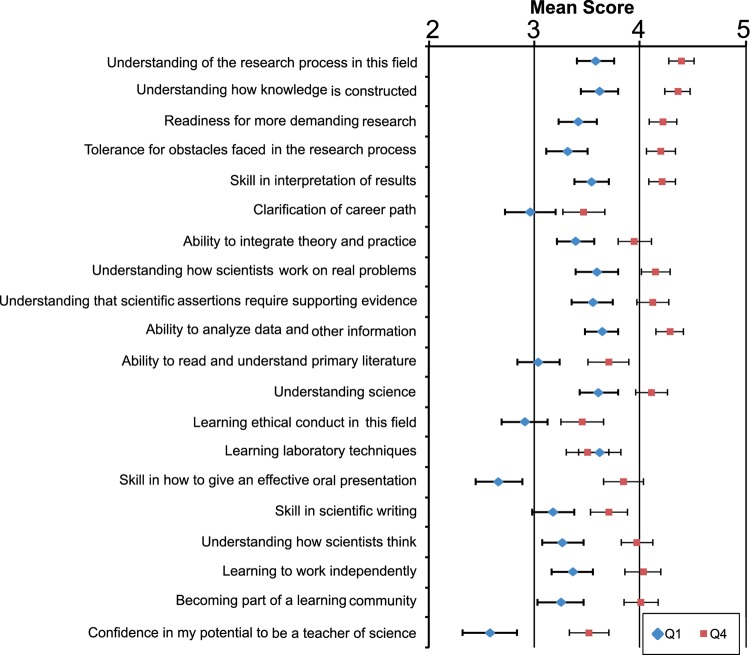
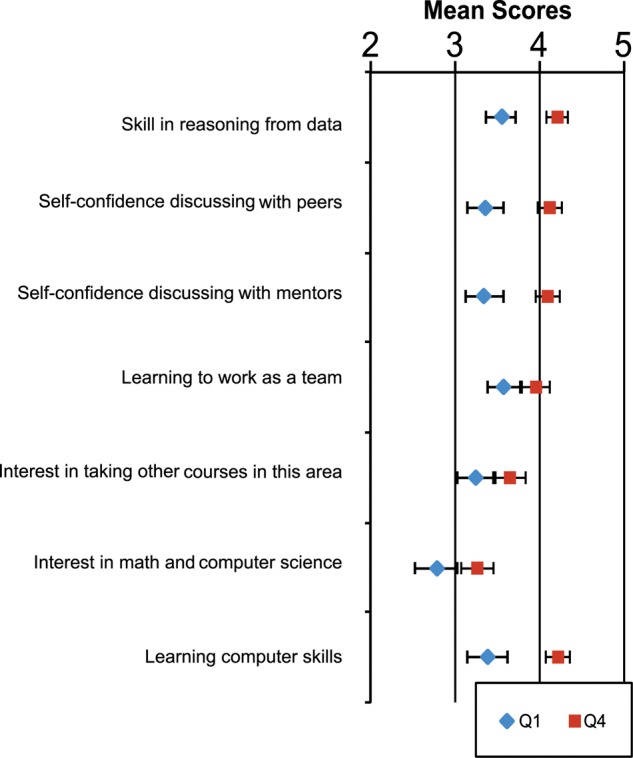
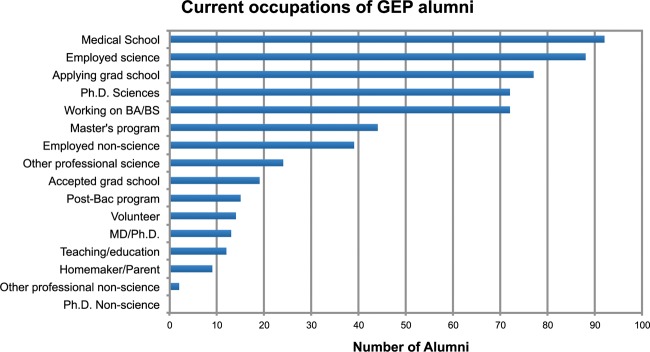
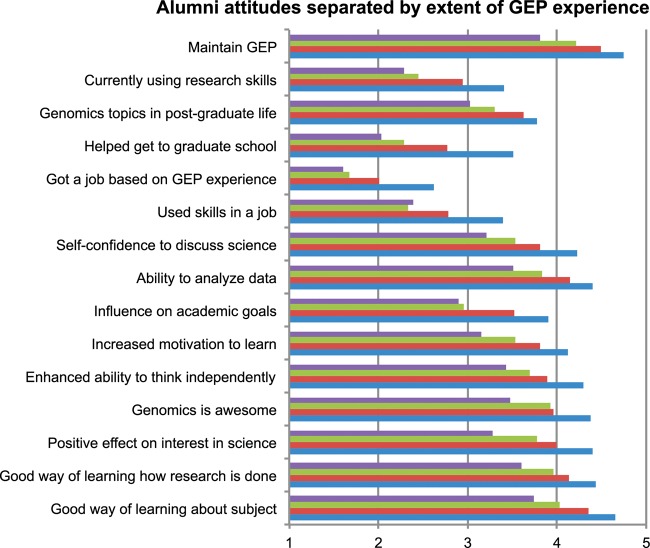
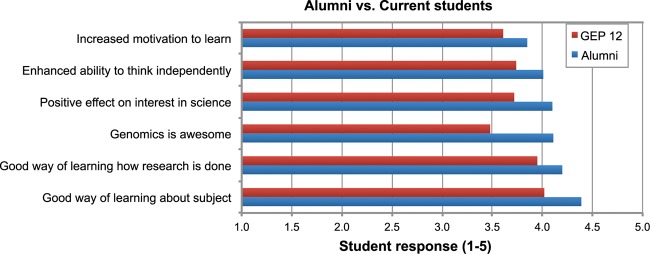
There is widespread agreement that science, technology, engineering, and mathematics programs should provide undergraduates with research experience. Practical issues and limited resources, however, make this a challenge. We have developed a bioinformatics project that provides a course-based research experience for students at a diverse group of schools and offers the opportunity to tailor this experience to local curriculum and institution-specific student needs. We assessed both attitude and knowledge gains, looking for insights into how students respond given this wide range of curricular and institutional variables. While different approaches all appear to result in learning gains, we find that a significant investment of course time is required to enable students to show gains commensurate to a summer research experience. An alumni survey revealed that time spent on a research project is also a significant factor in the value former students assign to the experience one or more years later. We conclude: 1) implementation of a bioinformatics project within the biology curriculum provides a mechanism for successfully engaging large numbers of students in undergraduate research; 2) benefits to students are achievable at a wide variety of academic institutions; and 3) successful implementation of course-based research experiences requires significant investment of instructional time for students to gain full benefit.


Figures

Figure 1.
Figure 1.
The GEP sequence improvement and annotation workflow. All projects are completed at least twice independently, and the results are reconciled before final assembly and analysis. While the quality of the genome sequence assembly available is sufficient to proceed directly to annotation for some species, in other cases it is necessary to improve the genome assembly (“finishing”) by generating additional sequencing data and manually resolving misassemblies.
Figure 2.
Figure 2.
The GEP UCSC Genome Browser. Students are challenged to analyze and evaluate the available evidence assembled on the genome browser to create optimal gene models and explore other genomic features. A sample of the available tracks is shown here. Often the available evidence is contradictory; e.g., see the discrepancy between some of the gene predictions and the organization of genes suggested by homology with D. melanogaster (BLASTX alignments).
Figure 3.
Figure 3.
GEP students show gains in their understanding of genes and genomes. The bars depict the mean scores on a 20-point quiz on genes and genomes attained by GEP students who participated in annotation and by a comparison group over 2010–2011 and 2011–2012. The GEP pretest data include 1026 observations; the GEP posttest data include 748 observations. The increase in scores was evaluated in two ways: first, with an independent-groups t test (t = 26.1, df = 1836, p <0.05), and second, with a paired t test for matched data (t = 21.9, df = 393, p <0.05). The comparison pretest data include 133 observations, while the comparison posttest represents 87 results from non-GEP students. The error bars represent two SEM. Cronbach's alpha statistic averaged 0.84 for these quizzes in 2011–2012.
Figure 4.
Figure 4.
Self-reported student learning gains using the SURE survey. Blue squares indicate the mean for GEP students, while red squares indicate the mean for SURE summer research students, 2009. Error bars represent two SEs below and above the means. The SE for the averages of the GEP and SURE responses was <0.04. Data shown combine results from surveys given in academic years 2010–11 and 2011–12; the data include between 652 and 751 responses on each of the 20 items from GEP students. The comparison group is the 2009 SURE survey of 1653 students who had just completed a summer in the lab. The large number of students allows for smaller error estimates than in our previous study (Lopatto et al., 2008).
Figure 5.
Figure 5.
Additional gains from a GEP experience not queried in the SURE survey. Student self-reported gains, assessed on a scale of 1 (no gain) to 5 (very large gain). GEP 2011 (337–344 cases): black; GEP 2012 (391–394 cases): red.
Figure 6.
Figure 6.
Diversity of GEP institutions with students participating in the above assessment during 2010–2011 and 2011–2012. For the purposes of this survey, nontraditional students are defined as those over age 25. Total number of schools represented is 57. Some schools do not collect some of the above data, resulting in some incomplete data sets. Data from U.S. News & World Report Staff (2011) or supplied by the institution.
Figure 7.
Figure 7.
The 20 learning gains (SURE) reported by GEP students were averaged and plotted against the four quartiles of annotation project hours. There was a significant difference in average learning gains across quartile groups (F = 11.9, df = 3, 374, p < 0.05). Pairwise contrasts indicate a significant difference between Q2 and Q4, but not between Q3 and Q4. The number of class hours utilized by each quartile group are shown above. The number of student respondents in each quartile is: Q1: 58; Q2: 139; Q3: 65; Q4: 116. (Respondents tallied here are only those who answered all 20 questions on the SURE survey.) Error bars represent two SEM.
Figure 8.
Figure 8.
Comparison of student responses on the 20 learning gain items (mean and SEM) from the SURE survey. The data are classified by instructor reports of the number of hours devoted to the annotation project. These were divided into four quartiles as shown in Figure 7; the responses from the Q1 (1–10 h) and Q4 (>36 h) students are shown here. The Q1 group includes 86–112 observations; the Q4 group includes 149–175 observations. (Respondents tallied here were those who answered the specific question on the SURE survey.) Error bars represent 2 SEM.
Figure 9.
Figure 9.
Comparison of student responses on seven additional learning benefit items categorized by the reported number of hours of instruction and lab work on the annotation project (Q1: 1–10 h; Q4: > 36 h). The Q1 group includes 105–107 observations; the Q4 group includes 172–174 observations. (Respondents tallied here were those who answered the specific question.) The error bars represent two SEM.
Figure 10.
Figure 10.
The current occupations of GEP alumni as self-reported on the alumni survey.
Figure 11.
Figure 11.
Alumni student attitudes separated by extent of GEP experience. Purple: “Took up just 1–3 labs”; green: “Course spent quarter”; red: “Course spent half or more”; blue: “Course devoted primarily to the GEP project.” Scale is 1–5, with 1 being “strongly disagree” and 5 being “strongly agree.” See Table S2 for numerical values.
Figure 12.
Figure 12.
Comparison of alumni and current student responses to six attitudinal survey questions. Scale is 1–5, with 1 being “strongly disagree” and 5 being “strongly agree.”

References

    1. American Association for the Advancement of Science. Vision and Change in Undergraduate Biology Education: A Call to Action. Washington, DC: 2011. http://visionandchange.org/files/2011/03/Revised-Vision-and-Change-Final... (accessed 4 July 2013)
    1. Anderson LW, Krathwohl DR (eds.) A Taxonomy for Learning, Teaching, and Assessing: A Revision of Bloom's Taxonomy of Educational Objectives. Boston, MA: Allyn & Bacon; 2001.
    1. Banta LM, et al. Integrating genomics research throughout the undergraduate curriculum: a collection of inquiry-based genomics lab modules. CBE Life Sci Educ. 2012;11:203–208. - PMC - PubMed
    1. Bascom-Slack CA, Arnold AE, Strobel SA. Student-directed discovery of the plant microbiome and its products. Science. 2012;338:485–486. - PubMed
    1. Bauer KW, Bennett JS. Alumni perceptions used to assess undergraduate research experience. J High Educ. 2003;74:210–230.

Publication types