

Dynamic Development of Regional Cortical Thickness and Surface Area in Early Childhood
- PMID: 24591525
- PMCID: PMC4506327
- DOI: 10.1093/cercor/bhu027
Dynamic Development of Regional Cortical Thickness and Surface Area in Early Childhood
Abstract
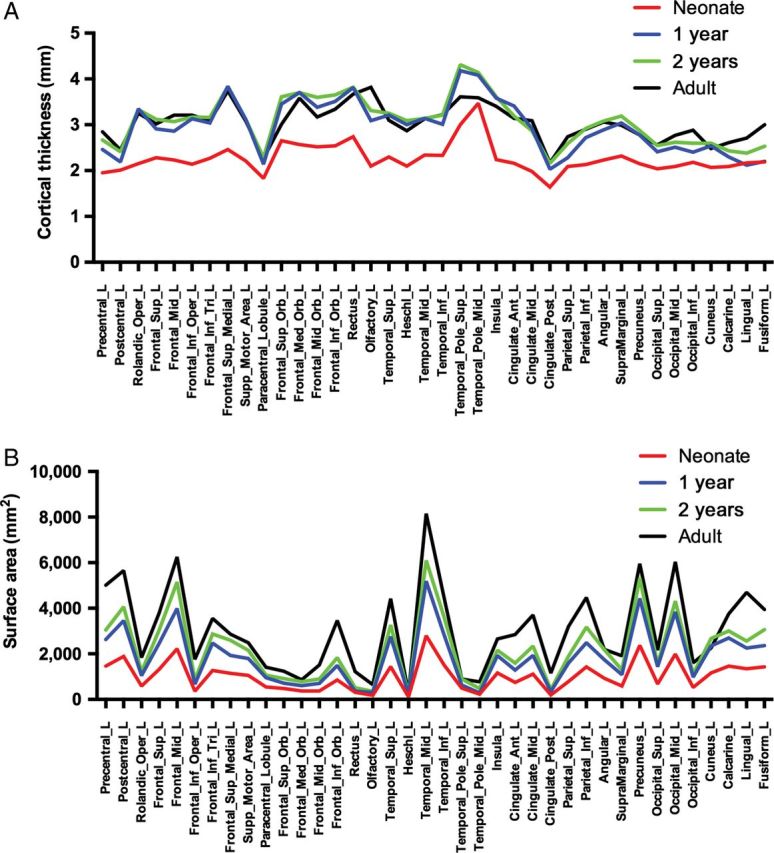
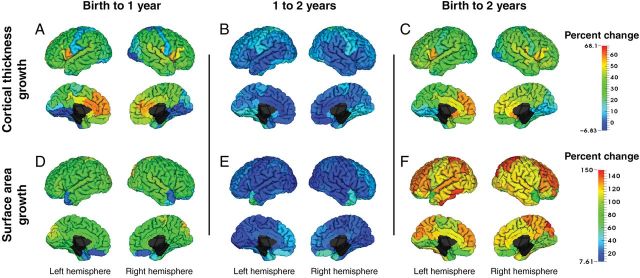
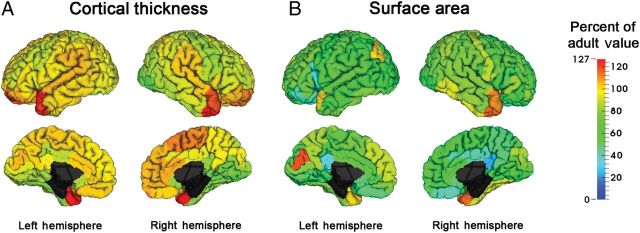
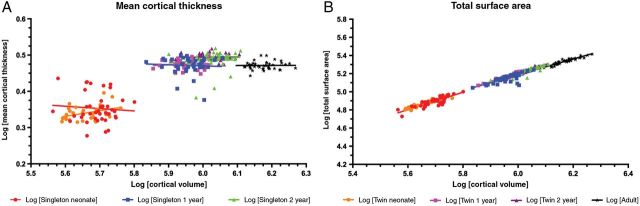
Cortical thickness (CT) and surface area (SA) are altered in many neuropsychiatric disorders and are correlated with cognitive functioning. Little is known about how these components of cortical gray matter develop in the first years of life. We studied the longitudinal development of regional CT and SA expansion in healthy infants from birth to 2 years. CT and SA have distinct and heterogeneous patterns of development that are exceptionally dynamic; overall CT increases by an average of 36.1%, while cortical SA increases 114.6%. By age 2, CT is on average 97% of adult values, compared with SA, which is 69%. This suggests that early identification, prevention, and intervention strategies for neuropsychiatric illness need to be targeted to this period of rapid postnatal brain development, and that SA expansion is the principal driving factor in cortical volume after 2 years of age.
Keywords: brain development; cerebral cortex; gray matter; human; magnetic resonance imaging.
© The Author 2014. Published by Oxford University Press. All rights reserved. For Permissions, please e-mail: journals.permissions@oup.com.
Figures
References
-
- Bennett MR. 2011. The prefrontal-limbic network in depression: a core pathology of synapse regression. Prog Neurobiol. 93:457–467. - PubMed
-
- Blumenthal JD, Zijdenbos A, Molloy E, Giedd JN. 2002. Motion artifact in magnetic resonance imaging: implications of automated analysis. Neuroimage. 16:89–92. - PubMed
Publication types
MeSH terms
Grants and funding
- MH070890/MH/NIMH NIH HHS/United States
- EB008374/EB/NIBIB NIH HHS/United States
- AG042599/AG/NIA NIH HHS/United States
- R01 AG042599/AG/NIA NIH HHS/United States
- EB009634/EB/NIBIB NIH HHS/United States
- R01 MH070890/MH/NIMH NIH HHS/United States
- U01 MH070890/MH/NIMH NIH HHS/United States
- MH064065/MH/NIMH NIH HHS/United States
- MH100217/MH/NIMH NIH HHS/United States
- HD053000/HD/NICHD NIH HHS/United States
- R01 EB009634/EB/NIBIB NIH HHS/United States
- R01 HD053000/HD/NICHD NIH HHS/United States
- AG041721/AG/NIA NIH HHS/United States
- EB006733/EB/NIBIB NIH HHS/United States
- R01 MH100217/MH/NIMH NIH HHS/United States
LinkOut - more resources
Full Text Sources
Other Literature Sources
Medical
