. 2014 May 1;592(9):2003-12.
doi: 10.1113/jphysiol.2014.271528. Epub 2014 Mar 3.

Subcellular distribution of glycogen and decreased tetanic Ca2+ in fatigued single intact mouse muscle fibres

Affiliations

Subcellular distribution of glycogen and decreased tetanic Ca2+ in fatigued single intact mouse muscle fibres

Joachim Nielsen et al. J Physiol. .

Abstract

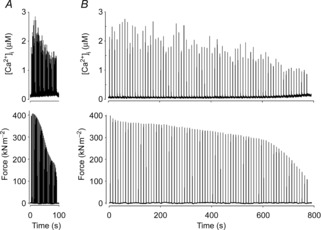
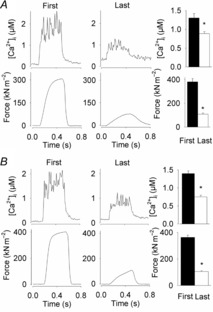
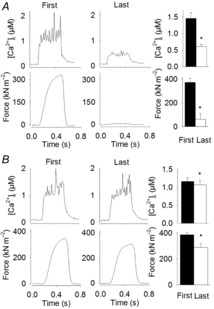
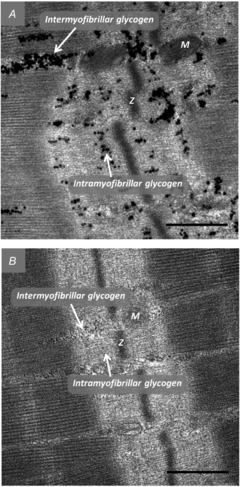
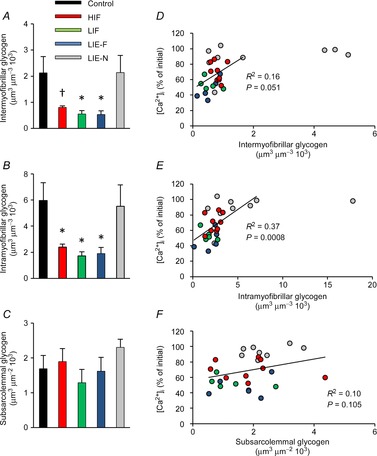
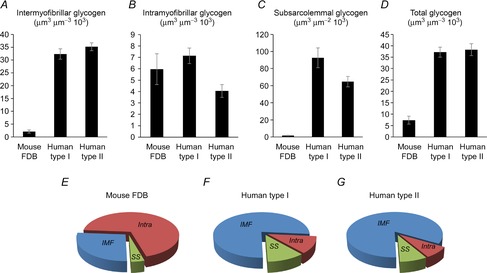
In skeletal muscle fibres, glycogen has been shown to be stored at different subcellular locations: (i) between the myofibrils (intermyofibrillar); (ii) within the myofibrils (intramyofibrillar); and (iii) subsarcolemmal. Of these, intramyofibrillar glycogen has been implied as a critical regulator of sarcoplasmic reticulum Ca(2+) release. The aim of the present study was to test directly how the decrease in cytoplasmic free Ca(2+) ([Ca(2+)]i) during repeated tetanic contractions relates to the subcellular glycogen distribution. Single fibres of mouse flexor digitorum brevis muscles were fatigued with 70 Hz, 350 ms tetani given at 2 s (high-intensity fatigue, HIF) or 10 s (low-intensity fatigue, LIF) intervals, while force and [Ca(2+)]i were measured. Stimulation continued until force decreased to 30% of its initial value. Fibres were then prepared for analyses of subcellular glycogen distribution by transmission electron microscopy. At fatigue, tetanic [Ca(2+)]i was reduced to 70 ± 4% and 54 ± 4% of the initial in HIF (P < 0.01, n = 9) and LIF (P < 0.01, n = 5) fibres, respectively. At fatigue, the mean inter- and intramyofibrillar glycogen content was 60-75% lower than in rested control fibres (P < 0.05), whereas subsarcolemmal glycogen was similar to control. Individual fibres showed a good correlation between the fatigue-induced decrease in tetanic [Ca(2+)]i and the reduction in intermyofibrillar (P = 0.051) and intramyofibrillar (P = 0.0008) glycogen. In conclusion, the fatigue-induced decrease in tetanic [Ca(2+)]i, and hence force, is accompanied by major reductions in inter- and intramyofibrillar glycogen. The stronger correlation between decreased tetanic [Ca(2+)]i and reduced intramyofibrillar glycogen implies that sarcoplasmic reticulum Ca(2+) release critically depends on energy supply from the intramyofibrillar glycogen pool.


Figures

Figure 1
Figure 1. Typical original records from single flexor digitorum brevis fibres of fatigue-induced changes in tetanic [Ca2+]i and force during repetitive stimulation with the high-intensity fatigue (A) and low-intensity fatigue protocols (B)
Muscle fibres were either stimulated every 2 s (A) or every 10 s (B) until force production was decreased to 30% of its initial value.
Figure 2
Figure 2. Typical and mean data for high-intensity fatigue fibres (A) and low-intensity fatigue fibres (B) showing [Ca2+]i and force for the first and last contraction of repetitive stimulation
Means ± SEM, n = 9 and n = 5, respectively. *Last contraction is significantly different from the first (P < 0.05).
Figure 3
Figure 3. Typical and mean data for low-intensity equivalent fatigued fibres (A) and low-intensity equivalent non-fatigued fibres (B) showing [Ca2+]i and force for the first and last contraction of repetitive stimulation
Means ± SEM, n = 5 and n = 9, respectively. *Last contraction is significantly different from the first (P < 0.05).
Figure 4
Figure 4. Transmission electron microscopy images showing representative sarcomeres from control (A) and low-intensity fatigued (B) fibres
Fibres were fixed in glutaraldehyde immediately after the stimulation protocol and subsequently prepared for glycogen visualization by transmission electron microscopy (see Materials and methods). Glycogen can be seen as the black circles located both within the myofibrils (intramyofibrillar) and between myofibrils (intermyofibrillar). M, mitochondria; Z, z-line. Original magnification ×40,000. Scale bars represent 500 nm.
Figure 5
Figure 5. Inter- and intramyofibrillar glycogen are markedly decreased in fatigued fibres
The content of three subcellular localizations of glycogen (A, intermyofibrillar; B, intramyofibrillar; C, subsarcolemmal) was estimated based on transmission electron microscopy images of control fibres (black, n = 10), HIF (red, n = 9), LIF (green, n = 5), LIE-F (blue, n = 5) and LIE-N (grey, n = 9) fibres. Data are means ± SEM †P < 0.05 compared to control fibres. *P < 0.01 compared to control fibres. DF, the relation between tetanic [Ca2+]i at the end of the stimulation period and subcellular glycogen content of individual fibres. Colour coding as in AC. Regression analyses were performed on data points from HIF, LIF and LIE fibres. HIF, high-intensity fatigued; LIE-F, low-intensity equivalent fatigued; LIE-N, low-intensity equivalent non-fatigued; LIF, low-intensity fatigued.
Figure 6
Figure 6. Mice have a different subcellular distribution of skeletal muscle glycogen compared with humans
Comparison between control mouse FDB fibres (n = 10) and human type I (n = 30 fibres from 10 subjects) and type II (n = 29 fibres from 10 subjects) muscle fibres (human data obtained from Nielsen et al. 2011). Mouse fibres have much lower intermyofibrillar (A), subsarcolemmal (C) and total (D) glycogen content, whereas the levels of intramyofibrillar glycogen (B) is comparable to human fibres. Thus, relative distributions show that intramyofibrillar glycogen is the largest subfraction in mouse fibres (E), whereas intermyofibrillar glycogen is the largest in human fibres (F and G). FDB, flexor digitorum brevis; IMF, intermyofibrillar; Intra, intramyofibrillar; SS, subsarcolemmal.

Comment in

References

    1. Allen DG, Lamb GD. Westerblad H. Skeletal muscle fatigue: cellular mechanisms. Physiol Rev. 2008;88:287–332. - PubMed
    1. Andrade FH, Reid MB, Allen DG. Westerblad H. Effect of hydrogen peroxide and dithiothreitol on contractile function of single skeletal muscle fibres from the mouse. J Physiol. 1998;509:565–575. - PMC - PubMed
    1. Bruton JD, Dahlstedt AJ, Abbate F. Westerblad H. Mitochondrial function in intact skeletal muscle fibres of creatine kinase deficient mice. J Physiol. 2003;552:393–402. - PMC - PubMed
    1. Bruton JD, Cheng AJ. Westerblad H. Methods to detect Ca2+ in living cells. Adv Exp Med Biol. 2012;740:27–43. - PubMed
    1. Chin ER. Allen DG. Effects of reduced muscle glycogen concentration on force, Ca2+ release and contractile protein function in intact mouse skeletal muscle. J Physiol. 1997;498:17–29. - PMC - PubMed

Publication types

LinkOut - more resources