. 2014 Mar 18;111(11):4001-6.
doi: 10.1073/pnas.1313490111. Epub 2014 Mar 3.

Increasing homogeneity in global food supplies and the implications for food security

Affiliations

Increasing homogeneity in global food supplies and the implications for food security

Colin K Khoury et al. Proc Natl Acad Sci U S A. .

Abstract

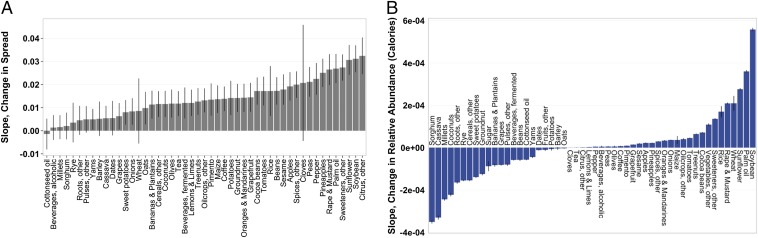
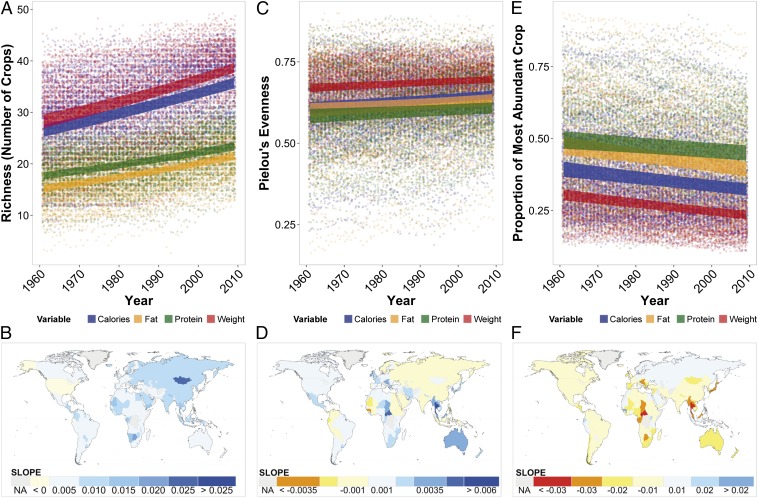
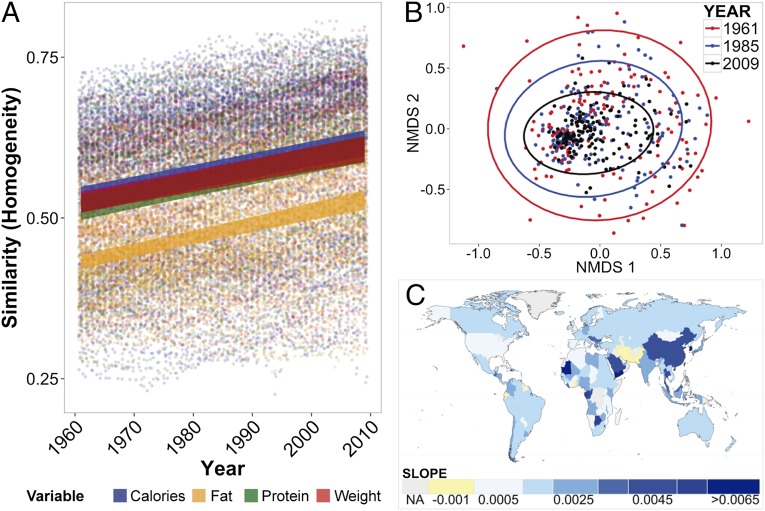
The narrowing of diversity in crop species contributing to the world's food supplies has been considered a potential threat to food security. However, changes in this diversity have not been quantified globally. We assess trends over the past 50 y in the richness, abundance, and composition of crop species in national food supplies worldwide. Over this period, national per capita food supplies expanded in total quantities of food calories, protein, fat, and weight, with increased proportions of those quantities sourcing from energy-dense foods. At the same time the number of measured crop commodities contributing to national food supplies increased, the relative contribution of these commodities within these supplies became more even, and the dominance of the most significant commodities decreased. As a consequence, national food supplies worldwide became more similar in composition, correlated particularly with an increased supply of a number of globally important cereal and oil crops, and a decline of other cereal, oil, and starchy root species. The increase in homogeneity worldwide portends the establishment of a global standard food supply, which is relatively species-rich in regard to measured crops at the national level, but species-poor globally. These changes in food supplies heighten interdependence among countries in regard to availability and access to these food sources and the genetic resources supporting their production, and give further urgency to nutrition development priorities aimed at bolstering food security.

Keywords: agricultural development; crop diversity; global analysis; plant genetic resources.


Conflict of interest statement

The authors declare no conflict of interest.

Figures

Fig. 1.
Fig. 1.
Global change in spread and abundance of crop commodities in national food supplies from 1961 to 2009. (A) Slope of the relative change in the geographic spread of crop commodities, defined as the change over time in the presence (i.e., value >0) of a crop commodity in contribution to any variable of food supply in a country in each year. Bars represent slope parameters [±95% confidence interval (CI)] from generalized estimation equations with a binomial error distribution, country as a grouping factor, and an autoregressive correlation structure. Sugar; vegetables, other; and fruits, other commodities are not depicted because they were nearly ubiquitous in spread globally throughout the study period and therefore did not change significantly. (B) Slope of the change in relative abundance of crop commodities in contribution to calories, as derived from the value contributed by a particular crop relative to the sum of all crops within a given country within a given year. Bars represent slopes (±95% CI) of the predicted values (1961–2009) for each crop from generalized linear mixed models, with year and crop as fixed effects and country as a random effect. Slopes for change in relative abundance for all measurements are depicted in Fig. S3.
Fig. 2.
Fig. 2.
Global change in richness, evenness, and dominance of crop commodities in national food supplies from 1961 to 2009. (A) Global mean change in crop commodity richness (i.e., number of crops) in national food supplies. Points represent actual data, and lines are 95% prediction intervals from generalized linear mixed models with a Poisson error distribution. (B) World map displaying the slope of change in crop commodity richness per country for calories. (C) Global mean change in evenness of contributing crop commodities within national food supplies calculated by Pielou’s evenness index. Points represent actual data, and lines are 95% prediction intervals for a linear mixed-effects model. (D) World map displaying the slope of change in evenness of national food supplies for calories. (E) Global mean change in the dominance of the most abundant crop commodity in each country in each year. Points represent actual data, and lines are 95% prediction intervals from a generalized linear mixed model with a binomial error distribution. (F) World map displaying the slope of change in dominance in national food supplies for calories.
Fig. 3.
Fig. 3.
Global change in similarity (homogeneity) of food supplies, as measured by Bray–Curtis dissimilarity from each country to the global centroid (mean composition) in each year, converted to similarity. (A) Global mean change in similarity to centroid of national food supplies. Points represent actual data, and lines are 95% prediction intervals from linear mixed-effects models. (B) Multivariate ordination of crop commodity composition in contribution to calories in national food supplies in 1961, 1985, and 2009. Red points represent the multivariate commodity composition of each country in 1961, blue points in 1985, and black points in 2009. Circles represent 95% CIs around the centroid in each year. Between 1961 and 2009, the area contained within these 95% CIs decreased by 68.8%, representing the decline in country-to-country variation of commodity composition (i.e., homogenization) over time. (C) World map displaying the slope of change in similarity to centroid of national food supplies for calories.

References

    1. Cadotte MW, Dinnage R, Tilman D. Phylogenetic diversity promotes ecosystem stability. Ecology. 2012;93(sp8):S223–S233.
    1. Gamfeldt L, et al. Higher levels of multiple ecosystem services are found in forests with more tree species. Nat Commun. 2013;4:1340. - PMC - PubMed
    1. Hooper DU, et al. Effects of biodiversity on ecosystem functioning: A consensus of current knowledge. Ecol Monogr. 2005;75:3–35.
    1. Zhang Y, Chen HYH, Reich PB. Forest productivity increases with evenness, species richness and trait variation: A global meta-analysis. J Ecol. 2012;100(3):742–749.
    1. Hooper DU, et al. A global synthesis reveals biodiversity loss as a major driver of ecosystem change. Nature. 2012;486(7401):105–108. - PubMed

Publication types