. 2014 Feb 14:5:26.
doi: 10.3389/fgene.2014.00026. eCollection 2014.

Genomic architecture of sickle cell disease in West African children

Affiliations

Genomic architecture of sickle cell disease in West African children

Jacklyn Quinlan et al. Front Genet. .

Abstract

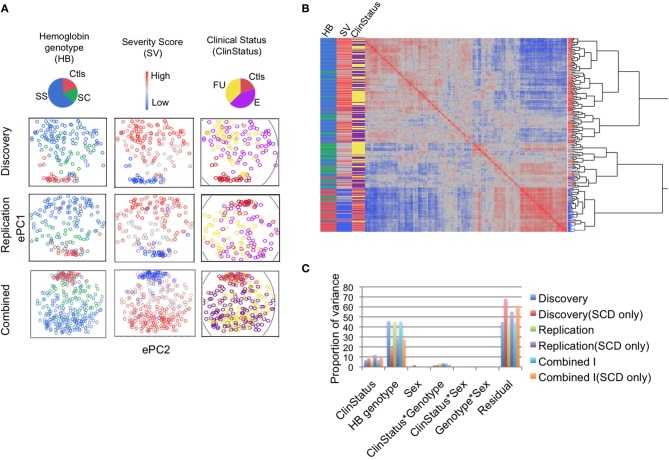
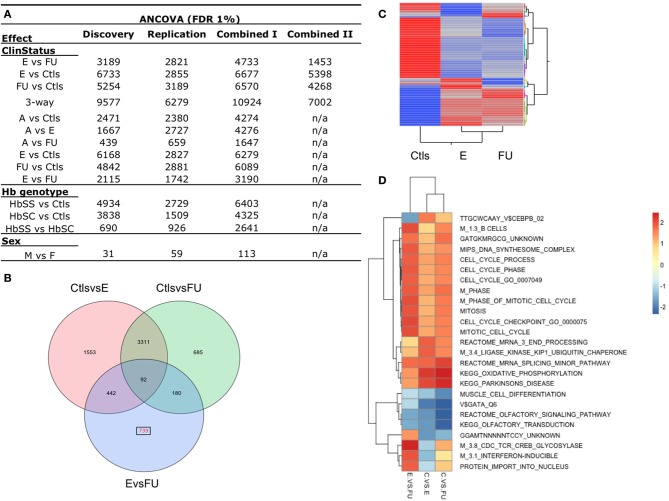
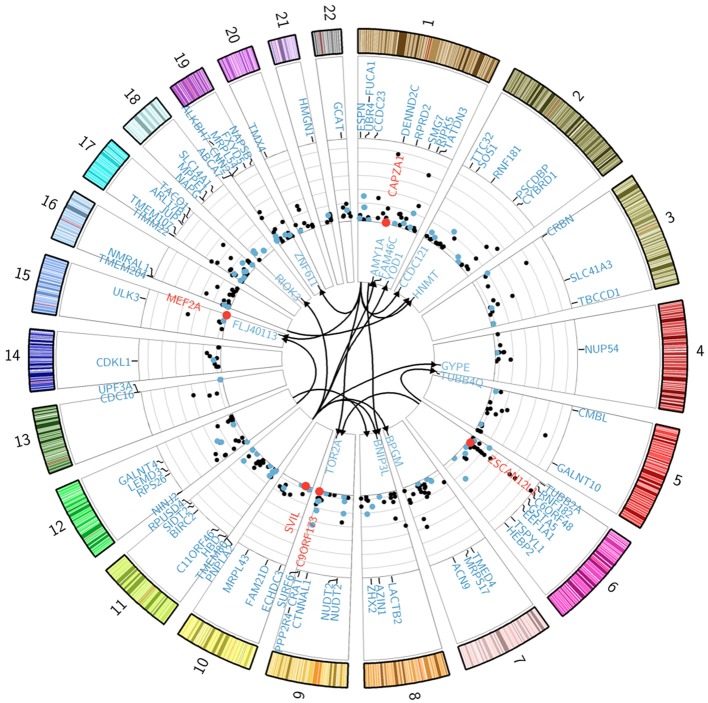
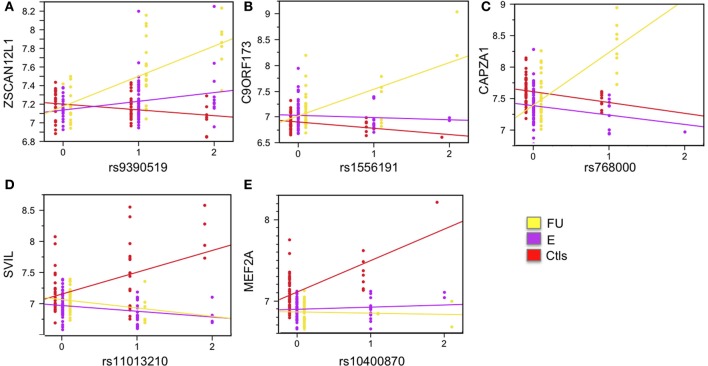
Sickle cell disease (SCD) is a congenital blood disease, affecting predominantly children from sub-Saharan Africa, but also populations world-wide. Although the causal mutation of SCD is known, the sources of clinical variability of SCD remain poorly understood, with only a few highly heritable traits associated with SCD having been identified. Phenotypic heterogeneity in the clinical expression of SCD is problematic for follow-up (FU), management, and treatment of patients. Here we used the joint analysis of gene expression and whole genome genotyping data to identify the genetic regulatory effects contributing to gene expression variation among groups of patients exhibiting clinical variability, as well as unaffected siblings, in Benin, West Africa. We characterized and replicated patterns of whole blood gene expression variation within and between SCD patients at entry to clinic, as well as in follow-up programs. We present a global map of genes involved in the disease through analysis of whole blood sampled from the cohort. Genome-wide association mapping of gene expression revealed 390 peak genome-wide significant expression SNPs (eSNPs) and 6 significant eSNP-by-clinical status interaction effects. The strong modulation of the transcriptome implicates pathways affecting core circulating cell functions and shows how genotypic regulatory variation likely contributes to the clinical variation observed in SCD.

Keywords: eSNP mapping; gene-by-environment interactions; genomics; sickle cell disease; transcriptome.


Figures

Figure 1
Figure 1
Sickle cell disease impacts gene expression genome-wide. (A) The first two expression principal components (ePC) from PC analysis of the discovery and replication phase samples, and in the combined dataset. Individuals are coloured according to Hb genotype (HbSS, blue; HbSC, green; and Controls, red), SCD severity score (SV, red to blue indicates high to low severity) and clinical status effect (ClinStatus, yellow; E, purple, Ctls, red). (B) One-way hierarchical clustering of the genome-wide gene expression correlation matrix for the combined dataset (n = 311). The heat map shows the clustering of individual expression profiles based on similarity. The highest level of clustering is observed for the Hb genotype effect followed by SCD severity score. (C) Variance component analysis (VCA) of the first three expression PCs (ePC1-3) explaining 36, 37, and 37% of the total variance in the discovery, replication, and in the combined dataset. The two main variables that explain this variance are Hb genotype and clinical status effect. The proportion of the variance explained by each variable is similar in the discovery, replication and combined datasets. VCA of SCD patients alone shows that the proportion of the variance explained by clinical status was similar to that when the controls were included but the proportion of the variance explained by Hb genotype dropped by 25–50%. See also Figure S4.
Figure 2
Figure 2
Differential gene expression between SCD disease status. (A) Number of differentially expressed probes for the following effects: SCD clinical status (E, Entry; FU, Follow-up; Ctls, Controls; A, Acute), Hb genotypes (HbSS, HbSC, Ctls), and between sexes (M, males; F, females). The 3way-ClinStatus effect is between E vs. FU vs. Ctls. These results were obtained from an analysis of covariance (ANCOVA, FDR 1%) of the discovery, replication and combined datasets I and II and accounts for sex and total blood cell counts (RBC and WBC). (B) Venn diagram of the 7002 differentially expressed probes for the 3-way clinical status effect in the combined data set II. In red, 735 probes are shown to be differentially expressed uniquely between E vs. FU SCD patients. (C) Two-way hierarchical clustering of the mean expression levels for the 7002 differentially expressed probes in the combined data set II for each group of patients (E, FU, Ctls) is shown. Mean expression from this class of genes cluster controls from SCD entry and follow-up patients. (D) Gene Set Enrichment Analysis (GSEA) was performed for each contrast of the clinical status effect using the combined dataset II. This analysis identified biological pathways and sets of individual genes that are significantly enriched in each contrast. Selection of the most distinctive significantly enriched pathways between entry and follow-up groups is shown. Cells are colored by their respective Normalized Enrichment Scores for a given contrast. See also Figure S6.
Figure 3
Figure 3
Genetic regulation of gene expression in SCD patients. The Circularized Manhattan plot shows genome-wide significant SNP-probe associations for the analysis that used the combined II dataset. Bonferroni correction for multiple testing was applied to all of our analyses with a genome-wide significance threshold of p < 0.05/(19,431 probes × 200 SNPs) = 1.28 × 10−08 (NLP = 7.89) for local associations in model 1 and p < 0.05/(19,431 probes × 560,675 SNP) = 4.59 × 10⁻¹² (NLP = 11.34) for distal-associations in model 1; while model 2 thresholds were p < 0.05/(7002 probes × 200 SNPs) = 3.57 × 10−08 (NLP = 7.45) for local associations and p < 0.05/(7002 probes × 455,750 SNP) = 1.57 × 10⁻¹¹ (NLP = 10.80) for distal-associations. Distal associations are shown in the center of the plot. All genes involved in an interaction effect are differentially expressed and shown in red. eSNP genes from model 1 that are differentially expressed for the clinical status effect are shown in blue. The y-axis of the Manhattan plot indicates significance values (−log10 p-values) for the local-associations. Genes under eSNP control that are not differentially expressed for the clinical status effect (in the ANCOVA analysis at FDR 1%) are shown in black. See also Table S1.
Figure 4
Figure 4
Examples of significant SNP-by-clinical status interaction effects. Five SNP-by-clinical status interaction effects are shown. All are local eSNP interactions. Expression levels are shown on the y-axis, and SNP genotype on the x-axis. The eSNP interaction involving gene zinc finger and SCAN domain containing 12 pseudogene 1 (ZSCAN12L1) is shown in (A); chromosome 9 open reading frame 173 (C9ORF173) is shown in (B); capping protein (actin filament) muscle Z-line, alpha 1 (CAPZA1) is shown in (C); supervillin (SVIL) is shown in (D); and myocyte enhancer factor 2A (MEF2A) is shown in (E). Linear regression for each group is plotted and colored: yellow for follow-up, FU; purple for entry, E; and red for controls, Ctls. See also Figure S7.

References

    1. Adams G. T., Snieder H., Mckie V. C., Clair B., Brambilla D., Adams R. J., et al. (2003). Genetic risk factors for cerebrovascular disease in children with sickle cell disease: design of a case-control association study and genomewide screen. BMC Med. Genet. 4:6 10.1186/1471-2350-4-6 - DOI - PMC - PubMed
    1. Akinsheye I., Alsultan A., Solovieff N., Ngo D., Baldwin C. T., Sebastiani P., et al. (2011). Fetal hemoglobin in sickle cell anemia. Blood 118, 19–27 10.1182/blood-2011-03-325258 - DOI - PMC - PubMed
    1. Barreiro L. B., Tailleux L., Pai A. A., Gicquel B., Marioni J. C., Gilad Y. (2012). Deciphering the genetic architecture of variation in the immune response to Mycobacterium tuberculosis infection. Proc. Natl. Acad. Sci. U. S. A. 109, 1204–1209 10.1073/pnas.1115761109 - DOI - PMC - PubMed
    1. Berry M. P., Graham C. M., McNab F. W., Xu Z., Bloch S. A., Oni T., et al. (2010). An interferon-inducible neutrophil-driven blood transcriptional signature in human tuberculosis. Nature 466, 973–977 10.1038/nature09247 - DOI - PMC - PubMed
    1. Cookson W., Liang L., Abecasis G., Moffatt M., Lathrop M. (2009). Mapping complex disease traits with global gene expression. Nat. Rev. Genet. 10, 184 –194 10.1038/nrg2537 - DOI - PMC - PubMed