

Mammographic quantitative image analysis and biologic image composition for breast lesion characterization and classification
- PMID: 24593733
- PMCID: PMC3978370
- DOI: 10.1118/1.4866221
Mammographic quantitative image analysis and biologic image composition for breast lesion characterization and classification
Abstract
Purpose: To investigate whether biologic image composition of mammographic lesions can improve upon existing mammographic quantitative image analysis (QIA) in estimating the probability of malignancy.
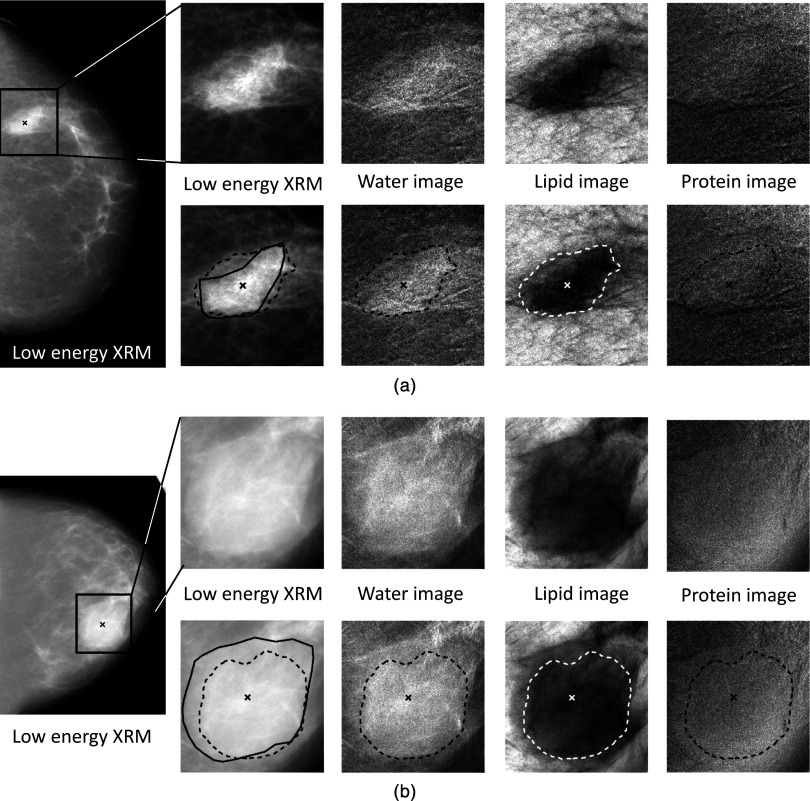
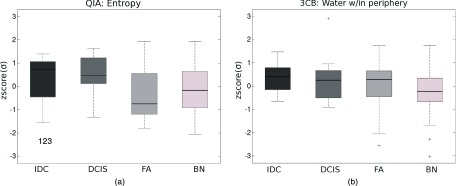
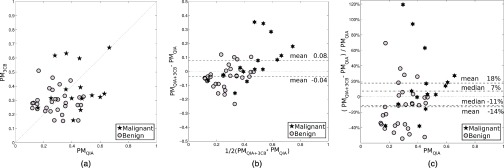
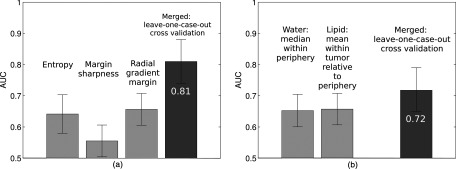
Methods: The study population consisted of 45 breast lesions imaged with dual-energy mammography prior to breast biopsy with final diagnosis resulting in 10 invasive ductal carcinomas, 5 ductal carcinomain situ, 11 fibroadenomas, and 19 other benign diagnoses. Analysis was threefold: (1) The raw low-energy mammographic images were analyzed with an established in-house QIA method, "QIA alone," (2) the three-compartment breast (3CB) composition measure-derived from the dual-energy mammography-of water, lipid, and protein thickness were assessed, "3CB alone", and (3) information from QIA and 3CB was combined, "QIA + 3CB." Analysis was initiated from radiologist-indicated lesion centers and was otherwise fully automated. Steps of the QIA and 3CB methods were lesion segmentation, characterization, and subsequent classification for malignancy in leave-one-case-out cross-validation. Performance assessment included box plots, Bland-Altman plots, and Receiver Operating Characteristic (ROC) analysis.
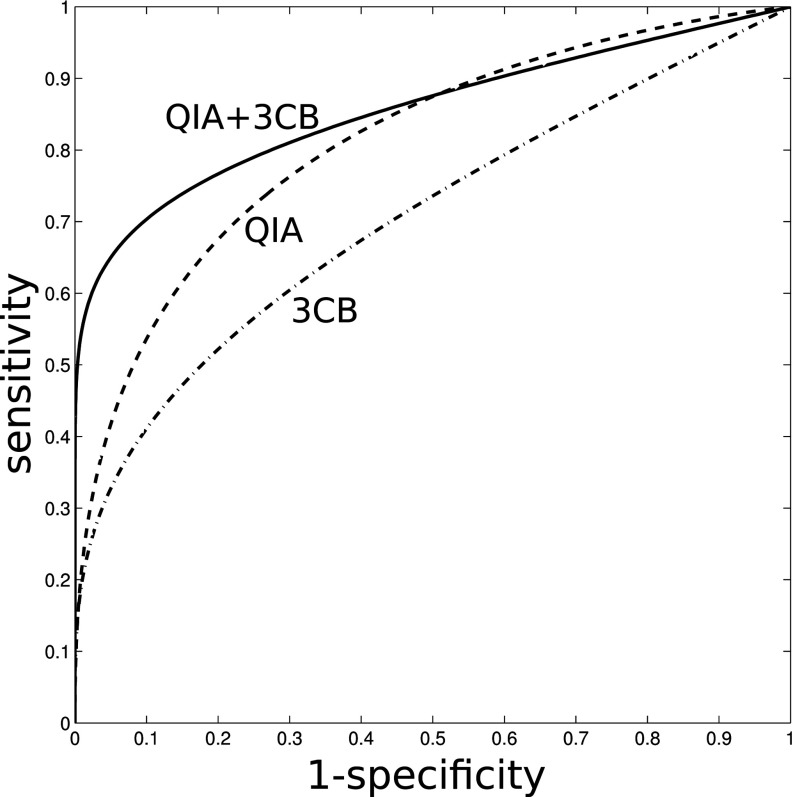
Results: The area under the ROC curve (AUC) for distinguishing between benign and malignant lesions (invasive and DCIS) was 0.81 (standard error 0.07) for the "QIA alone" method, 0.72 (0.07) for "3CB alone" method, and 0.86 (0.04) for "QIA+3CB" combined. The difference in AUC was 0.043 between "QIA + 3CB" and "QIA alone" but failed to reach statistical significance (95% confidence interval [-0.17 to + 0.26]).
Conclusions: In this pilot study analyzing the new 3CB imaging modality, knowledge of the composition of breast lesions and their periphery appeared additive in combination with existing mammographic QIA methods for the distinction between different benign and malignant lesion types.
Figures
References
-
- Salomon A., “Beiträge zur Pathologie und Klinik der Mammakarzinome,” Arch. Klin. Chir. 101, 573–668 (1913).
-
- Shtern F., “Digital mammography and related technologies: A perspective from the National Cancer Institute,” Radiology 183, 629–630 (1992). - PubMed
-
- Kerlikowske K., Hubbard R. A., Miglioretti D. L., Geller B. M., Yankaskas B. C., Lehman C. D., Taplin S. H., and Sickles E. A., “Comparative effectiveness of digital versus film-screen mammography in community practice in the United States: A cohort study,” Ann. Intern. Med. 155, 493–502 (2011). 10.7326/0003-4819-155-8-201110180-00005 - DOI - PMC - PubMed
-
- Pisano E. D., Gatsonis C. A., Yaffe M. J., Hendrick R. E., Tosteson A. N., Fryback D. G., Bassett L. W., Baum J. K., Conant E. F., Jong R. A., Rebner M., and D’Orsi C. J., “American College of Radiology Imaging Network digital mammographic imaging screening trial: Objectives and methodology,” Radiology 236, 404–412 (2005). 10.1148/radiol.2362050440 - DOI - PubMed
-
- Kerlikowske K., Zhu W., Hubbard R. A., Geller B., Dittus K., Braithwaite D., Wernli K. J., Miglioretti D. L., and O’Meara E. S., “Outcomes of screening mammography by frequency, breast density, and postmenopausal hormone therapy,” JAMA Intern. Med. 173, 807–816 (2013). 10.1001/jamainternmed.2013.307 - DOI - PMC - PubMed
Publication types
MeSH terms
Substances
Grants and funding
LinkOut - more resources
Full Text Sources
Other Literature Sources
Medical
