. 2014 May;8(3):689-703.
doi: 10.1016/j.molonc.2014.01.012. Epub 2014 Feb 6.

miRNA cargo within exosome-like vesicle transfer influences metastatic bone colonization

Affiliations

miRNA cargo within exosome-like vesicle transfer influences metastatic bone colonization

Karmele Valencia et al. Mol Oncol. 2014 May.

Abstract

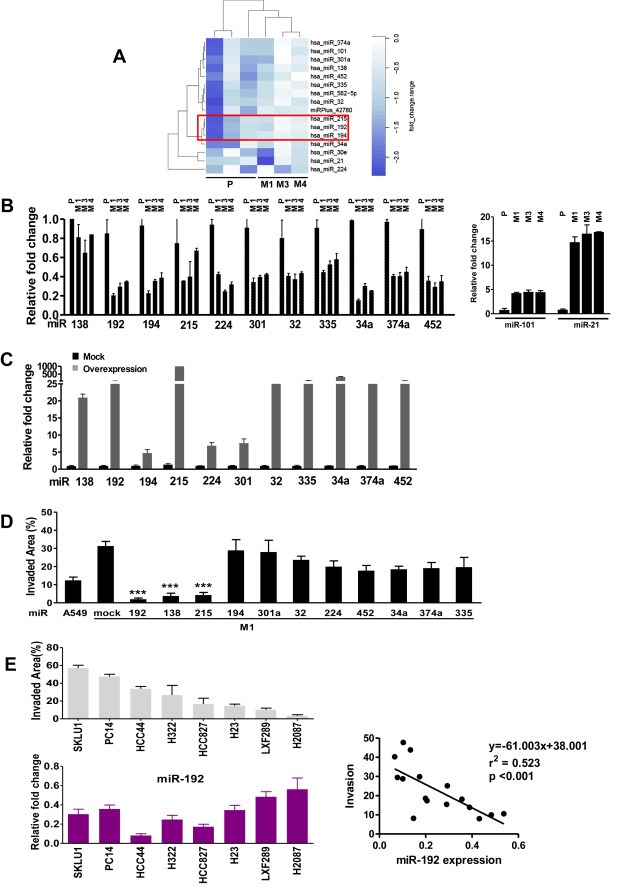
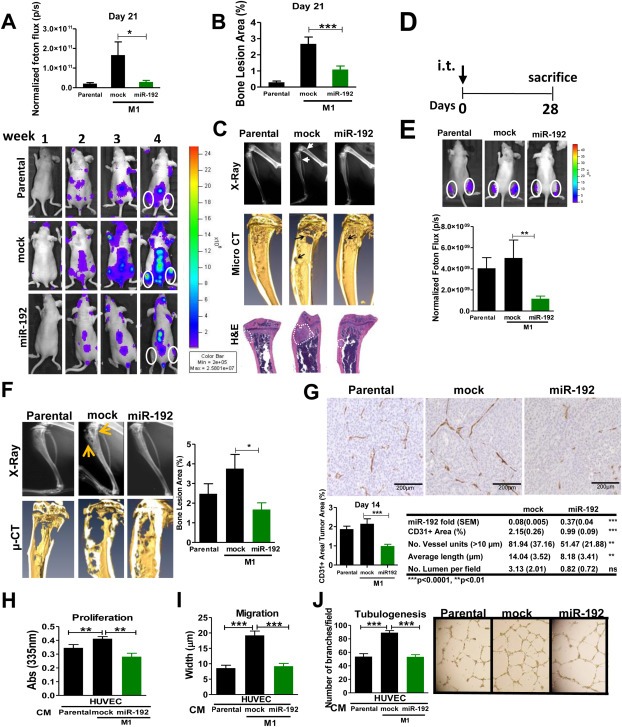
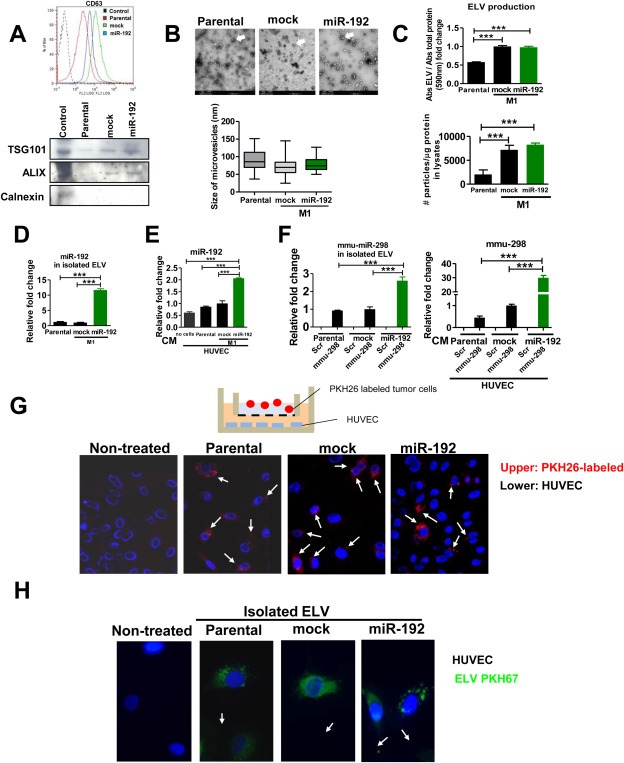
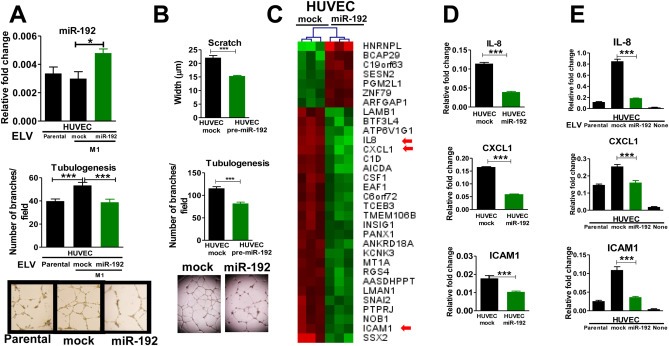
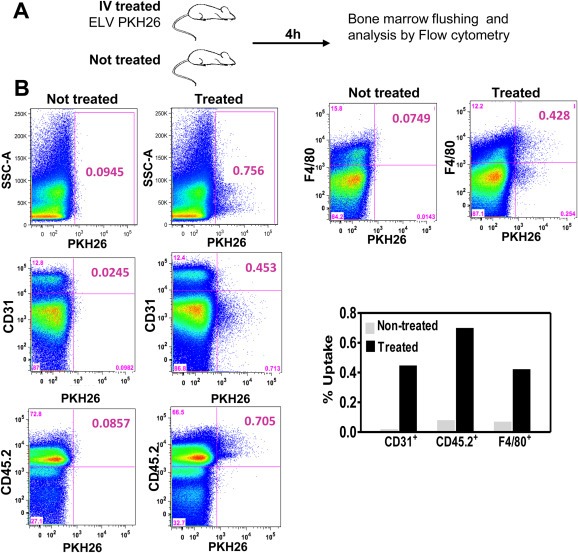
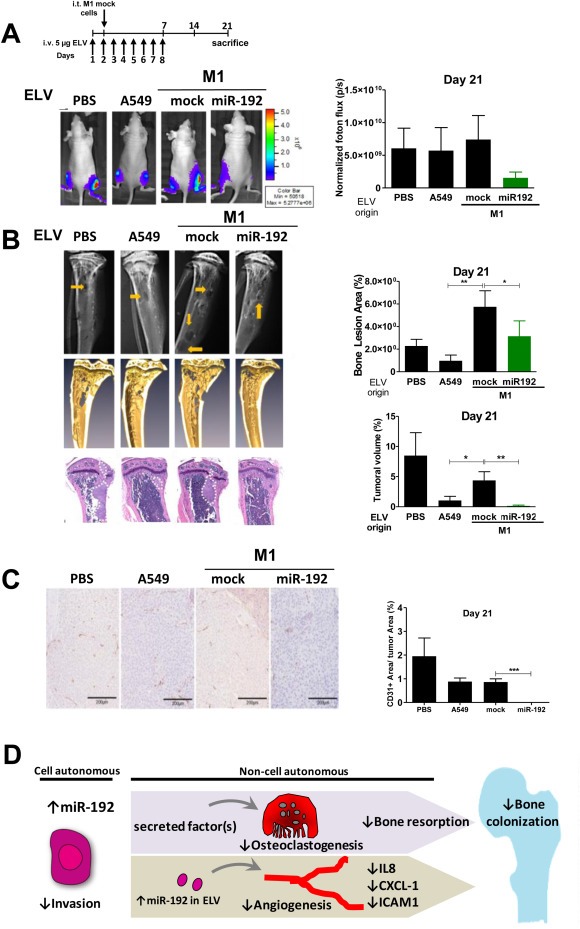
Bone metastasis represents one of the most deleterious clinical consequences arising in the context of many solid tumors. Severe osteolysis results from tumor cell colonization of the bone compartment, a process which entails reciprocal exchange of soluble signals between tumor cells and their osseous microenvironment. Recent evidence indicates that tumor-intrinsic miRNAs are pleiotropic regulators of gene expression. But they are also frequently released in exosome-like vesicles (ELV). Yet the functional relevance of the transference of tumor-derived ELV and their miRNA cargo to the extracellular milieu during osseous colonization is unknown. Comparative transcriptomic profiling using an in vivo murine model of bone metastasis identified a repressed miRNA signature associated with high prometastatic activity. Forced expression of single miRNAs identified miR-192 that markedly appeased osseous metastasis in vivo, as shown by X-ray, bioluminescence imaging and microCT scans. Histological examination of metastatic lesions revealed impaired tumor-induced angiogenesis in vivo, an effect that was associated in vitro with decreased hallmarks of angiogenesis. Isolation and characterization of ELV by flow cytometry, Western blot analysis, transmission electron microscopy and nanoparticle tracking analysis revealed the ELV cargo enrichment in miR-192. Consistent with these findings, fluorescent labeled miR-192-enriched-ELV showed the in vitro transfer and release of miR-192 in target endothelial cells and abrogation of the angiogenic program by repression of proangiogenic IL-8, ICAM and CXCL1. Moreover, in vivo infusion of fluorescent labeled ELV efficiently targeted cells of the osseous compartment. Furthermore, treatment with miR-192 enriched ELV in a model of in vivo bone metastasis pre-conditioned osseous milieu and impaired tumor-induced angiogenesis, thereby reducing the metastatic burden and tumor colonization. Changes in the miRNA-cargo content within ELV represent a novel mechanism heavily influencing bone metastatic colonization, which is most likely relevant in other target organs. Mechanistic mimicry of this phenomenon by synthetic nanoparticles could eventually emerge as a novel therapeutic approach.

Keywords: Adenocarcinoma; Angiogenesis; Cell communication; Exosome; HUVEC; Lung cancer; Metastasis.


Figures

Figure 1
Figure 1
Identification of metastatic associated‐miR signature. A. Unsupervised clustering of HMS (M1, M3 and M4) and parental A549 cells (P). Dark blue denotes strong repression, whereas white denotes “no change”. B. Validation of all single differentially expressed miRNAs in the HMS (M1, M3 and M4) and A549 by qPCR. C. Relative expression of different miRNA in M1 highly‐metastatic‐subpopulation retrovirally transduced with a single miRNA as compared to mock transduced M1 cells. D. Invasive assay with collagen type I in Boyden chambers of M1 cells overexpressing each single miRNA compared to mock transfected M1 cells. A number of 2 × 105 cells was seeded with >95% viability for each cell line. E. Top: Invasion assay in a panel of human ADC cell lines. Bottom: Relative expression levels of miR‐192 in the panel of ADC cell lines. Right: A robust correlation was shown between invasiveness and miR‐192 expression levels. *p < 0.05, **p < 0.01, **p < 0.001.
Figure 2
Figure 2
Effect of miR‐192 in bone metastasis and colonization in vivo. A. Cells overexpressing miR‐192 levels, vector‐transduced (mock), and parental (A549) cells were inoculated into the left cardiac ventricle of athymic nude mice. Top: Quantification of photon flux at day 21 post‐inoculation and Bottom: representative BLI. B. Quantification of osteolytic bone area of X‐ray imaging at day 21 post‐inoculation. C. Representative images of X‐ray (top), micro‐CT scans (middle), and H&E sections (bottom) showing the dramatic decrease of bone metastasis burden in animals inoculated with miR‐192 cells. Arrowhead indicates the location of osteolytic lesions. Metastatic area is depicted by a punctate line. D. Experimental regimen of bone colonization assay after intratibial injection of miR‐192 cells. E. Top: BLI quantification. Bottom: Representative photon flux images in the metaphyses of tumor‐bearing mice. F. Left: Bones were analyzed by X‐ray and μCT scans. Right: Quantification of osteolytic lesions in miR‐192 overexpressed cells of injected animals demonstrated a decreased tumor burden in the metaphyses. G. Immunohistochemical analysis of CD31+ cells in tumors. Top: M1 overexpressing miR‐192 cells exhibited a significant decrease in tumoral vessels. Representative images. Scale bar = 200 μm. Bottom left: Quantification of CD31+ area. Bottom right: Expression levels of miR‐192 were assessed by RT‐qPCR after microdissection of paraffin sections derived from mice i.c. inoculated with mock and miR‐192 overexpressing cells. Angiogenic parameters in metastatic bone lesions were assessed by image analysis. H. Cell proliferation of HUVEC cells induced after 72 h co‐culture with parental A549 cells, mock transduced, and miR‐192 overexpressing cells. I. Cell migration assay (scratch assay) of HUVEC cells after 72 h co‐culture with parental A549 cells, mock transduced, and miR‐192 overexpressing cells. J. Left: Tubulogenesis assay of HUVEC cells after 72 h co‐culture with parental A549 cells, mock transduced and miR‐192 overexpressing cells. Right: Representative images.
Figure 3
Figure 3
Characterization of tumor‐derived ELV. A. Top: FACS analysis demonstrating the presence of CD63+ vesicles in ELV in ultracentrifugated CM from parental (A549), mock (M1, mock‐transduced), and miR‐192‐overexpressing cells (M1, transduced with miR‐192). Bottom: western blot analysis of ELV proteins such as TSG101 and Alix, as compared to Calnexin, a cytoplasmic protein not present in exosomes, in ELV isolated from parental, mock and miR‐192‐overexpressing cells. B. Top: Transmission electron microscopy images of microvesicles derived from their respective cells, with a range ∼40–150 nm, compatible with exosomal like vesicles (ELV). Bar = 500 nm. Bottom: Quantification in random fields was performed by image analysis. C. Top: ELV production levels were determined by measuring the amount of protein in the ELVs isolated from supernatants normalized with the total amount of protein in cell lysates. A greater amount of ELV protein from mock and miR‐192 cells were detected compared to the parental cell line A549. Bottom: The number of particles assessed by Nanosight technology was normalized with the total amount of protein of cell lysates from which they derived. Of note, a greater number of particles was released from mock and miR‐192 cells than from parental cells. D. Relative fold content of miR‐192 levels in isolated ELVs assessed by qPCR. E. Quantification of miR‐192 measured in HUVEC cells co‐cultured in Boyden chambers with parental, mock and miR‐192 overexpressing cells. We observed high levels of miR‐192 in HUVEC cells co‐cultured with tumor miR‐192 cells as compared to HUVEC cultured alone. F. Transitory overexpression with a murine miRNA, mmu‐miR‐298 or scramble (scr), was performed in parental, mock, and miR‐192 tumor cells. Left: Quantification by qPCR of mmu‐miR‐298 levels in isolated ELVs released by parental, mock and miR‐192 cells previously transfected with scramble (scr) or mmu‐miR‐298. Right: Quantification by qPCR of mmu‐miR‐298 levels in HUVEC cells co‐cultured in Boyden chambers with parental, mock and miR‐192 tumor cells previously transfected with scramble (scr) or mmu‐miR‐298. G. Tumor cells (parental, mock, and miR‐192) were fluorescently‐labeled with PKH26 and cocultured in Boyden chambers with HUVEC as in the figure. Unlabeled cells were used a negative control and nuclei were counterstained with DAPI. Positive red fluorescence was detected in HUVEC cells in the three conditions. H. Isolated ELVs from indicated cells were fluorescently labeled with PKH67 and incubated with HUVEC cells. Nuclei were counterstained with DAPI and exhibited the presence of incorporated ELVs in the cytoplasm of HUVEC cells (in green).
Figure 4
Figure 4
In vitro effects of ELV transfer in endothelial cells. A. Top: Quantification of miR‐192 assessed by qPCR in HUVEC previously incubated with 2 μg of ELVs from parental, mock, and miR‐192 cells for 72 h. Bottom: Tubulogenesis assay of HUVEC cells after 72 h of treatment with ELV isolated from parental, mock, and miR‐192 cells and representative images. B. Scratch and tubulogenesis assay of HUVEC cells after transfection with a pre‐miR‐192 or mock empty vector. C. Hierarchical cluster after integrative transcriptomic analysis of HUVEC cells overexpressing miR‐192 and mock transfected. Top list of the most significantly overexpressed (red) and repressed (green) genes are represented. Several angiogenesis‐related genes were found to be altered (red arrows). D. qRT‐PCR analysis confirmed the alteration of ICAM1, CXCL1, and IL‐8 in HUVEC cells transfected with miR‐192 or mock. E. qRT‐PCR analysis of HUVEC cells after 72 h incubation with 2 μg ELV isolated from parental, mock, and miR‐192 tumor cells.
Figure 5
Figure 5
In vivo transfer of ELV to cells in the bone marrrow compartment. A. Outline of the experimental setting. After PKH26‐labeling, fluorescently‐labeled ELV were injected and 4 h later, bone marrow flushing was performed and cells were analyzed by flow cytometry. Untreated mice were used as control. B. Bivariate displays of flow cytometry analysis showing an increase labeling of CD31+, CD45+ and F4/80+ cell populations in mice treated with PKH26–labeled ELV (right column) as compared to untreated mice (left column).
Figure 6
Figure 6
In vivo effects of ELV treatment in metastatic activity. A. Top: Experimental regimen preconditioning the animals with isolated ELVs from each of the indicated cell lines. The same M1 cells were i.c. inoculated in all groups one day after the initiation of the treatment. Bottom: Representative images of BLI (left) and quantification (right). B. Left: Representative X‐rays, microCT scans, and H&E staining from representative bones. Right: Quantification of osteolytic lesions in X‐rays (Top) and tumor volume in histological sections (bottom). C. Left: Representative images of CD31+ staining. Right: quantification. D. Model of the multimodal mechanisms elicited by miR‐192. These mechanisms include tumor cell intrinsic and non‐cell autonomous effects acting on host cells of the bone microenvironment.

References

    1. Antonyak, M.A. , Li, B. , Boroughs, L.K. , Johnson, J.L. , Druso, J.E. , 2011. Cancer cell-derived microvesicles induce transformation by transferring tissue transglutaminase and fibronectin to recipient cells. Proc. Natl. Acad. Sci. U. S. A.. 108, 4852–4857. - PMC - PubMed
    1. Braun, C.J. , Zhang, X. , Savelyeva, I. , Wolff, S. , Moll, U.M. , 2008. p53-Responsive micrornas 192 and 215 are capable of inducing cell cycle arrest. Cancer Res.. 68, 10094–10104. - PMC - PubMed
    1. Cai, Z. , Chen, Q. , Chen, J. , Lu, Y. , Xiao, G. , 2009. Monocyte chemotactic protein 1 promotes lung cancer-induced bone resorptive lesions in vivo. Neoplasia. 11, 228–236. - PMC - PubMed
    1. Catena, R. , Luis-Ravelo, D. , Anton, I. , Zandueta, C. , Salazar-Colocho, P. , 2011. PDGFR signaling blockade in marrow stroma impairs lung Cancer bone metastasis. Cancer Res.. 71, 164–174. - PubMed
    1. Coenegrachts, L. , Maes, C. , Torrekens, S. , Van Looveren, R. , Mazzone, M. , 2010. Anti-placental growth factor reduces bone metastasis by blocking tumor cell engraftment and osteoclast differentiation. Cancer Res.. 70, 6537–6547. - PubMed

Publication types

MeSH terms