. 2014 Apr 22:1559:11-25.
doi: 10.1016/j.brainres.2014.02.043. Epub 2014 Mar 2.

Cholinergic modulation of event-related oscillations (ERO)

Affiliations

Cholinergic modulation of event-related oscillations (ERO)

Manuel Sanchez-Alavez et al. Brain Res. .

Abstract

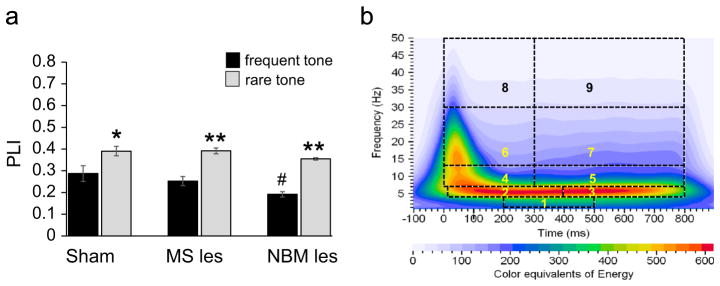
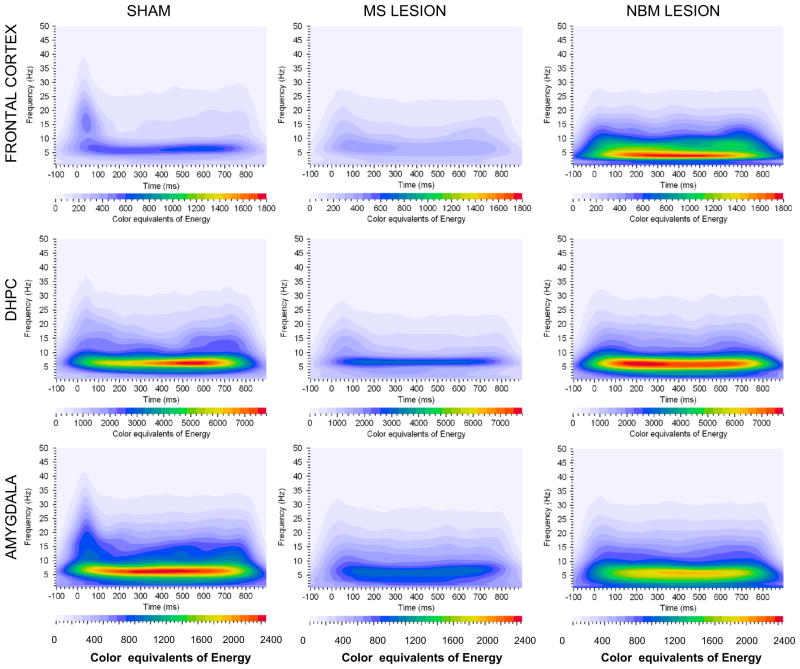
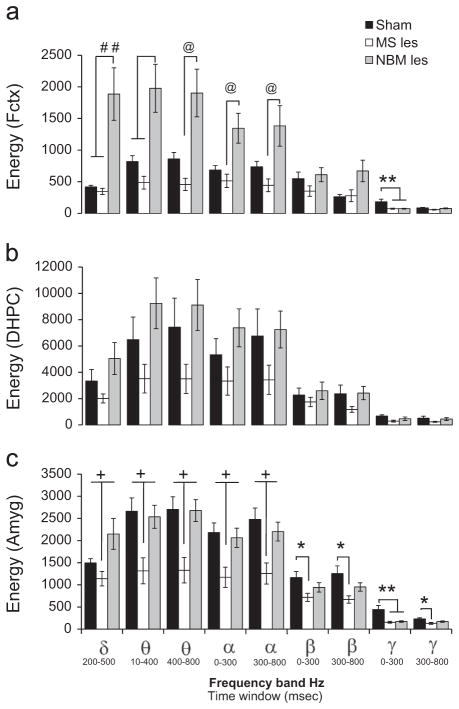
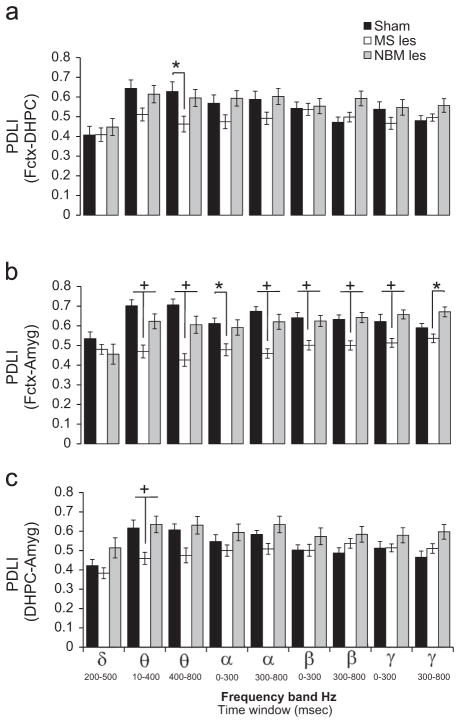
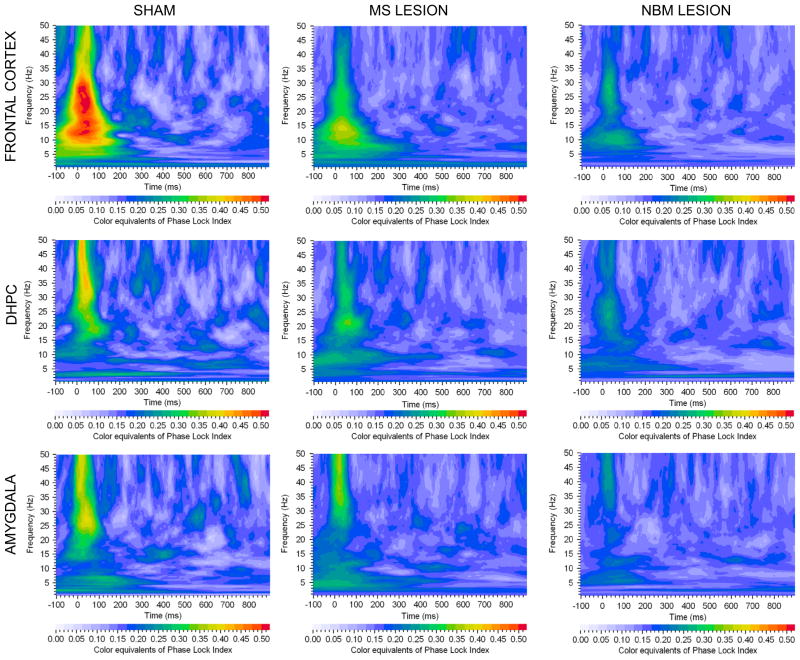
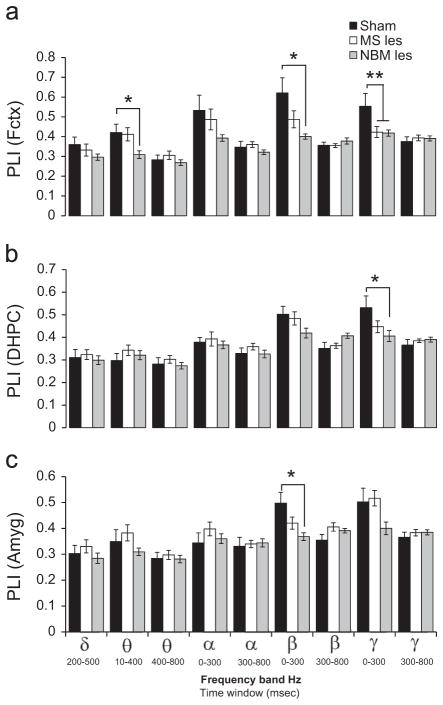
The cholinergic system in the brain modulates patterns of activity involved in general arousal, attention processing, memory and consciousness. In the present study we determined the effects of selective cholinergic lesions of the medial septum area (MS) or nucleus basalis magnocellularis (NBM) on amplitude and phase characteristics of event related oscillations (EROs). A time-frequency based representation was used to determine ERO energy, phase synchronization across trials, recorded within a structure (phase lock index, PLI), and phase synchronization across trials, recorded between brain structures (phase difference lock index, PDLI), in the frontal cortex (Fctx), dorsal hippocampus (DHPC) and central amygdala (Amyg). Lesions in MS produced: (1) decreases in ERO energy in delta, theta, alpha, beta and gamma frequencies in Amyg, (2) reductions in gamma ERO energy and PLI in Fctx, (3) decreases in PDLI between the Fctx-Amyg in the theta, alpha, beta and gamma frequencies, and (4) decreases in PDLI between the DHPC-Amyg and Fctx-DHPC in the theta frequency bands. Lesions in NBM resulted in: (1) increased ERO energy in delta and theta frequency bands in Fctx, (2) reduced gamma ERO energy in Fctx and Amyg, (3) reductions in PLI in the theta, beta and gamma frequency ranges in Fctx, (4) reductions in gamma PLI in DHPC and (5) reduced beta PLI in Amyg. These studies suggest that the MS cholinergic system can alter phase synchronization between brain areas whereas the NBM cholinergic system modifies phase synchronization/phase resetting within a brain area.

Keywords: Cholinergic system; Electroencephalogram; Event related oscillation; Event-related potential; Phase difference lock index; Phase lock index.


Conflict of interest statement

Conflict of interest

Dr. Ehlers work has been funded by the NIH. She has received compensation as a consultant from Neurocrine Biosciences and Raptor Pharmaceutical Corp. in capacities not related to the subject of the report. Dr. Manuel Sanchez-Alavez, Dr. Patricia Robledo Dr. Jim Havstad and Derek Wills declare no potential conflicts of interest.

Figures

Fig. 1
Fig. 1
(a) Grand mean values for the phase locking index (PLI) of event-related oscillations in sham operated, MS- and NBM-lesion rats. ANOVA revealed that the rare (infrequent) tone (gray bars), as compared to the standard (frequent) tone (black bars) produce significant increase in phase locking in ROI. (b) schematic representations of ROI: ROI1 (delta band, 1–4 Hz, 200–500 ms), ROI2 (theta band, 4–7 Hz, 10–400 ms), ROI3 (theta band, 4–7 Hz, 400–800 ms), ROI4 (alpha band, 7–13 Hz, 0–300 ms), ROI5 (alpha band, 7–13 Hz, 300–800 ms), ROI6 (beta band, 13–30 Hz, 0–300 ms), ROI7 (beta band13–30 Hz, 300–800 ms), ROI8 (gamma band, 30–50 Hz, 0–300 ms), and ROI9 (gamma band, 30–50 Hz, 300–800 ms). Post-hoc Tukey pairwise comparisons indicate the following: frequent tone vs. rare tone (*p<0.05) in sham operated group; frequent tone vs. rare tone (**p<0.01) in septal lesion (MS-les) and NBM lesion (NBM-les) groups. Pairwise comparisons using frequent tone indicate significant reduction in the NBM lesion group (#p<0.05, sham vs. NBM lesion).
Fig. 2
Fig. 2
Grand averages of event related oscillations energy color equivalent for sham-operated, MS-lesion (MS les) and NBM-lesion (NBM les). Each graph depicts a time–frequency representation of ERO energy values in the delta, theta, alpha, beta and gamma bands following the rare tone in Frontal cortex, dorsal hippocampus (DHPC) and Amygdala electrode locations. In each graph frequency (Hz) is presented on the Y-axis, time regions of interest on the X-axis (ms) and ERO energy is presented as color equivalents of energy as indicated in the color bar at the bottom of each graph. NBM-lesion produced increases in color equivalents in frontal cortex (color equivalents in sham and MS les was adjusted to NBM les scale for visual purposes) and MS-lesion produced decreases in color equivalents in amygdala (color equivalents in NBM les and MS les was adjusted sham scale for visual purposes).
Fig. 3
Fig. 3
MS-lesion reduces ERO energy in amygdala and NBM-lesion increases ERO energy in Frontal cortex. Grand mean values for the event-related oscillations energy equivalents in sham operated (black bars), MS-lesion (white bars) and NBM-lesion (gray bars) rats for the rare tone in ROI1 (delta band,1–4 Hz, 200–500 ms), ROI2 (theta band, 4–7 Hz, 10–400 ms), ROI3 (theta band, 4–7 Hz, 400–800 ms), ROI4 (alpha band, 7–13 Hz, 0–300 ms), ROI5 (alpha band, 7–13 Hz, 300–800 ms), ROI6 (beta band, 13–30 Hz, 0–300 ms), ROI7 (beta band, 13–30 Hz, 300–800 ms), ROI8 (gamma band, 30–50 Hz, 0–300 ms), and ROI9 (gamma band, 30–50 Hz, 300–800 ms). Energy was calculated in: (a) the frontal cortex (Fctx), (b) dorsal hippocampus (DHPC), and (c) amygdala (Amyg). Compared to sham lesions, lesions in MS decreased ERO energy in frontal cortex only in the gamma frequency band (ROI8, see (a)) and reduced the ERO energy in the theta (ROI2, ROI3), alpha (ROI4, ROI5), beta (ROI6, ROI7), and gamma (ROI8, ROI9), frequency bands in amygdala (see (c)). Compared to sham lesions, lesions in NBM significantly increased ERO energy in frontal cortex in the delta (ROI1), and theta (ROI2) frequency bands and significantly reduced ERO energy in the gamma (ROI8) frequency band (see (a)); in addition, lesions in NBM induced a reduction in ERO energy in the gamma (ROI8) frequencies in the amygdala (see (c)). ERO energy in the alpha frequency band was significantly increased when the NBM lesion group was compared to MS lesion group but not to the sham operated controls (see (a)). Post-hoc Tukey pairwise comparisons indicate the following: sham vs. MS–les (*p<0.05), sham vs. MS-les and NBM–les (**p<0.05), MS-les vs. sham and NBM=les (+p<0.05), NBM-les vs. sham and MS-les (#p<0.05) and NBM–les vs. MS-les (@p<0.05).
Fig. 4
Fig. 4
MS lesion reduces phase synchronization between Frontal cortex-amygdala and between dorsal hippocampus–amygdala. Grand mean values for the phase difference lock index (PDLI) of event-related oscillations (EROs) in sham operated (black bars), MS-lesion (white bars) and NBM-lesion (gray bars) rats for the rare tone in ROI1 (delta band, 1–4 Hz, 200–500 ms), ROI2 (theta band, 4–7 Hz, 10–400 ms), ROI3 (theta band, 4–7 Hz, 400–800 ms), ROI4 (alpha band, 7–13 Hz, 0–300 ms), ROI5 (alpha band, 7–13 Hz, 300–800 ms), ROI6 (beta band, 13–30 Hz, 0–300 ms), ROI7 (beta band, 13–30 Hz, 300–800 ms), ROI8 (gamma band, 30–50 Hz, 0–300 ms), and ROI9 (gamma band, 30–50 Hz, 300–800 ms). In the upper graph (a), phase difference was calculated between frontal cortex (Fctx) and dorsal hippocampus (DHPC); in the middle graph (b), phase difference was calculated between Fctx and amygdala (Amyg); and in the bottom graph (c), phase difference was calculated between DHPC and Amyg. MS lesions reduced phase synchronization between frontal cortex and DHPC (Fctx–DHPC) in the theta (ROI3) frequency bands. In addition, MS lesions reduced phase synchronization between frontal cortex and amygdala (Fctx–Amyg) in theta (ROI2 and ROI3), alpha (ROI4 and ROI5), beta (ROI6 and ROI7) and gamma (ROI8) frequency bands and reduced phase synchronization between dorsal hippocampus–amygdala (DHPC–Amyg) in theta (ROI2) frequency band. Post-hoc Tukey pairwise comparisons indicate the following: sham vs. MS-les or MS-less vs. NBM (*p<0.05), and MS-les vs. sham and NBM–les (+p<0.05).
Fig. 5
Fig. 5
Grand averages of phase locking index values of event related oscillations for sham-operated, MS-lesion and NBM-lesion rats. Each graph depicts a time–frequency representation of PLI values in the delta, theta, alpha, beta and gamma bands following the rare tone in Frontal cortex, dorsal hippocampus (DHPC) and Amygdala electrode locations. In each graph frequency (Hz) is presented on the Y-axis, time regions of interest on the X-axis (ms) and PLI is presented as color equivalents as indicated in the bar at the bottom of each graph. NBM lesion shows reduction in color equivalents of phase locking at all three electrode sites.
Fig. 6
Fig. 6
Effects of NBM-lesions on phase synchronization in frontal cortex, dorsal hippocampus or amygdala. Grand mean values for the phase locking index (PLI) of event-related oscillations in sham operated (black bars), MS-lesion (white bars) and NBM-lesion (gray bars) rats for the rare tone in ROI1 (delta band, 1–4 Hz, 200–500 ms), ROI2 (theta band, 4–7 Hz, 10–400 ms), ROI3 (theta band, 4–7 Hz, 400–800 ms), ROI4 (alpha band, 7–13 Hz, 0–300 ms), ROI5 (alpha band, 7–13 Hz, 300–800 ms), ROI6 (beta band, 13–30 Hz, 0–300 ms), ROI7 (beta band, 13–30 Hz, 300–800 ms), ROI8 (gamma band, 30–50 Hz, 0–300 ms), and ROI9 (gamma band, 30–50 Hz, 300–800 ms). Phase locking index was calculated in: (a) the frontal cortex (Fctx), (b) dorsal hippocampus (DHPC), and (c) amygdala (Amyg). Compared to sham operated rats, MS-lesions (MS les) induced a significant reduction in gamma PLI in Fctx. Compared to sham operated rats NBM-lesion (NBM les) induced a significant reduction in gamma phase locking in Fctx and DHPC and a significant reduction in beta phase locking in Fctx and Amyg and theta phase locking in Fctx. Post-hoc Tukey pairwise comparisons indicate the following: sham vs. NBM-les (*p<0.05) and sham vs. MS-les and NBM-les (**p<0.05).

References

    1. Amaral DG, Kurz J. An analysis of the origins of the cholinergic and noncholinergic septal projections to the hippocampal formation of the rat 240, 37–59J. Comp Neurol. 1985;240:37–59. - PubMed
    1. Andrew C, Fein G. Event-related oscillations versus event-related potentials in a P300 task as biomarkers for alcoholism. Alcohol Clin Exp Res. 2010;34:669–680. - PMC - PubMed
    1. Barutchu A, Freestone DR, Innes-Brown H, Crewther DP, Crewther SG. Evidence for enhanced multisensory facilitation with stimulus relevance: an electrophysiological investigation. PLoS One. 2013;8:e52978. - PMC - PubMed
    1. Basar-Eroglu C, Basar E, Schmielau F. P300 in freely moving cats with intracranial electrodes. Int J Neurosci. 1991;60:215–226. - PubMed
    1. Basar E. A review of gamma oscillations in healthy subjects and in cognitive impairment. Int J Psychophysiol. 2013;90:99–117. - PubMed

Publication types

MeSH terms