. 2014 Mar 4;15(3):R48.
doi: 10.1186/gb-2014-15-3-r48.

Cell cycle, oncogenic and tumor suppressor pathways regulate numerous long and macro non-protein-coding RNAs

Cell cycle, oncogenic and tumor suppressor pathways regulate numerous long and macro non-protein-coding RNAs

Jörg Hackermüller et al. Genome Biol. .

Abstract

Background: The genome is pervasively transcribed but most transcripts do not code for proteins, constituting non-protein-coding RNAs. Despite increasing numbers of functional reports of individual long non-coding RNAs (lncRNAs), assessing the extent of functionality among the non-coding transcriptional output of mammalian cells remains intricate. In the protein-coding world, transcripts differentially expressed in the context of processes essential for the survival of multicellular organisms have been instrumental in the discovery of functionally relevant proteins and their deregulation is frequently associated with diseases. We therefore systematically identified lncRNAs expressed differentially in response to oncologically relevant processes and cell-cycle, p53 and STAT3 pathways, using tiling arrays.

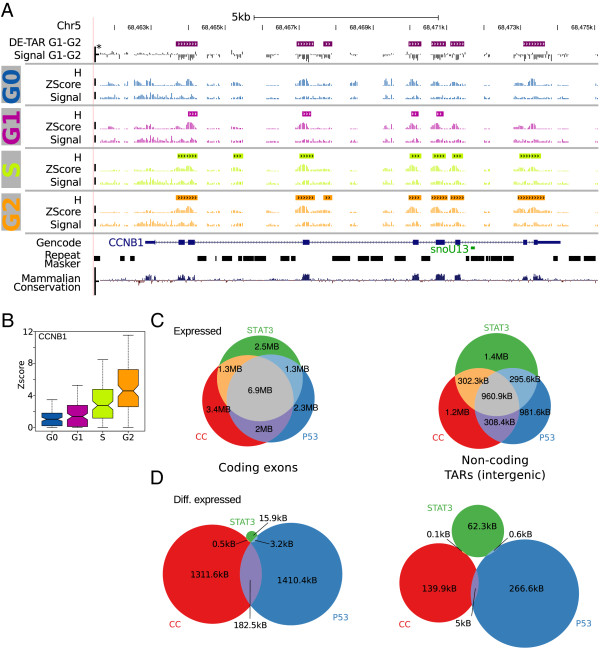
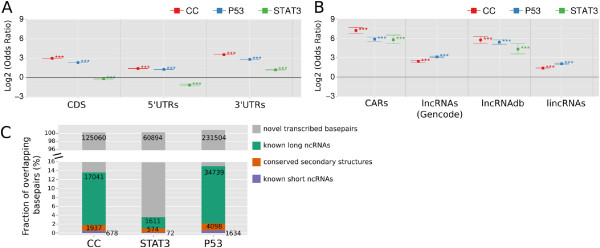
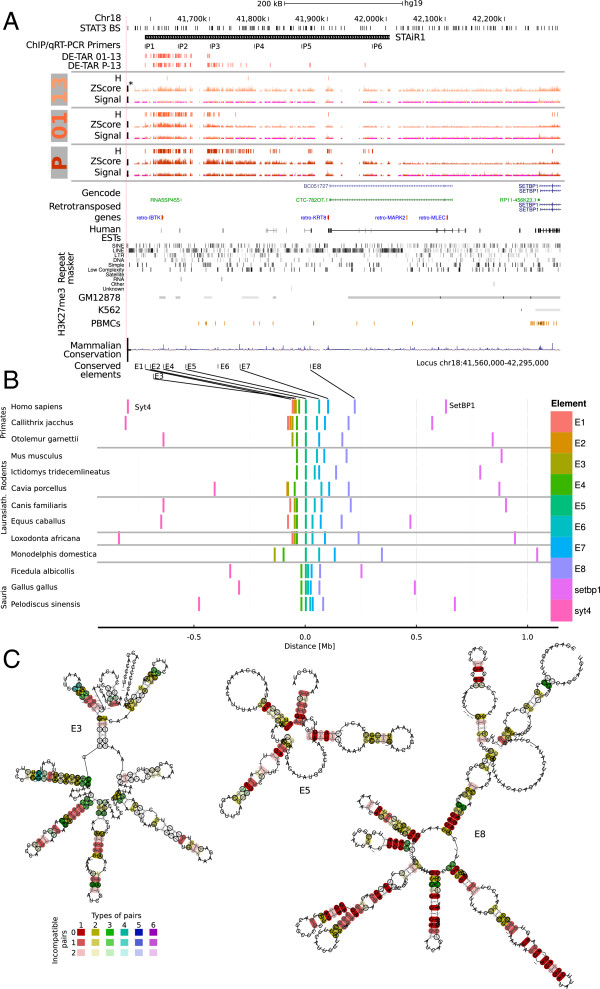
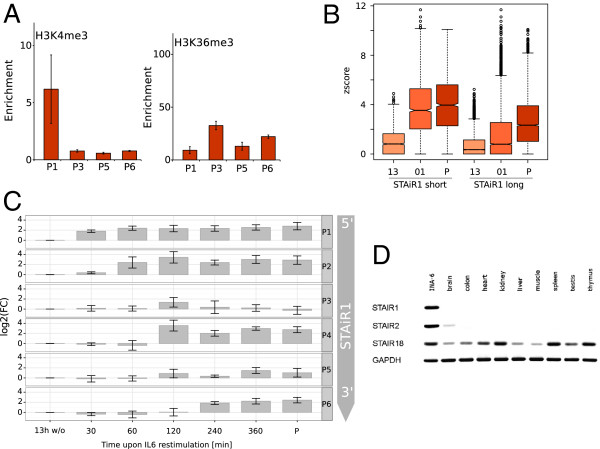
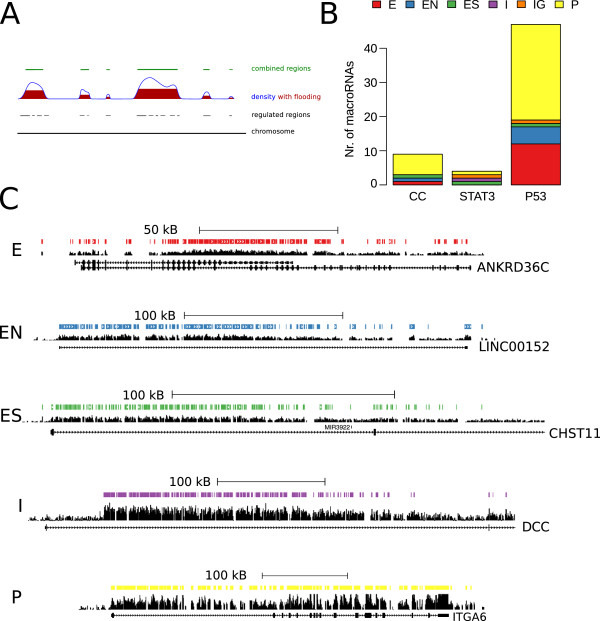
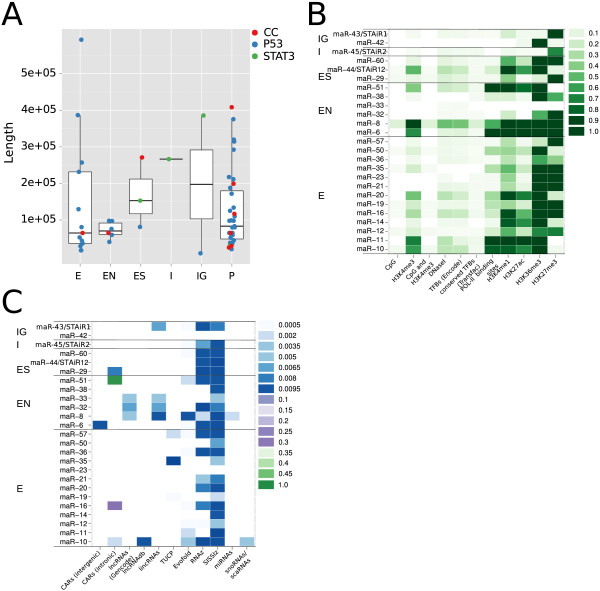
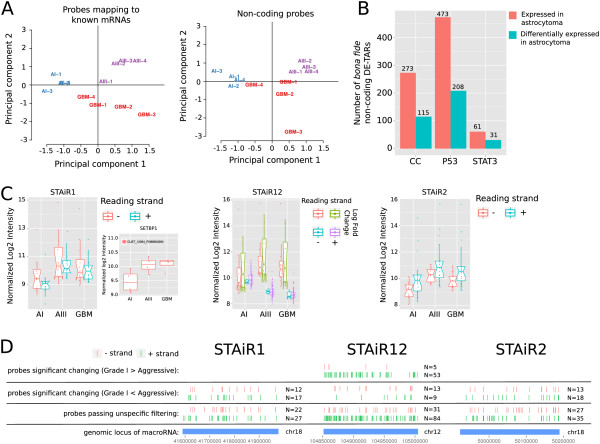
Results: We found that up to 80% of the pathway-triggered transcriptional responses are non-coding. Among these we identified very large macroRNAs with pathway-specific expression patterns and demonstrated that these are likely continuous transcripts. MacroRNAs contain elements conserved in mammals and sauropsids, which in part exhibit conserved RNA secondary structure. Comparing evolutionary rates of a macroRNA to adjacent protein-coding genes suggests a local action of the transcript. Finally, in different grades of astrocytoma, a tumor disease unrelated to the initially used cell lines, macroRNAs are differentially expressed.

Conclusions: It has been shown previously that the majority of expressed non-ribosomal transcripts are non-coding. We now conclude that differential expression triggered by signaling pathways gives rise to a similar abundance of non-coding content. It is thus unlikely that the prevalence of non-coding transcripts in the cell is a trivial consequence of leaky or random transcription events.


Figures

Figure 1
Figure 1
Differentially expressed TARs (DE-TARs).(A) The CCNB1 locus, a positive control for cell-cycle, illustrating the tiling array data analysis workflow employed. For each condition (in this case the cell-cycle phases G0, G1, S and G2), the raw tiling array signal intensities (Signal) in overlapping sliding windows of 200 nt were evaluated to see if the expression was significantly higher than a background distribution, using the TileShuffle algorithm with q<0.05. The background distribution was generated from 10,000 GC controlled permutations of the individual array’s signals. Overlapping windows of significant expression were summarized to intervals labeled H. Analogously, differentially expressed intervals were generated for each pairwise comparison of interest for all intervals designated H in at least one condition of the dataset. Difference signals in windows of the same size were evaluated for a significantly higher differential expression than a background of 100,000 difference shuffles, with q<0.005 and labeled DE-TAR intervals. Repeat masked intervals are missing in the array design due to the ambiguity of probes mapping to these regions. (*) Wiggle track scale bars indicate y-axis scales of (6,16), (0,10), (-3.5,3.5) and (-4,4) for the signal, z-score, differential signal and conservation, respectively. (B) Expression signal from (A) aggregated over all exons of CCNB1. Boxes indicate the median, first and third quantiles. Notches are placed at ±1.58IQR/n and approximate a robust 95% confidence interval. (C) Overlap in expressed nucleotides between STAT3, p53 and cell-cycle (CC) datasets for known coding exons (Gencode v12, UCSC genes, Ensembl and RefSeq) and bona fide non-coding intergenic TARs. (D) Overlap between the three datasets in differentially expressed nucleotides. CC, cell cycle; Chr, chromosome; DE-TAR, significantly differentially expressed TAR; IQR, interquartile range; kb, kilobase; MB, million base pairs; TAR, transcriptionally active region.
Figure 2
Figure 2
DE-TAR overlap with genomic annotation.(A,B) Overlaps in nucleotides between DE-TARs and different annotation categories. Log2 transformed odds ratios and their 95% confidence interval for the respective annotation dataset are shown (annotations are described in detail in Additional file 1: Table S28). To assess the significance of the observed overlap, 100 lists containing random intervals from the genome controlling for repeat content and DE-TAR length were sampled. Odds ratios of observed versus randomized relative overlaps were calculated and tested using Fisher’s exact test for significant enrichment or depletion. *** indicates P<0.001 for the observed versus random nucleotide overlaps, ** P<0.01 and * P<0.05. Results are shown for DE-TARs that overlap annotated protein-coding genes (A) (additional annotations are shown in Additional file 1: Figure S10) and bona fide non-coding DE-TARs that overlap with several classes of experimentally verified and predicted ncRNAs (B) (additional annotations shown in Additional file 1: Figure S11). For the detailed output of Fisher’s exact tests refer to Additional file 1: Tables S4 and S6. (C) Fraction of nucleotides in intergenic bona fide non-coding DE-TARs overlapping with known long ncRNAs (large intergenic non-coding RNAs and transcripts of unknown protein-coding potential as identified in [30], Gencode v12 long ncRNAs, lncRNAs found in the Long Non-Coding RNA Database (lncRNAdb, [49]) and ncRNAs found in chromatin [50]), short RNAs (UCSC sno/miRNA track), conserved secondary structures (Evofold[45], RNAz[44,51] and SISSIz[52]) and novel transcribed nucleotides. CAR, chromatin-associated RNA; CC, cell cycle; CDS, coding sequence; lncRNA, long ncRNA; ncRNA, non-protein-coding RNA; UTR, untranslated region.
Figure 3
Figure 3
STAiR1 – a STAT3-controlled macroRNA.(A) STAiR1 is upregulated in response to STAT3 and was identified by manual inspection of TileShuffle tracks. After 1 h of restimulation with IL-6 (denoted 01 on the left), TileShuffle detects a 130-kB long region of significant upregulation compared to 13-h IL-6 withdrawn cells (13). In cells permanently cultured with IL-6 (P), the region extends to at least 300 kb. It overlaps H3K27me3 domains in ENCODE data identified in GM12878 lymphoblastoid cells and peripheral blood mononuclear cells (PBMCs) derived from healthy donors, which is missing in K562 leukemia cells [5], and several STAT3 binding sites (STAT3 BS). Please refer to the caption of Figure 1, for a definition of signal, H, and DE-TAR tracks and wiggle track scale bars. (B) STAiR1 contains highly conserved elements. STAiR1 was aligned to all vertebrate genomes provided by Ensembl using BLAST[64]. Several conserved elements throughout STAiR1 that did not overlap annotated repeat elements were selected for further analysis. The chart displays the relative location of elements E1 to E8, arbitrarily aligned by E6 for selected genomes. Hits in additional genomes, including those where no continuous scaffold was available for the interval E1 to E8, are shown in Additional file 1: Figure S14. (C)BLAST hits from (B) were initially aligned using Clustalw[65], submitted to RNAalifold[66] and trimmed to regions of conserved secondary structure. The depicted consensus RNA secondary structures were generated by applying LocARNA[67] followed by RNAalifold to the trimmed sequences. The number of different types of base pairs for a consensus pair, i.e. compensatory mutations supporting the structure, is given by the hue, the number of incompatible pairs by the saturation of the consensus base pair. ChIP, chromatin immunoprecipitation; Chr, chromosome; DE-TAR, significantly differentially expressed transcriptionally active region; EST, expressed sequence tag; kb, kilobase; Laurasiath, Laurasiatheria; MB, million base pairs; PBMC, peripheral blood mononuclear cell; PCR, polymerase chain reaction; qRT-PCR, quantitative real-time reverse transcriptase PCR; STAiR, STAT3-induced RNA; STAT3, signal transducer and activator of transcription-3.
Figure 4
Figure 4
STAiR1 – a continuous specifically expressed transcript.(A) INA6 cells were restimulated with IL-6 as described in Figure 3A and chromatin immunoprecipitated (ChIP-ed) for tri-methylated H3K4 and H3K36, respectively. Enrichment compared to an IgG isotype control was assessed by quantitative real-time PCR using primer sets P1, P3, P5 and P6. The location of respective amplicons is shown in Figure 3A. Strong enrichment for H3K4me3 is observed only within P1, indicating an active promoter region. H3K36me3 shows strong enrichment throughout the STAiR1 transcript. (B) Expression z-score aggregated over STAiR1 expressed after 1 h (STAiR1 short, chr18:41,591,020-41,720,348) or the entire annotated STAiR1 transcript (STAiR1 long). (C) INA6 cells were restimulated with IL-6 as described and induction of STAiR1 was detected using qRT-PCR with primer sets P1 to P6, as shown in Figure 3A, and using GAPDH for normalization. This expression time course is consistent with the time-dependent elongation of STAiR1 observed in the tiling array data shown in Figure 3A. (D) Expression of macroRNAs in different tissues, as detected by reverse transcriptase PCR, using GAPDH as a normalization control. Tissue specificity varies strongly between different macroRNAs. STAiR, STAT3-induced RNA; STAT3, signal transducer and activator of transcription-3.
Figure 5
Figure 5
Genomic organization of DE-macroRNAs.(A) Schematic representation of the algorithm used to identify macroRNAs resembling the example in Figure 3A. DE and expressed intervals identified by TileShuffle are summarized as the density of positive nucleotides. Local maxima are identified and the density curve is ‘flooded’ to 50% of the local maximum to identify the boundaries of the region. Overlapping regions are merged and for each region a score based on coverage by positive nucleotides and silhouette is calculated. (B) Computationally identified macroRNAs with a score > 10,000 were manually inspected to discard false positives, which are typically long protein-coding genes with many exons interspersed by small introns. Identified DE-macroRNAs fall into different genomic categories: intergenic (IG), overlapping exons (E), overlapping non-coding exons (EN), located in introns (I), joint start but different end as coding RNA (ES) and presumed primary transcript (P). (C) DE-macroRNA examples for the E, EN, ES, I and P cases. The IG case is illustrated in Figure 3A. Only z-scores and selected transcript isoforms are shown. CC, cell cycle; E, overlapping exons; EN, overlapping non-coding exons; ES, joint start but different end as coding RNA; I, located in introns; IG, intergenic; kB, kilobase; Nr, number; P, presumed primary transcript; STAT3, signal transducer and activator of transcription-3.
Figure 6
Figure 6
Characterization of DE-macroRNAs.(A) The size distribution of DE-macroRNAs indicates similar sizes for the different genomic categories of DE-macroRNAs (intergenic, overlapping exons, overlapping non-coding exons, located in introns, joint start but different end as coding RNA and presumed primary transcript) and throughout the three different transcriptome surveys (cell cycle, p53 and STAT3). (B) Fraction of nucleotides in DE-macroRNAs overlapping with putative promoter regions, transcription factor binding sites, polII binding sites and epigenetically modified regions. (C) Fraction of nucleotides in DE-macroRNAs overlapping with known ncRNA annotations. Annotations are described in detail in Additional file 1: Table S28. CC, cell cycle; E, overlapping exons; EN, overlapping non-coding exons; ES, joint start but different end as coding RNA; I, located in introns; IG, intergenic; P, presumed primary transcript; STAT3, signal transducer and activator of transcription-3.
Figure 7
Figure 7
Disease-associated ncRNAs. The custom microarray was used with diffuse astrocytoma samples of different grades. (A) Principal component analysis for probes passing non-specific filtering. For at least four samples, the expression of the probe must be larger than the background, where background expression is defined by the mean intensities plus three times the standard deviation of negative control spots. The probe must have a non-specific change of expression of IQR>0.5. A separate principal components analysis was done for probes mapping to exons of known protein-coding genes (Gencode v12) and probes for which no evidence of short open reading frames was detected (see Materials and methods). The first two principal components accounted for 55% and 63% of overall variation, for probes mapping to exons of protein-coding genes and bona fide non-coding probes, respectively. (B) Number of bona fide non-coding DE-TARs either expressed in astrocytoma, i.e. overlapping at least one probe with an intensity larger than the background intensity for at least four samples, or differentially expressed in astrocytoma, i.e. overlapping at least one probe significantly differentially expressed between astrocytoma of grade I and aggressive states of grades III and IV (glioblastoma) (FDR<0.05). (C) Box plots depicting normalized log2 intensities of all probes significantly regulated in astrocytoma (grade I compared to aggressive states, FDR<0.05) and located in the genomic loci of three selected macroRNAs, STAiR1, STAiR12 and STAiR2. Notches depict 95% confidence interval of the median intensity. Normalized log2 intensities of a significantly regulated probe corresponding to SETBP1, a gene proximal to STAiR1, is shown next to the STAiR1 plot. (D) Overview of probe positions of probes located in the genomic loci of STAiR1, STAiR12 or STAiR2. CC, cell cycle; DE-TAR, significantly differentially expressed transcriptionally active region; GBM, glioblastoma; IQR, interquartile range; STAiR, STAT3-induced RNA; STAT3, signal transducer and activator of transcription-3.

References

    1. Carninci P, Kasukawa T, Katayama S, Gough J, Frith MC, Maeda N, Oyama R, Ravasi T, Lenhard B, Wells C, Kodzius R, Shimokawa K, Bajic VB, Brenner SE, Batalov S, Forrest ARR, Zavolan M, Davis MJ, Wilming LG, Aidinis V, Allen JE, Ambesi-Impiombato A, Apweiler R, Aturaliya RN, Bailey TL, Bansal M, Baxter L, Beisel KW, Bersano T. et al.The transcriptional landscape of the mammalian genome. Science. 2005;309:1559–1563. - PubMed
    1. Mattick JS, Makunin IV. Non-coding RNA. Hum Mol Genet. 2006;15 Spec No 1:R17–R29. - PubMed
    1. Kapranov P, Willingham AT, Gingeras TR. Genome-wide transcription and the implications for genomic organization. Nat Rev Genet. 2007;8:413–423. - PubMed
    1. The ENCODE Project Consortium. Identification and analysis of functional elements in 1% of the human genome by the ENCODE pilot project. Nature. 2007;447:799–816. - PMC - PubMed
    1. ENCODE Project Consortium. An integrated encyclopedia of DNA elements in the human genome. Nature. 2012;489:57–74. [ http://dx.doi.org/10.1038/nature11247] - DOI - PMC - PubMed

Publication types

MeSH terms