. 2014 May:50:112-22.
doi: 10.1016/j.biocel.2014.02.019. Epub 2014 Mar 1.

Identification of NuRSERY, a new functional HDAC complex composed by HDAC5, GATA1, EKLF and pERK present in human erythroid cells

Affiliations

Identification of NuRSERY, a new functional HDAC complex composed by HDAC5, GATA1, EKLF and pERK present in human erythroid cells

Lilian Varricchio et al. Int J Biochem Cell Biol. 2014 May.

Abstract

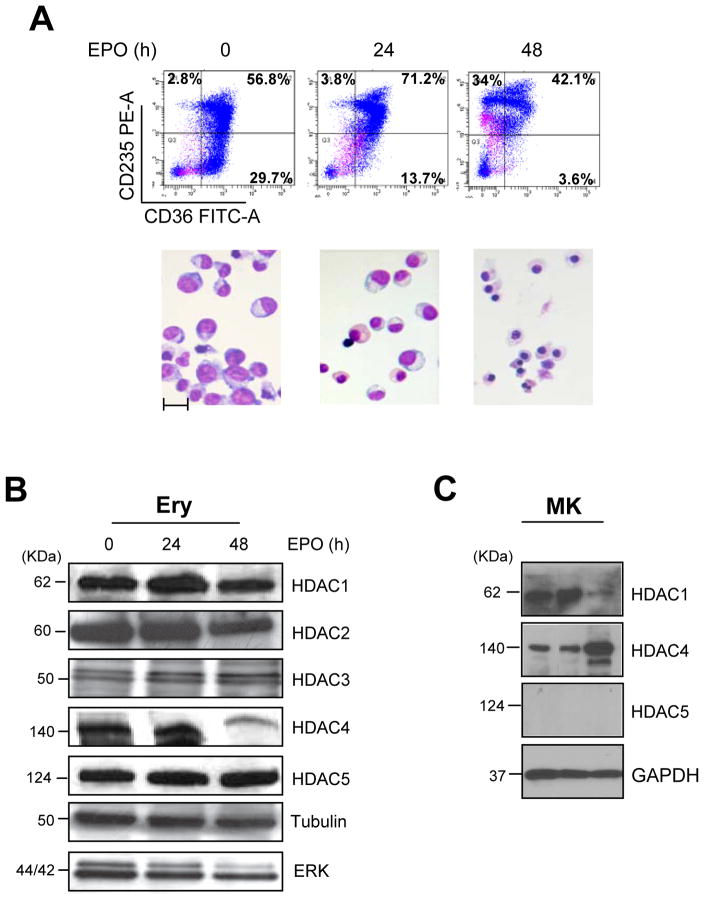
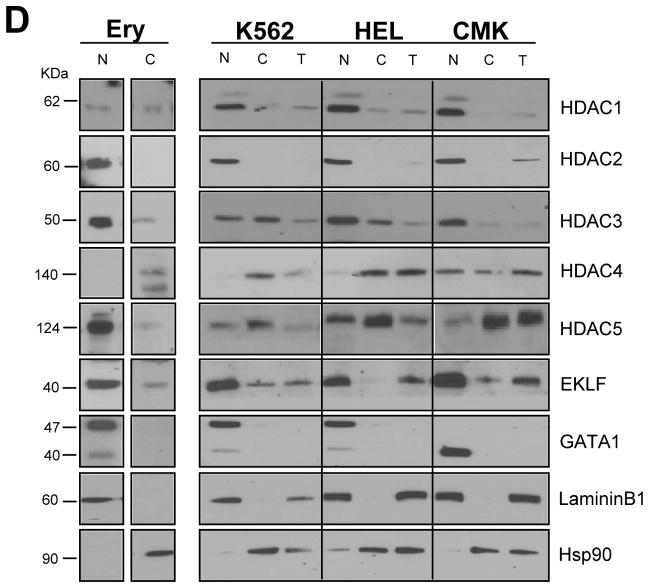
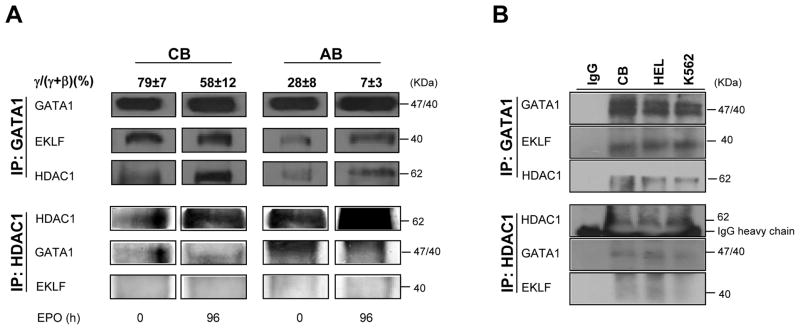
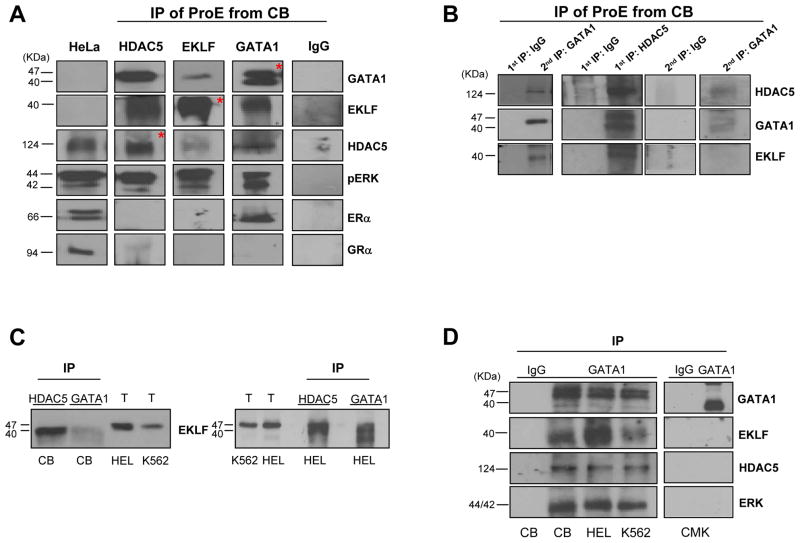
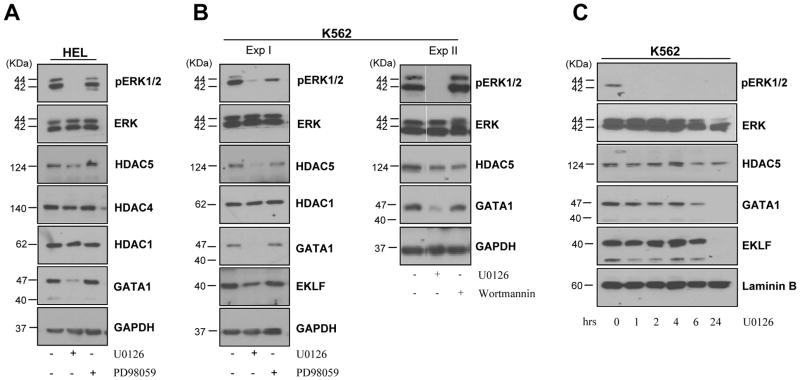
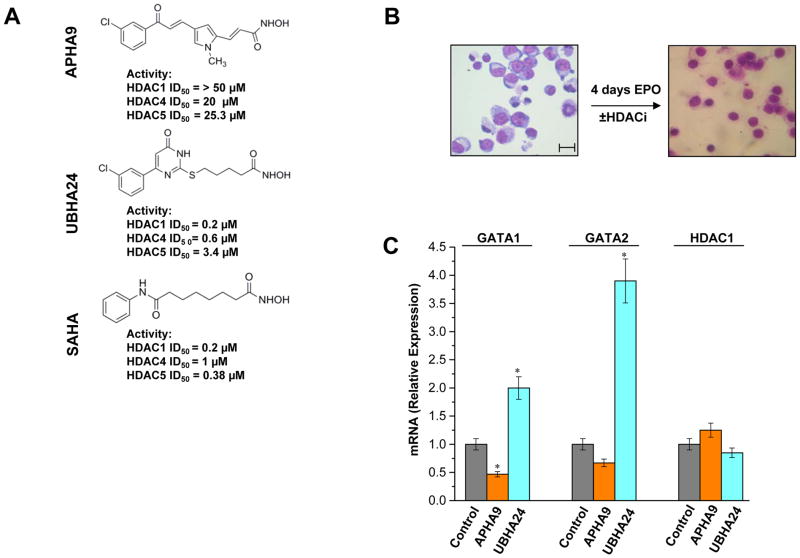
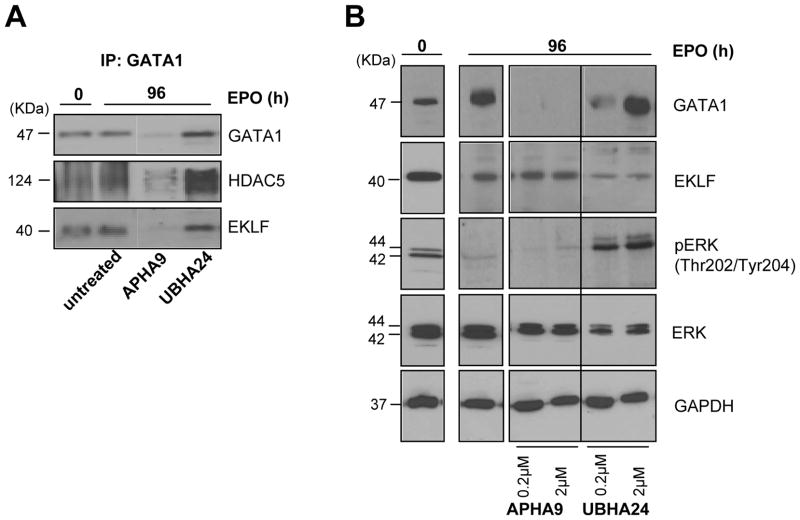
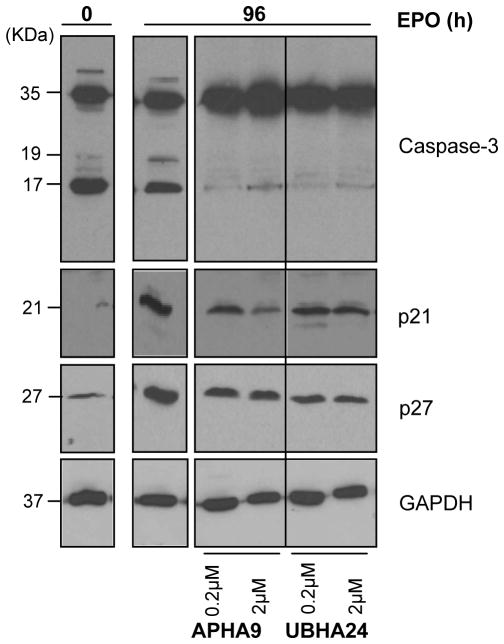
To clarify the role of HDACs in erythropoiesis, expression, activity and function of class I (HDAC1, HDAC2, HDAC3) and class IIa (HDAC4, HDAC5) HDACs during in vitro maturation of human erythroblasts were compared. During erythroid maturation, expression of HDAC1, HDAC2 and HDAC3 remained constant and activity and GATA1 association (its partner of the NuRD complex), of HDAC1 increased. By contrast, HDAC4 content drastically decreased and HDAC5 remained constant in content but decreased in activity. In erythroid cells, pull down experiments identified the presence of a novel complex formed by HDAC5, GATA1, EKLF and pERK which was instead undetectable in cells of the megakaryocytic lineage. With erythroid maturation, association among HDAC5, GATA1 and EKLF persisted but levels of pERK sharply decreased. Treatment of erythroleukemic cells with inhibitors of ERK phosphorylation reduced by >90% the total and nuclear content of HDAC5, GATA1 and EKLF, suggesting that ERK phosphorylation is required for the formation of this complex. Based on the function of class IIa HDACs as chaperones of other proteins to the nucleus and the erythroid-specificity of HDAC5 localization, this novel HDAC complex was named nuclear remodeling shuttle erythroid (NuRSERY). Exposure of erythroid cells to the class II-selective HDAC inhibitor (HDACi) APHA9 increased γ/(γ+β) globin expression ratios (Mai et al., 2007), suggesting that NuRSERY may regulate globin gene expression. In agreement with this hypothesis, exposure of erythroid cells to APHA9 greatly reduced the association among HDAC5, GATA1 and EKLF. Since exposure to APHA9 did not affect survival rates or p21 activation, NuRSERY may represent a novel, possibly less toxic, target for epigenetic therapies of hemoglobinopaties and other disorders.

Keywords: EKLF; Erythropoiesis; GATA1; Histone deacetylase inhibitors; Histone deacetylases.


Conflict of interest statement

Conflict of interest

The authors declared no competing financial or other interests.

Competing interests

The authors have declared that no competing interests exists

Figures

Figure 1
Figure 1. HDACs expression during ex-vivo maturation of human erythroblasts
A) Characterization of the maturation state of the erythroid cells used for the study. Flow cytometry profiling for CD36/CD235a expression (top panels) and morphology (by May-Grunwald/Giemsa staining, bottom panels) of human erythroblasts induced to mature with EPO for 0, 24 and 48 h, as indicated. Original magnifications 40X. The scale bar included in the micrograph corresponds to 35 μM. B) WB analyses of HDAC1, HDAC2, HDAC3, HDAC4 and HDAC5 contents of erythroblasts treated with EPO for 0, 24 and 48 h (the same cells presented in A). Both Tubulin and total ERK were analyzed as loading controls. Expected molecular weights are indicated on the left. Similar results were observed in three additional experiments. C) WB analyses of HDAC1, HDAC4 and HDAC5 content of megakaryocytes (MK) expanded ex-vivo from CD34pos cells purified from three separate AB donors. The biological features of the cells are described in Varricchio et al., 2012. GAPDH was analyzed as loading control. D) WB analyses with the specific antibodies indicated on the right of nuclear and cytoplasmic fractions purified from proerythroblasts expanded from CB (Ery) and from erythroid (K562 and HEL) and megakaryocytic (CMK) progenitor cell lines. In the case of the cell lines, total cell extracts (T) were also analyzed for comparison. The fact that HDAC1, HDAC2, HDAC3 and GATA1 were readily detectable in nuclear extracts but not in total cell extracts of the three cell lines likely reflects the low abundance of these proteins in these cells. Laminin B and HSP90 were analyzed as loading and contamination control. Expected molecular weights are indicated on the left.
Figure 2
Figure 2. In human erythroblasts, GATA1 is associated both with HDAC1 and EKLF
A) WB analyses with antibodies against GATA1, EKLF and HDAC1 of IP obtained with antibodies against GATA1 (top panels) and HDAC1 (bottom panels) of total cell lysates from erythroblasts from cord blood (CB) or adult blood (AB) induced to mature with EPO for 0 and 96 h, as indicated. The γ/(γ+β) expression ratios (in percent, mean±SD) expressed by the cells are indicated on the top. Similar results were obtained in six additional experiments, three with cells expanded from separate CB donors and three with cells expanded from separate AB donors. B) WB analyses of GATA1 (top panel) and HDAC1 (bottom panel) IPs of total cell lysates from eythroblasts expanded from CB and of HEL and K562 cell lines. IP with IgG were used as negative controls.
Figure 3
Figure 3. Identification of NuRSERY, a complex formed by HDAC5, EKLF, GATA1 and pERK present in erythroid cells
A) WB analysis with antibodies against HDAC5, GATA1, EKLF and pERK of IP obtained with antibodies for HDAC5, EKLF and GATA1 (indicated on the top) of total cell lysates from human erythroblasts. IP were also analyzed with antibodies for ERα (positive control for GATA1 IP) and GRα (negative control). Additional controls were represented by IP with IgG and WB of lysates from HeLa cells. The asterisks indicate WB with antibodies used for the IP. Expected molecular weights are indicated on the left. B) WB analysis for HDAC5, GATA1 and EKLF of IP with HDAC5 antibodies, and with IgG as negative control, of total cell lysates from human erythroblasts (1st IP) and of IP (2nd IP) with GATA1 antibodies, and with IgG as negative control, of supernatants from the 1st HDAC5 and IgG IPs, as indicated. The results presented in A and B are representative of those obtained in two separate experiments analyzed in duplicate. C) WB analyses for EKLF of IPs with HDAC5 and GATA1 antibodies of cord blood-derived proerythroblasts (CB, left panel) and HEL (right panel) cells. Total lysates (T) from HEL and K562 cells were analyzed on the same gel for comparison. EKLF IP from cord blood-derived erythroblasts migrate as a 40KD band, that IP from HEL cells migrate as two bands of 47 and 40 KD while that from total cell lysates migrate as a 47KD band. D) WB analysis with GATA1, EKLF, HDAC5 and ERK of GATA1 IPs obtained from human proerythroblasts expanded from CB and from HEL, K562 and CMK cells. IgGs were used as negative controls.
Figure 4
Figure 4. Exposure of erythroleukemic cell lines to inhibitors of ERK phosphorylation greatly reduces the content of components of NuRSERY
A) WB analyses with antibodies specified on the right of total cell extracts from HEL cells untreated or exposed for 24 h either to U0126 [100 μM] or PD98059 [100 μM], as indicated. GAPDH was used as loading control. Exposure to U0126, but not to PD98059 [100 μM], reduced the levels of ERK phosphorylation and the content of HDAC5 and GATA1 but did not affect the content of HDAC4 and HDAC1. B) WB analyses with antibodies specified on the right of total cell extracts from K562 cells untreated or exposed for 24 h to either U0126 [100 μM] or PD98059 [100 μM] (Exp I) and U0126 [100 μM] or Wortmannin [100 μM] (Exp II), as indicated. GAPDH was used as loading control. Exposure to U0126, but not to PD98059 or wortmannin, reduced the levels of ERK phosphorylation and HDAC5, GATA1 and EKLF content without affecting HDAC1 content. C) WB analyses with antibodies specified on the right of nuclear extracts from K562 cells untreated or exposed to U0126 [100 μM] for 1, 2, 4, 6 and 24 h, as indicated. Laminin B was used as loading control. Exposure to U0126 reduced the nuclear levels of ERK phosphorylation within 1 h and the nuclear content of HDAC5, GATA1 and EKLF by 6 h. HDAC5 was still detected but GATA1 and EKLF became barely detectable after 24 h of exposure to the inhibitor.
Figure 5
Figure 5. Pharmacological inhibition of class II and pan-HDACs does not affect erythroid maturation and HDAC1 mRNA expression
A) Molecular structure and in vitro ID50 on HDAC1, HDAC4 and HDAC5 purified from human erythroid cells of the class II-selective HDACi APHA9 and pan-HDACi UBHA24. The molecular structure and ID50 of SAHA are reported for comparison. These results are similar to those obtained with the equivalent HDACs purified from other human cell types (Duong et al., 2008; Mai et al., 2003; Mai et al., 2005; Ragno eta al., 2008). B) Morphology of human proerythroblasts exposed to EPO for 0 or 96 h (4 days) either alone or in the presence of APHA9 and UBHA24. The presence of the HDACi did not affect progression of human erythroblasts to the polychromatophilic state after 4 days of exposure to EPO. The scale bar included in the micrograph corresponds to 35 μM. C) Real-time RT-PCR determination of the levels of GATA1, GATA2 and HDAC1 mRNA in erythroblasts exposed for 96 h to EPO either alone or in the presence of APHA9 (2 μM), and UBHA24 (0.2 μM). Results are presented as relative units with respect to cells exposed to EPO alone and are presented as mean (±SD) of values observed in three separate experiments. Values statistically different (p<0.05) from controls are indicated by *.
Figure 6
Figure 6. Decreased content of partners of the NuRSERY complex in erythroblasts exposed for 4 days to EPO in combination with the class II-selective HDACi APHA9
A) IP with anti-GATA1 antibodies probed with antibodies against GATA1, HDAC5 and EKLF of whole cell extracts from human proerythroblasts (0 h) or from erythroblasts exposed for 96 h to EPO either alone or with APHA9 (2 μM), as indicated. Results obtained with cells exposed to UBHA24 (2 μM) are reported for comparison. The same cells as those analyzed in Figure 5. B) WB analysis with antibodies specific for GATA1, EKLF, pERK and ERK of whole cell extracts from human proerythroblasts (0 h) or from erythroblasts obtained after 96 h of exposure to EPO either alone or in combination with increasing concentration of APHA9 or UBHA24, as indicated. GAPDH was analyzed as loading control. The expected molecular weights are indicated on the left. The same cells as those analyzed in A.
Figure 7
Figure 7. Effect of APHA9 and UBHA24 on Caspase-3 activation and p21 and p27 content in erythroblasts exposed to EPO for 96 h
WB analysis with antibodies for Caspase-3, p21 and p27 of whole cell extracts from human proerythroblasts (0 h) and from erythroblasts obtained after 96 h of exposure to EPO either alone or in combination with increasing concentration of APHA9 or UBHA24, as indicated. GAPDH was analyzed as loading control. The same cells as those analyzed in Figure 5. Expected molecular weights are indicated on the left.

References

    1. Ahringer J. NuRD and SIN3 histone deacetylase complexes in development. Trends Genet. 2000;16:351–6. - PubMed
    1. Blobel GA, Sieff CA, Orkin SH. Ligand-dependent repression of the erythroid transcription factor GATA-1 by the estrogen receptor. Mol Cell Biol. 1995;15:3147–53. - PMC - PubMed
    1. Blobel GA, Orkin SH. Estrogen-induced apoptosis by inhibition of the erythroid transcription factor GATA-1. Mol Cell Biol. 1996;16:1687–94. - PMC - PubMed
    1. Bolden JE, Peart MJ, Johnstone RW. Anticancer activities of histone deacetylase inhibitors. Nat Rev Drug Discov. 2006;5:769–84. - PubMed
    1. Bottardi S, Ross J, Bourgoin V, Fotouhi-Ardakani N, Affar el B, et al. Ikaros and GATA-1 combinatorial effect is required for silencing of human gamma-globin genes. Mol Cell Biol. 2009;29:1526–37. - PMC - PubMed

Publication types

MeSH terms

LinkOut - more resources