. 2014 Mar 4;9(3):e88788.
doi: 10.1371/journal.pone.0088788. eCollection 2014.

Th1 response and systemic treg deficiency in inclusion body myositis

Affiliations

Th1 response and systemic treg deficiency in inclusion body myositis

Yves Allenbach et al. PLoS One. .

Abstract

Objective: Sporadic inclusion body myositis (sIBM), the most frequent myositis in elderly patients, is characterized by the presence muscle inflammation and degeneration. We aimed at characterizing immune responses and regulatory T cells, considered key players in the maintenance of peripheral immune tolerance, in sIBM.

Methods: Serum and muscle tissue levels of 25 cytokines and phenotype of circulating immune cells were measured in 22 sIBM patients and compared with 22 healthy subjects. Cytokine data were analysed by unsupervised hierarchical clustering and principal components analysis.

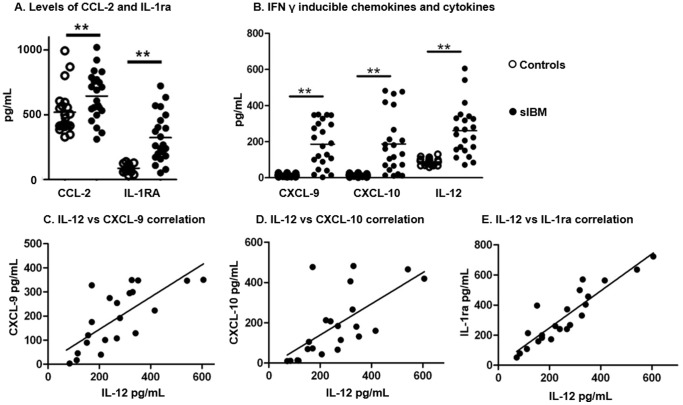
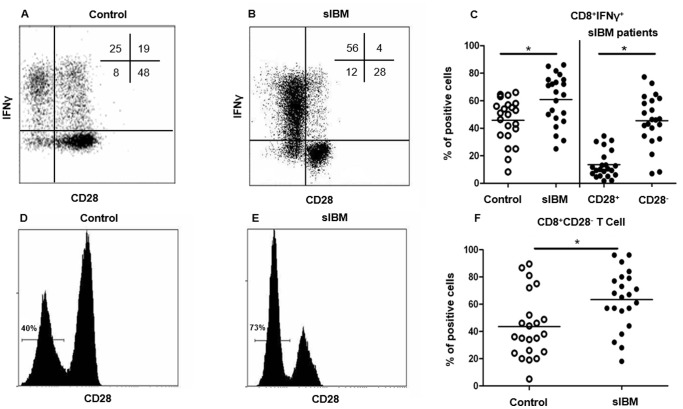
Results: Compared to healthy controls, sIBM patients had increased levels of Th-1 cytokines and chemokines such as IL-12 (261±138 pg/mL vs. 88±19 pg/mL; p<0.0001), CXCL-9 (186±12 pg/mL vs. 13±7 pg/mL; p<0.0001), and CXCL-10 (187±62 pg/mL vs. 13±6 pg/mL; p<0.0001). This was associated with an increased frequency of CD8+CD28- T cells (45.6±18.5% vs. 13.5±9.9%; p<0.0001), which were more prone to produce IFN-γ (45.6±18.5% vs. 13.5±9.9%; p<0.0001). sIBM patients also had a decreased frequency of circulating regulatory T cells (CD4+CD25+CD127lowFOXP3+, 6.9±1.7%; vs. 5.2±1.1%, p = 0.01), which displayed normal suppressor function and were also present in affected muscle.

Conclusion: sIBM patients present systemic immune activation with Th1 polarization involving the IFN-γ pathway and CD8+CD28- T cells associated with peripheral regulatory T cell deficiency.


Conflict of interest statement

Competing Interests: The authors have declared that no competing interests exist.

Figures

Figure 1
Figure 1. Cytokine and chemokine levels in sIBM patients compare to healthy controls.
A. Pooled data showing serum levels (pg/mL) of CCL-2 and IL-1ra in sIBM patients and controls; p<0.0001 and p = 0.025 respectively. B. Pooled data showing serum levels (pg/mL) of CXCL-9, CXCL-10 and IL-12 in sIBM patients (open circles) and controls (full circles); p<0.0001 for all. C. Correlation (linear regression) between serum level of IL-12 and serum levels of CXCL-9 (C), CXCL-10 (D) and IL-1ra (E). Horizontal lines indicate means; *p<0.05; **p<0.001.
Figure 2
Figure 2. Unsupervised analyses using the Th1 signature.
A. Principal Components Analysis (PCA) based on the selected Th1 signature. The projection of each individual on the first two PCA components using the five cytokine expression levels identified as significantly increased in sIBM patients (p<0.05) revealed that sIBM patients (magenta) are distant from controls (cyan). B. Hierarchical clustering (Euclidean distance; complete linkage method) based on the expression pattern of the five cytokines across the sIBM patients (magenta) and controls.
Figure 3
Figure 3. Interferon γ production by T cells in sIBM patients depending on CD28 and naive/memory phenotype.
Representative flow cytometry analysis showing IFN-γ production in CD28 and CD28+CD8+ T cells in one control (A) and one sIBM patient (B). The percentage of each subpopulation is shown in the upper right corner. Pooled data showing IFN-γ+CD8+ T cells from sIBM patients and controls (p = 0.01) (left side). Pooled data showing IFN-γ+ cells among CD28+ and CD28-CD8+ T cells, represented as percentage (p<0.0001) (right side) (C). Representative flow cytometry analysis showing CD28 and CD28+CD8+ T cell subpopulations in one representative control (D) and sIBM patient (E). Pooled data showing CD28 CD8+ T cells from IBM patients and controls (p = 0.001) (F). Horizontal lines indicate means. *p<0.05.
Figure 4
Figure 4. Naive/memory phenotype T cell repartition in sIBM patients.
Representative flow cytometry analysis showing the gating strategy used to define naive T cells (Naïve: CD45RA+CD62L+), central memory T cells (CM: CD45RACD62L+), early activated memory T cells (EM: CD45RACD62L) and late effector memory T cells (LM: CD45RA+CD62L) subsets of CD8+ T cells, in one representative healthy control (A) and sIBM patient (B). The percentage of each subpopulation among CD8+ T cells is represented in the upper right quadrant. Pooled data showing naive and memory CD8+ T cell subpopulations from sIBM patients and controls (p = 0.004 and p = 0.003 for LM and EM respectively) (C). The same strategy was used for the CD4+ T cell compartment. Representative flow cytometry analysis of CD4+ T cells showing the gating strategy in one representative healthy control (D) and one representative sIBM patient (E). Pooled data showing naive and memory subpopulations of CD4+ T cells from IBM patients and controls (p = 0.003 for LM) (F). Horizontal lines indicate means. *p<0.05.
Figure 5
Figure 5. Analysis of Tregs in sIBM patients.
Representative flow cytometry analysis of CD25+CD127low subpopulations among CD3+CD4+ T lymphocytes in a control subject (A). Tregs were defined as Foxp3+ cells among the previously gated CD3+CD4+CD25+CD127low subpopulation (B). Non-specific staining (isotype control) was used to define FoxP3+ cells (C). Pooled data showing the percentage of Tregs among CD4+ T cells from sIBM patients and controls in the systemic compartment (p = 0.01). Horizontal lines indicate means (D). Percentage of inhibition (±SD; n = 4) of Tregs on the proliferation of autologous CD4+CD25 T cells (responders). Responder+allogeneic MNCs were used as positive control. Proliferation of responder cells was measured by 3H-Tdr incorporation (counts per minute, cpm) (E). Representative flow cytometry analysis showing resting Tregs (rTregs: CD45RA+CD25+) and activated Tregs (aTregs: CD45RACD25high) among CD4+ T lymphocytes in a control subject (F). Pooled data showing rTregs and aTregs from sIBM patients and controls (p = 0.0003) (G). Immunostaining of a muscle section from a sIBM patient, showing Foxp3+ cells (H) in the muscle infiltrate. Immunofluorescence staining showing Foxp3+ cells (red) within the muscle infiltrate in a sIBM patients (I). The upper left corner shows a FoxP3+ cell (red), the upper right corner shows CD4+ cells (green), the lower left corner shows nuclear staining (dapi); coexpression of CD4 and FoxP3 is shown by merged fluorescence images in the lower right corner. Horizontal lines indicate means; *p<0.05.

References

    1. Benveniste O, Guiguet M, Freebody J, Dubourg O, Squier W, et al. (2011) Long-term observational study of sporadic body inclusion body myositis. Brain 134(Pt11): 3176–84. - PubMed
    1. Dimitri D, Benveniste O, Dubourg O, Maisonobe T, Eymard B, et al. (2006) Shared blood and muscle CD8+ T-cell expansions in inclusion body myositis. Brain, 129(Pt 4): 986–995. - PubMed
    1. Askanas V, Engel WK (2008) Inclusion-body myositis: muscle-fiber molecular pathology and possible pathogenic significance of its similarity to Alzheimer’s and Parkinson’s disease brains. Acta Neuropathol 116(6): 583–595. - PMC - PubMed
    1. Greenberg SA (2010) Comment on alemtuzumab and inclusion body myositis. Brain, 133(Pt 5): e135; author reply e136. - PMC - PubMed
    1. Griggs RC, Askanas V, DiMauro S, Engel A, Karpati G, et al. (1995) Inclusion body myositis and myopathies. Ann Neurol 38(5): 705–713. - PubMed

Publication types

MeSH terms