. 2014 Mar 4:5:3345.
doi: 10.1038/ncomms4345.

Energy losses of nanomechanical resonators induced by atomic force microscopy-controlled mechanical impedance mismatching

Affiliations
Free PMC article

Energy losses of nanomechanical resonators induced by atomic force microscopy-controlled mechanical impedance mismatching

Johannes Rieger et al. Nat Commun. .
Free PMC article

Abstract

Clamping losses are a widely discussed damping mechanism in nanoelectromechanical systems, limiting the performance of these devices. Here we present a method to investigate this dissipation channel. Using an atomic force microscope tip as a local perturbation in the clamping region of a nanoelectromechanical resonator, we increase the energy loss of its flexural modes by at least one order of magnitude. We explain this by a transfer of vibrational energy into the cantilever, which is theoretically described by a reduced mechanical impedance mismatch between the resonator and its environment. A theoretical model for this mismatch, in conjunction with finite element simulations of the evanescent strain field of the mechanical modes in the clamping region, allows us to quantitatively analyse data on position and force dependence of the tip-induced damping. Our experiments yield insights into the damping of nanoelectromechanical systems with the prospect of engineering the energy exchange in resonator networks.


Figures

Figure 1
Figure 1. Measurement set-up.
(a) Illustration of the nanomechanical system with the AFM tip as a controlled local perturbation of the resonator’s acoustic environment. This leads to a flow of energy from the nanomechanical system into the cantilever (grey), as symbolized by the corrugated red arrows. The resonator (blue) is 55 μm long, 250 nm wide and 100 nm thick. It is bordered by two 1 μm wide gold electrodes (yellow) for actuation and detection. The illustration is not to scale to provide better visibility of the individual components. (b) AFM image of a resonator clamp as marked by the light grey frame in a (rotated by 180°). The scale bar corresponds to 2 μm. (c) Electrical set-up. One of the electrodes is connected to a microstrip cavity for detection, whereas the other electrode is used for the application of an rf voltage and a dc bias for actuation. The bypass capacitor provides a ground path for the microwave detection.
Figure 2
Figure 2. Tip-induced frequency shift and damping.
(a) Lorentzian amplitude spectra and fits for two spatially well separated tip positions. The inset shows the outlines of the clamping region with the resonator protruding at the bottom (orange, c.f. red rectangle in Fig. 1b). The tip positions for the two spectra shown in a are marked with the respective plot marker symbol in the inset. (b) Shift of the resonance frequency with tip position along three lines specified in the inset of a. The data and the respective tip positions are colour coded. (c) Damping rate versus tip position for the same line cuts. (d) The theoretical model predicts the ratio of real and imaginary parts of the contact impedance to be invariant. This ratio has been computed from the measured frequency shift and damping curves in b and c. As it is only well defined for non-zero frequency shifts and diverges far from the resonator, the dashed sections lie beyond the validity of our model.
Figure 3
Figure 3. Force dependence of frequency shift and damping.
Force–distance curves are measured at three points in the clamping region (red squares, green dots, blue triangles) with increasing distance to the resonator. Since a linear response theory is valid, all curves can be scaled to coincide with each other. Thus, our model can be fitted to the whole data set, that is, all frequency shift and damping curves, with one single set of parameters. For clarity, we only show the retraction curves. In all panels red squares represent the data for the point of highest interaction (closest to the clamp), green dots for an intermediate and blue triangles for the point of lowest interaction. (a) Force dependence of the frequency shift of the fundamental out-of-plane mode with a free resonance frequency of 6.65 MHz. The solid black line is a fit of the model. The inset shows the data and fitted model of the third harmonic mode with a free resonance frequency of 20.0 MHz, which was measured simultaneously. (b) Force dependence of the tip-induced damping for the same modes.
Figure 4
Figure 4. Impedance maps.
Experimentally determined contact impedance maps (ac) and simulated local amplitudes of the clamping region (df) for the fundamental out-of-plane and in-plane mode. (a) Imaginary part of the contact impedance Ztip for the out-of-plane mode. (b) Real part of the contact impedance for the out-of-plane mode. (c) Real part of the contact impedance for the in-plane mode. (d) Simulated normalized squared amplitude formula image 
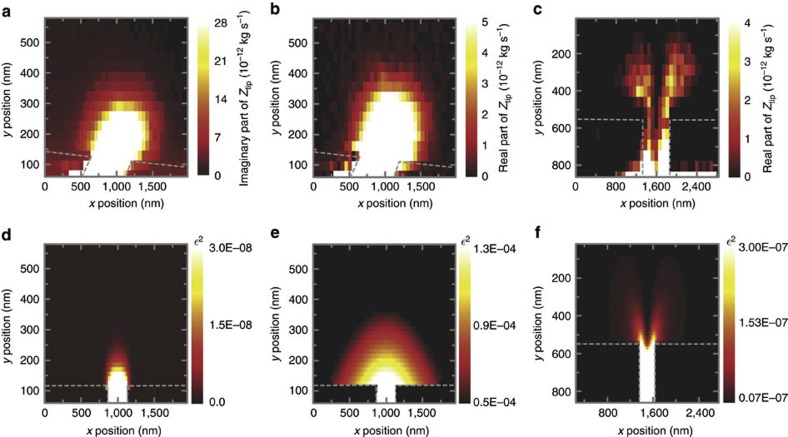
for the out-of-plane mode for a clamp with no undercut. (e) The same with a realistic undercut of the silicon nitride pedestal of 500 nm. (f) Simulated formula image for the fundamental in-plane mode with 500 nm undercut.

References

    1. Ekinci K. L. & Roukes M. L. Nanoelectromechanical systems. Rev. Sci. Instrum. 76, 061101 (2005).
    1. Chan J., Safavi-Naeini A. H., Hill J. T., Meenehan S. & Painter O. Optimized optomechanical crystal cavity with acoustic radiation shield. Appl. Phys. Lett. 101, 081115 (2012).
    1. Mamin H. J. & Rugar D. Sub-attonewton force detection at millikelvin temperatures. Appl. Phys. Lett. 79, 3358 (2001).
    1. Knobel R. G. & Cleland A. N. Nanometre-scale displacement sensing using a single electron transistor. Nature 424, 291–293 (2003). - PubMed
    1. Rugar D., Budakian R., Mamin H. J. & Chui B. W. Single spin detection by magnetic resonance force microscopy. Nature 430, 329–332 (2004). - PubMed

Publication types

LinkOut - more resources