. 2014 Mar 4:5:3384.
doi: 10.1038/ncomms4384.

Environment-responsive nanophores for therapy and treatment monitoring via molecular MRI quenching

Affiliations

Environment-responsive nanophores for therapy and treatment monitoring via molecular MRI quenching

Charalambos Kaittanis et al. Nat Commun. .

Erratum in

Abstract

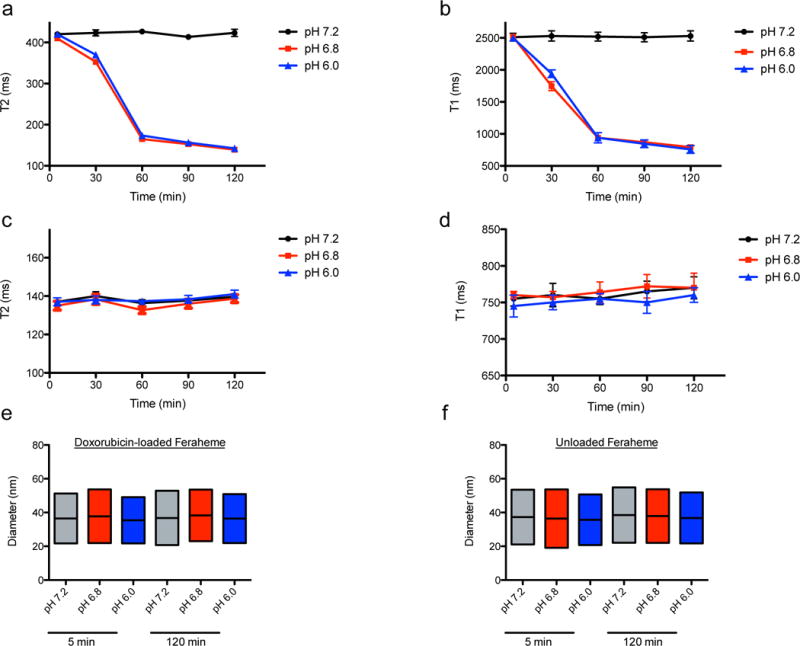
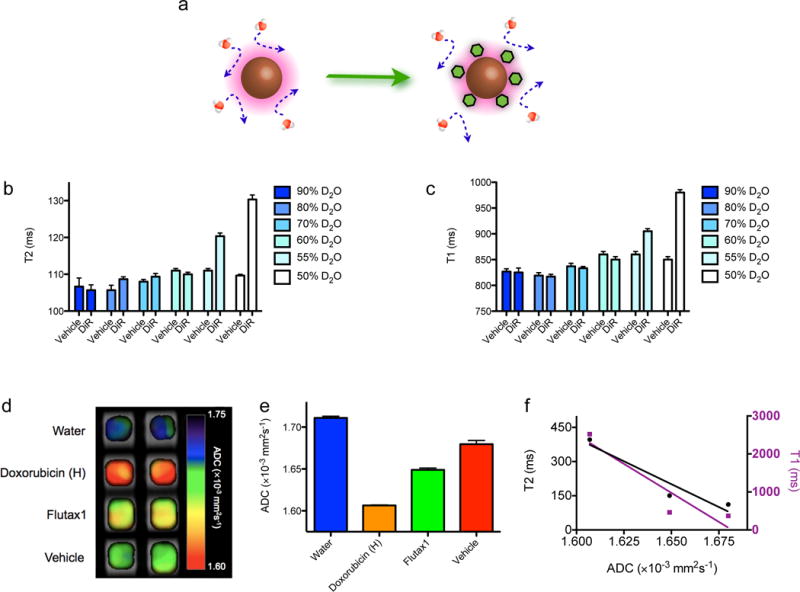
The effective delivery of therapeutics to disease sites significantly contributes to drug efficacy, toxicity and clearance. Here we demonstrate that clinically approved iron oxide nanoparticles (Ferumoxytol) can be utilized to carry one or multiple drugs. These so called 'nanophores' retain their cargo within their polymeric coating through weak electrostatic interactions and release it in slightly acidic conditions (pH 6.8 and below). The loading of drugs increases the nanophores' transverse T2 and longitudinal T1 nuclear magnetic resonance (NMR) proton relaxation times, which is proportional to amount of carried cargo. Chemotherapy with translational nanophores is more effective than the free drug in vitro and in vivo, without subjecting the drugs or the carrier nanoparticle to any chemical modification. Evaluation of cargo incorporation and payload levels in vitro and in vivo can be assessed via benchtop magnetic relaxometers, common NMR instruments or magnetic resonance imaging scanners.


Figures

Figure 1
Figure 1. Ferumoxytol as nanophores for drug delivery
(a) The gradual incorporation of Flutax1 within Ferumoxytol’s coating increased the nanoparticles’ Flutax1-derived fluorescence emission (mean±s.e.m, n=3), (b) with the nanoparticle coating capable of accommodating many cargo molecules within it (mean±s.e.m, n=3). The nanoparticles were first dialyzed to remove any unloaded compound, followed by fluorescence and DLS measurements. (c) Size distribution of cargo-loaded Ferumoxytol (vehicle = unloaded Ferumoxytol; means and distributions of three independent experiments). (d) DiR-loaded Ferumoxytol was stable in sterile fetal bovine serum, with its fluorescence remaining unaltered (mean±s.e.m, n=3). (e) Ferumoxytol released Doxorubicin at slightly acidic conditions. The fluorescence emission of the nanoparticles (λex=485 nm, λem=590 nm, mean±s.e.m, n=3)) that were retained within the dialysis chamber decreased, due to Doxorubicin’s release to the free fraction found in the chambers’ exterior. (f) The release of Doxorubicin from Ferumoxytol to the exterior of the dialysis chamber was confirmed by recording the drug’s absorbance in the free fraction at 480 nm (mean±s.e.m, n=3).
Figure 2
Figure 2. The cargo quenches the nanophores’ magnetic properties
Loading nanophores with cargo increased the T2 (a) and T1 (b)([Fe]=10 μg mL−1; mean±s.e.m, n=3). The nanoparticles were first dialyzed to remove any unloaded compound, followed by relaxation measurements. c, The gradual addition of Flutax1within Ferumoxytol’s coating increased the nanoparticle formulation’s T2 and T1 signal (linear regression correlation coefficients rT2=0.98 and rT1=0.94; [Fe]=10 μg mL−1;mean±s.e.m, n=3).de, The incorporation of cargo within the nanophores’ coating resulted in changes on the nanoparticles’ relaxivities (mean±s.e.m, n=3).f, The change in relaxivity (Δr2) was associated with the drug’s solubility in DMSO (linear regression correlation coefficient r=0.90; mean±s.e.m, n=3; solubility information was obtained from Selleck Chemicals) g, MRI phantom images of unloaded and loaded Ferumoxytol, demonstrating that the cargo does not affect the nanoparticles’ T2* signal, as opposed to its effect on T2 (iron concentrations: high=10 μg mL−1, medium=6 μg mL−1 and low=4 μg mL−1).
Figure 3
Figure 3. The nanophores release their cargo at mildly acidic conditions
As Ferumoxytol released Doxorubicin in acidified buffers, the T2 (a) and T1 decreased (b) ([Fe]=10 μg mL−1; mean±s.e.m, n=3). The T2 (c) and T1 (d) of Ferumoxytol (unloaded nanoparticles) were not affected by the slightly acidic pH ([Fe]=10 μg mL−1; mean±s.e.m, n=3). e, No changes in the nanoparticle size were observed via DLS during cargo release, suggesting structural integrity of Ferumoxytol in these conditions (means and distributions of three independent experiments). f, Stability of unloaded Ferumoxytol at different pH (means and distributions of three independent experiments). (Middle horizontal line of a rectangle = the sample’s mean diameter; Upper and lower horizontal lines are the boundaries of the nanoparticles’ Gaussian distribution.)
Figure 4
Figure 4. Intracellular cargo delivery with nanophores
a, Composite image of bright field and fluorescence images of LNCaP cells treated for 48 h with Doxorubicin-loaded Ferumoxytol. Doxorubicin fluorescence is shown in red (Scale bar = 50 μm). b, Cells were treated with DiR-loaded Ferumoxytol, and after washing and trypsinization, the harvested cell pellets were imaged with an Odyssey reader at 800 nm to quantify the uptake of the nanophores. Control cells were treated with unloaded nanoparticles. Inhibition of endocytosis was performed at 4 °C and with the inhibitors sodium azide and 2-deoxyglucose (mean±s.e.m, n=3). The cell pellets were subjected to iron digestion, and revealed that upon release of the cargo the r2 (c) and r1 (d) relaxivities of DiR-carrying Ferumoxytol were higher than those of the corresponding fully loaded formulation (mean±s.e.m, n=3).
Figure 5
Figure 5. The cargo obstructs the access of water in the nanophores’ proximity
a, Schematic representation of the proposed model that suggests that the presence of cargo within the coating of IONP hinders the diffusion of water molecules, concomitantly affecting the ability of nanoparticles to efficiently dephase water’s protons. At high D2O concentrations, the changes on (b) T2 and (c) T1 were abrogated (mean±s.e.m, n=3), suggesting that the observed increases in T2 and T1 during cargo loading occurred upon blockage of water molecules by the entrapped cargo ([Fe]PAA IONP=2.5 μg mL−1) rather than an effect exerted by the payload. d–f, Diffusion-weighted MRI revealed that the presence of molecular payload within Ferumoxytol’s coating affected the diffusion of water molecules ([Fe]Ferumoxytol=5 μg mL−1 for all wells; mean±s.e.m, n=6). The cargo’s effect on ADC correlated with the observed changes in T2 and T1 signal (mean±s.e.m, n=6). (ADC: apparent diffusion coefficient; linear regression correlation coefficients rT2=0.95 and rT1=0.92; vehicle: unloaded nanoparticles) (Mean ± SE).
Figure 6
Figure 6. Nanophores as in vitro and in vivo chemotherapeutic vehicles
a, Cytotoxicity profile of the human prostate cancer cells LNCaP treated with co-administered free drugs or Ferumoxytol that was loaded with both the PI3 kinase inhibitor BEZ235 and the anti-androgen MDV3100 (mean±s.e.m, n=3). b, Representative IVIS images of DiR-loaded nanophores demonstrating the fluorophore’s localization in the tumors. c–e, Drug-loaded nanophores (FH-Bortezomib or FH-Doxo) efficiently reduced tumor volume in mice bearing (cd) human prostate and (e) human breast xenografts (mean±s.e.m; n=3 per treatment group for the Bortezomib study; for prostate cancer chemotherapy with Doxorubicin: nDMSO=3, nDoxo=3, nFH-Doxo=4; for breast cancer chemotherapy with Doxorubicin: nDMSO=3, nDoxo=3, nFH-Doxo=4;). f–h, The bar graphs depict the change in tumor volume between day 10 and 0 of the (c–d) treatment regimes. (i) Biodistribution profiles of the free and nanophore-encapsulated 131I-PU-H71 24 h after administration (n=4 per treatment group). (j) Tumor retention profiles of free and nanophore-encapsulated 131I-PU-H71 (%Id/g: % injected dose/tissue mass, n2h=3 per treatment group, n8h=3 per treatment group, n24h=4 per treatment group), with the corresponding net change in drug delivery and retention achieved with the nanophores (Δ[PU-H71]NP).
Figure 7
Figure 7. Noninvasive monitoring of nanophore drug release in vivo with MRI
Mice were injected with unloaded (FH) or Doxorubicin-loaded Ferumoxytol (Doxo-FH), and the tumors (a) T2 and (b) T2* signals were monitored across time (Scale bars = 25 mm). (c) As Ferumoxytol released doxorubicin in vivo, the nanoparticles’ T2 signal gradually decreased and eventually reached that of the unloaded nanoparticles (mean±s.e.m; n=3 per treatment group per time-point). (d) The T2* indicated that the unloaded and loaded nanoparticles were equally retained at the tumors, as there were no differences in the T2* signal (mean±s.e.m; n=3 per treatment group per time-point).

References

    1. Duncan R. The dawning era of polymer therapeutics. Nat Rev Drug Discov. 2003;2:347–360. - PubMed
    1. Duncan R. Polymer conjugates as anticancer nanomedicines. Nat Rev Cancer. 2006;6:688–701. - PubMed
    1. Huang PS, Oliff A. Drug-targeting strategies in cancer therapy. Curr Opin Genet Dev. 2001;11:104–110. - PubMed
    1. Moses MA, Brem H, Langer R. Advancing the field of drug delivery: taking aim at cancer. Cancer Cell. 2003;4:337–341. - PubMed
    1. Qian ZM, Li H, Sun H, Ho K. Targeted drug delivery via the transferrin receptor-mediated endocytosis pathway. Pharmacol Rev. 2002;54:561–587. - PubMed

Publication types

MeSH terms

Substances