. 2014 Apr 15;110(8):2099-108.
doi: 10.1038/bjc.2014.99. Epub 2014 Mar 4.

Arachidonic acid induction of Rho-mediated transendothelial migration in prostate cancer

Affiliations

Arachidonic acid induction of Rho-mediated transendothelial migration in prostate cancer

M Brown et al. Br J Cancer. .

Abstract

Background: Bone metastases in prostate cancer (CaP) result in CaP-related morbidity/mortality. The omega-6 polyunsaturated fatty acid (PUFA) arachidonic acid (AA) and lipophilic statins affect metastasis-like behaviour in CaP cells, regulating the critical metastatic step of CaP migration to the bone marrow stroma.

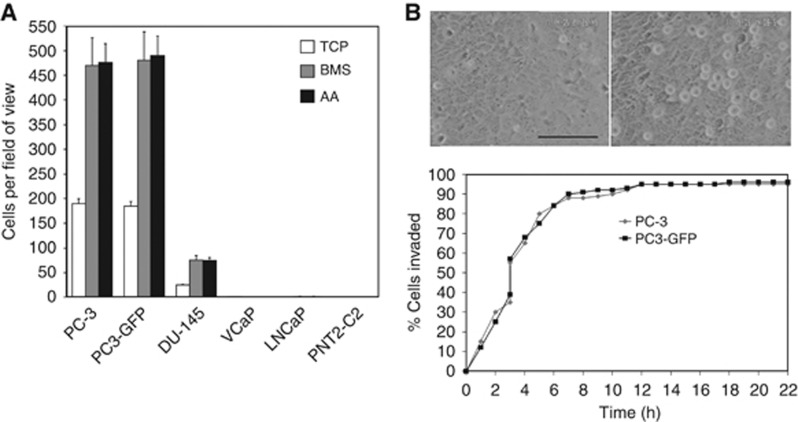
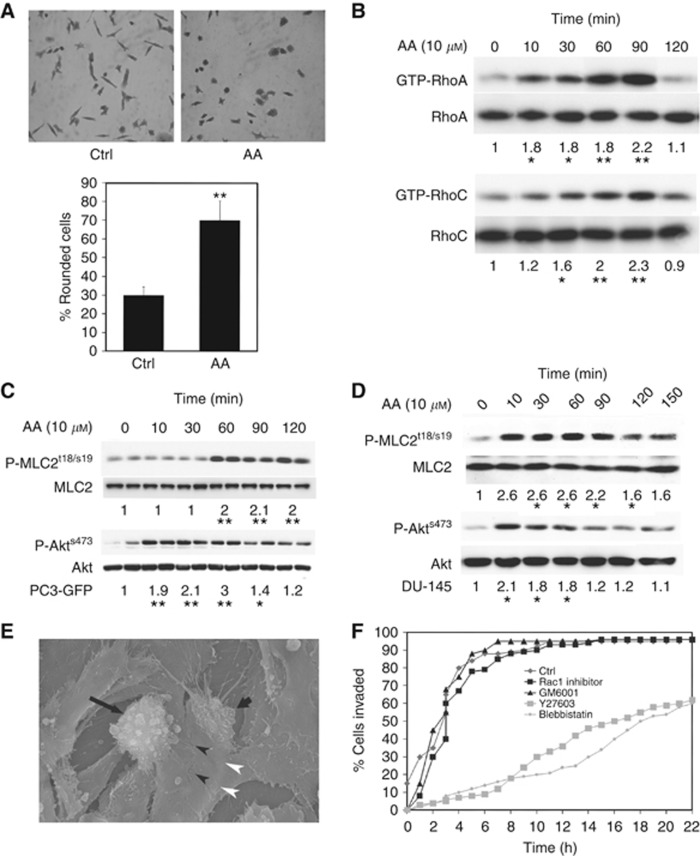
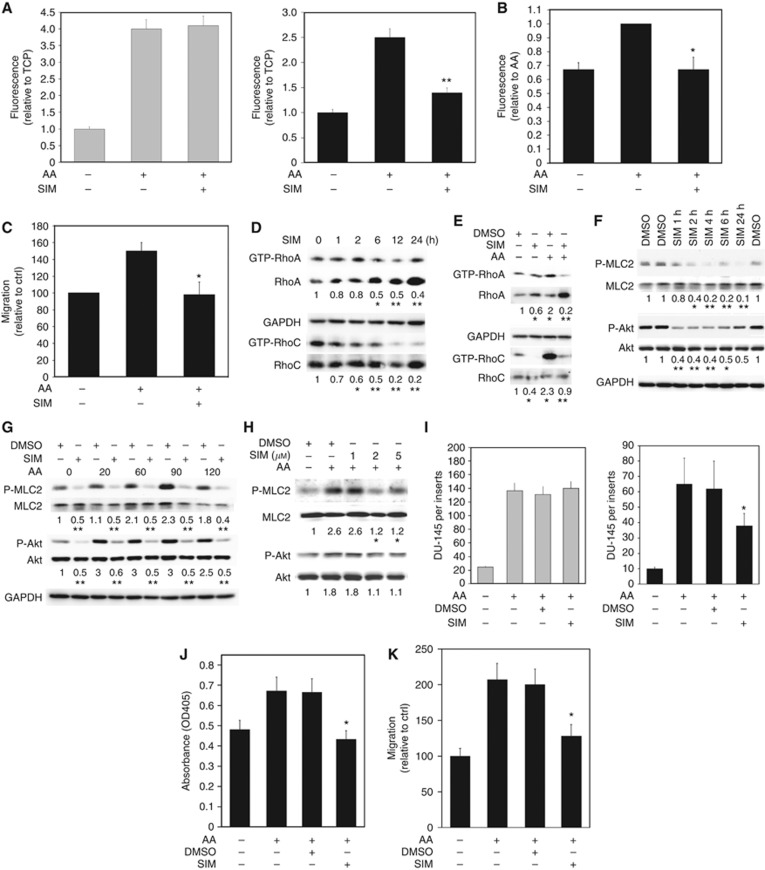
Methods: Microscopic analysis and measurement of adhesion and invasion of CaP cells through bone marrow endothelial cells (BMEC) was undertaken with AA stimulation and/or simvastatin (SIM) treatment. Amoeboid characteristics of PC-3, PC3-GFP and DU-145 were analysed by western blotting and Rho assays.

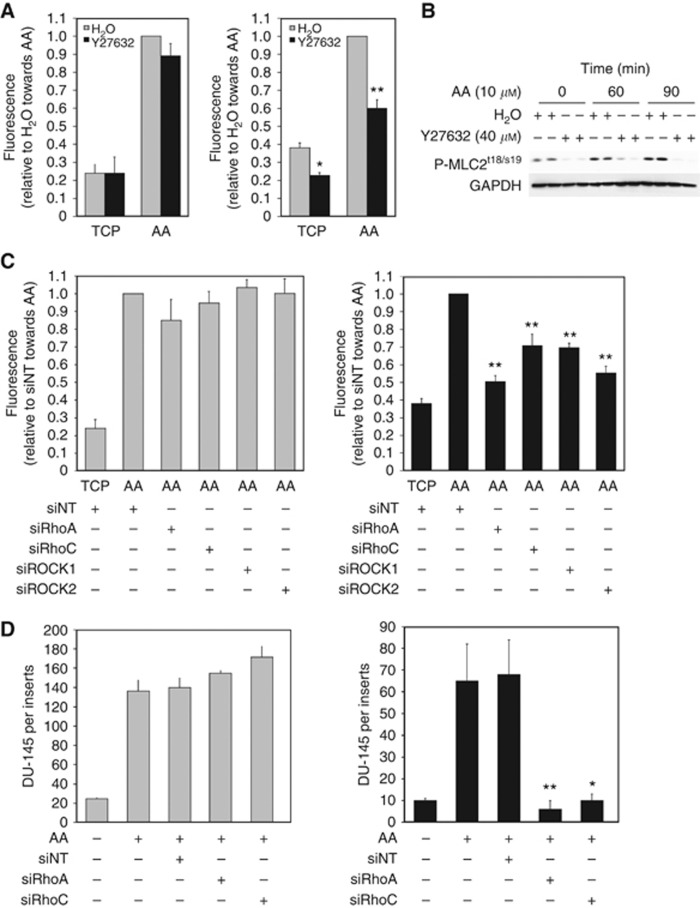
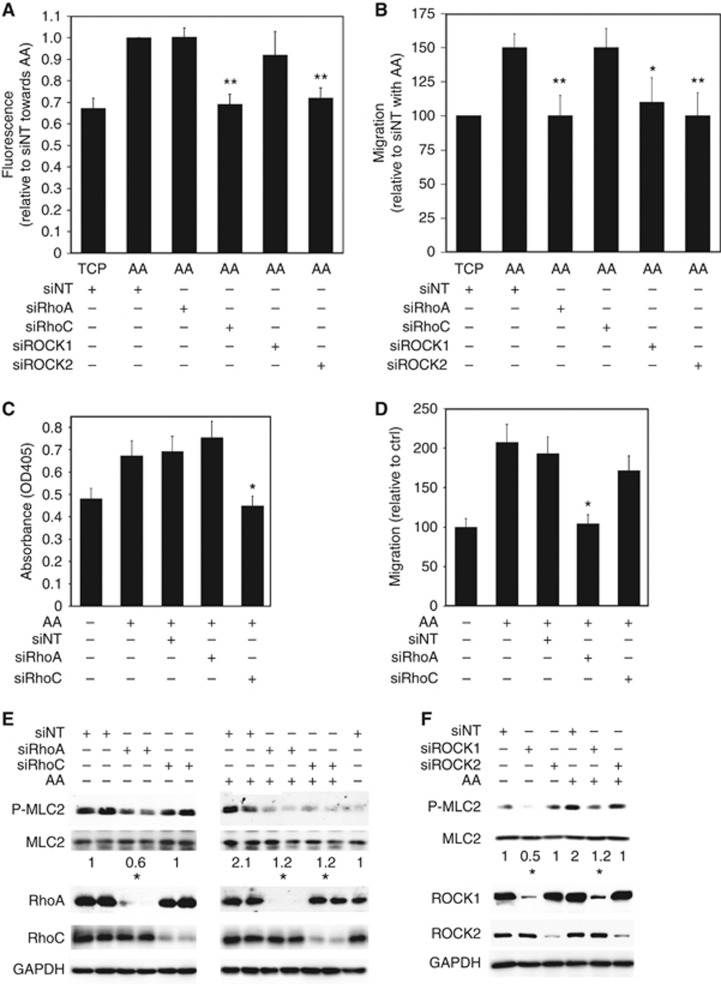
Results: The CaP cell lines PC-3, PC3-GFP and DU-145 share the ability to migrate across a BMEC layer. Specific amoeboid inhibition decreased transendothelial migration (TEM). AA stimulates amoeboid characteristics, driven by Rho signalling. Selective knock-down of components of the Rho pathway (RhoA, RhoC, Rho-associated protein kinase 1 (ROCK1) and ROCK2) showed that Rho signalling is crucial to TEM. Functions of these components were analysed, regarding adhesion to BMEC, migration in 2D and the induction of the amoeboid phenotype by AA. TEM was reduced by SIM treatment of PC3-GFP and DU-145, which inhibited Rho pathway signalling.

Conclusions: AA-induced TEM is mediated by the induction of a Rho-driven amoeboid phenotype. Inhibition of this cell migratory process may be an important therapeutic target in high-risk CaP.


Figures

Figure 1
Figure 1
Ability of PC-3 cells to invade a BMEC layer. (A) Invasion assays were performed using cell-culture inserts (8 μm pore size) with a barrier of a confluent layer of BMEC above a synthetic basement membrane (Matrigel). 1 × 10⁵ PC-3, PC3-GFP, DU-145, LNCaP, VCaP and PNT2-C2 cells were added to the top of the inserts and allowed to invade for 18 h towards tissue culture plastic (TCP), bone marrow stroma (BMS) or AA (10 μM). Data are means±s.e.m. of triplicate samples from two independent experiments. (B) Live-cell invasion studies using time lapse video microscopy. BMEC monolayer before addition of PC-3 cells (left). BMEC monolayer with PC-3 cells present as rounded cells on top of BMEC 20 min after addition of PC-3 cells (right). Scale bar represents 100 μm. PC-3 or PC3-GFP cells were seeded onto a confluent BMEC monolayer, in the presence of AA (10 μM), and observed using time lapse video microscopy. The cumulative percentage of cells completing invasion plotted against time is shown. Diamond: PC-3 cells. Square: PC3-GFP cells.
Figure 2
Figure 2
Arachidonic acid induces RhoA and C activities in PC3-GFP. (A) Microscopic analysis of PC3-GFP cells incubated with AA (10 μM). Serum-starved PC3-GFP cells were incubated with AA (10 μM) or the vehicle only during 3 h. Cells were then fixed, stained with crystal violet and photographed. Lower panel: 150 cells were counted per condition and the percentage of rounded cells counted. Data are means±s.e.m. of duplicate samples from two independent experiments. **P<0.01 vs no AA. (B) Lysates of PC3-GFP cells incubated with AA (10 μM) at different times were subjected to Rho assays. Levels of GTP-RhoA and GTP-RhoC were compared with total levels of RhoA and RhoC, respectively. Figure is representative of at least three individual experiments done in duplicate. Quantification of densitometric values of GTP-RhoA and GTP-RhoC in AA-stimulated PC3-GFP samples compared with total levels of RhoA and RhoC, respectively. *P<0.05, **P<0.01 vs no AA. Densitometric values of controls without incubation with AA were set at one. (C) Lysates of PC3-GFP cells incubated with AA (10 μM) at different times were subjected to western blotting. Phosphorylation levels of Akts473 and MLCt18/s19 were compared with total levels of Akt and MLC2, respectively. Figure is representative of three separate experiments done in duplicate. Quantification of densitometric values of phosphorylated Akts473 and MLCt18/s19 in AA-stimulated PC3-GFP samples was compared with the total levels of Akt and MLC, respectively. *P<0.05, **P<0.01 vs no AA. Densitometric values of controls without incubation with AA were set at one. (D) P-MLC2t18/s19, MLC2, P-Akt and Akt content was analysed by western blotting in lysates of DU-145 cells incubated with AA at different times. Levels of P-Akt and P-MLC2 were compared with total levels of Akt and MLC2, respectively. Figure is representative of two separate experiments done in duplicate. *P⩽0.05 vs Ctrl (without AA). Densitometric values of controls were set at one. (E) SEM imaging of PC-3 transendothelial migration. SEM images of a BMEC monolayer 5 h after addition of PC-3 cells. A rounded and blebbing cell (long arrow), and part of a pseudopodium (short arrow) appears to be extending from underneath flattened BMEC in the area of a BMEC cell–cell junction (arrowheads). The edges of the under lapping cell can be seen as an area where BMEC appear to be lifted (white arrowheads). Magnification: × 1500. (F) Migration of PC3-GFP cells through a BMEC monolayer in the presence of motility inhibitors. PC3-GFP cells were seeded onto a confluent monolayer of BMEC and observed for 24 h in the time lapse video microscopy unit. In the control experiment, 25 cells were followed, 37 in the Y27632 experiment, 28 for blebbistatin, 29 for Rac1 inhibitor and 22 for GM6001.
Figure 3
Figure 3
Rho signalling controls transendothelial migration towards AA. (A) Invasion assays with PC3-GFP cells were performed using cell-culture inserts (8 μm pore size) coated by a synthetic basement membrane (Matrigel) (left panel) or culture inserts (8 μm pores) coated by a layer of BMEC above a synthetic basement membrane (Matrigel) (right panel). 2 × 10⁵ PC3-GFP cells pre-incubated with Y27632 (40 μM) or the vehicle (H2O) for 30 min were added to the top of the inserts and allowed to invade towards AA (10 μM) for 18 h. Levels of invasion are proportional to fluorescence detected by a bottom reading BMG FLUOstar OPTIMA plate reader at 488/520 nm (excitation/emission filter). Data represent means±s.e.m. of three separate experiments (in triplicate). *P<0.05, **P⩽0.01 vs no Y27632 towards TCP or AA, respectively. (B) P-MLC2 levels in PC3-GFP cells incubated with AA and/or the ROCK inhibitor Y27632. Lysates of serum-starved PC3-GFP cells incubated with AA (10 μM)±Y27632 (40 μM, 1 h pre-incubation) at different times were subjected to western blotting. Phosphorylation levels of MLCt18/s19 were compared with GAPDH. Figure is representative of two separate experiments done in duplicate. (C) Invasion assays with PC3-GFP cells were performed using cell-culture inserts (8 μm pore size) coated by a synthetic basement membrane (Matrigel) (left panel) or culture inserts (8 μm pores) coated by a layer of BMEC above a synthetic basement membrane (Matrigel) (right panel). 2 × 10⁵ PC3-GFP cells were added to the top of the inserts and allowed to invade towards AA (10 μM) for 18 h. PC3-GFP cells were transfected with specific RhoA (siRhoA), RhoC (siRhoC), ROCK1 (siROCK1), ROCK2 (siROCK2) siRNA pools, respectively, or with non-targeted siRNA (siNT) 2 days before the invasion assays. Data represent means±s.e.m. of three separate experiments (in triplicate). **P⩽0.01 vs siNT towards AA. (D) Invasion assays with DU-145 cells were performed using cell-culture inserts (8 μm pore size) coated by a synthetic basement membrane (Matrigel) (left panel) or culture inserts (8 μm pores) coated by a layer of BMEC above a synthetic basement membrane (Matrigel) (right panel). 2 × 10⁵ DU-145 cells were added to the top of the inserts and allowed to invade towards AA (10 μM) for 18 h. DU-145 cells were transfected with specific RhoA (siRhoA) and RhoC (siRhoC) siRNA pools, respectively, or with non-targeted siRNA (siNT) 2 days before the invasion assays. Data represent means±s.e.m. of three separate experiments (in triplicate). *P<0.05, ** P0.01 vs siNT towards AA. Cells were counted after staining with either crystal violet or CK immunostaining.
Figure 4
Figure 4
AA-stimulated transendothelial migration is mediated by specific Rho GTPase signalling. (A) Adhesion assays were performed using PC3-GFP with or without AA (10 μM) added at the beginning of the assay. 4 × 10⁴ PC3-GFP cells were then incubated for 8 min with a confluent layer of BMEC plated in 96 wells. Wells were washed twice in PBS. Levels of adhesion are proportional to fluorescence detected by a bottom reading BMG FLUOstar OPTIMA plate reader at 488/520 nm (excitation/emission filter). PC3-GFP cells were transfected with specific RhoA (siRhoA), RhoC (siRhoC), ROCK1 (siROCK1), ROCK2 (siROCK2) siRNA pools, respectively, or with non-targeted siRNA (siNT) 2 days before the adhesion assays. Data represent means±s.e.m. of three separate experiments. **P⩽0.01 vs siNT with AA. (B) Migration assays were performed using PC3-GFP with or without AA (10 μM). PC3-GFP cells were transfected for 48 h with specific RhoA (siRhoA), RhoC (siRhoC), ROCK1 (siROCK1), ROCK2 (siROCK2) siRNA pools, respectively, or transfected with non-targeted siRNA (siNT) 48 h before the assay. Data represent means±s.e.m. of three separate experiments. *P⩽0.05, **P⩽0.01 vs siNT with AA. (C) Adhesion assays to BMEC over 15 min±AA (10 μM) were undertaken using DU-145 cells. These were transfected with specific RhoA (siRhoA) and RhoC (siRhoC) siRNA pools, respectively, or with non-targeted siRNA (siNT) 2 days before the adhesion assays. Data represent means±s.e.m. of three separate experiments. *P⩽0.05 vs no SIM with AA. (D) Migration assays were performed using DU-145±AA (10 μM). DU-145 cells were transfected with specific RhoA (siRhoA) and RhoC (siRhoC) siRNA pools, respectively, or with non-targeted siRNA (siNT) 2 days before the migration assays. Data represent means±s.e.m. of two separate experiments. *P⩽0.05 vs no SIM with AA. (E) P-MLC2t18/s19, MLC2, RhoA and RhoC content was analysed by western blotting in lysates of PC3-GFP cells transfected for 48 h with specific RhoA (siRhoA) and RhoC (siRhoC) siRNA pools, respectively, or transfected with non-targeted siRNA (siNT) and incubated with or without AA (10 μM) for 75 min. Figure is representative of three separate experiments. *P⩽0.05 vs siNT±incubation with AA. Densitometric values of siNT±incubation with AA were set at one. (F) P-MLC2t18/s19, MLC2, ROCK1 and ROCK2 content was analysed by western blotting in lysates of PC3-GFP cells transfected for 48 h with specific ROCK1 (siROCK1) and ROCK2 (siROCK2) siRNA pools, respectively, or transfected with non-targeted siRNA (siNT) and incubated±AA (10 μM) for 75 min. Figure is representative of three separate experiments. *P⩽0.05 vs siNT without or with incubation with AA. Densitometric values of siNT with or without incubation with AA were set at one.
Figure 5
Figure 5
Statins decrease transendothelial migration through the Rho GTPase signalling pathway. (A) Invasion assays with PC3-GFP cells were performed using cell-culture inserts (8 μm pore size) coated by a synthetic basement membrane (Matrigel) (left panel) or culture inserts (8 μm pores) coated by a layer of BMEC above a synthetic basement membrane (Matrigel) (right panel). 2 × 10⁵ PC3-GFP cells pre-incubated with 1 μM simvastatin (SIM) or vehicle (DMSO) for 24 h were added to the top of the inserts and allowed to invade towards AA (10 μM) for 18 h. Data represent means±s.e.m. of three separate experiments (in triplicate). **P⩽0.01 vs no SIM towards AA. (B) Adhesion assays to BMEC±AA (10 μM) were undertaken with PC3-GFP cells pre-incubated with 1 μM SIM or vehicle only for 24 h before the assay. Data represent means±s.e.m. of three separate experiments. *P⩽0.05 vs no SIM incubated with AA. (C) Migration assays were performed using PC3-GFP±AA (10 μM). PC3-GFP cells were pre-incubated with 1 μM SIM or vehicle only for 24 h before the assay. Data represent means±s.e.m. of three separate experiments. *P⩽0.05 vs vehicle only with AA. (D) Lysates of PC3-GFP cells incubated at different times with simvastatin 1 μM (SIM) (0, 1, 2, 6, 12 and 24 h) were subjected to Rho GTPase assays. Levels of GTP-RhoA and GTP-RhoC were compared with total levels of RhoA and RhoC, respectively. Figure is representative of two separate experiments done in duplicate. *P<0.05, **P<0.01 vs no SIM. Densitometric values of controls without incubation with SIM (vehicle only) were set at one. (E) Lysates of PC3-GFP cells in±AA (10 μM)±pre-incubated with simvastatin 1 μM (SIM) (24 h) were subjected to Rho GTPase assays. Levels of GTP-RhoA and GTP-RhoC were compared with total levels of RhoA and RhoC, respectively. Figure is representative of two separate experiments done in duplicate. *P<0.05 vs no SIM without AA, **P<0.01 vs no SIM with AA. Densitometric values of controls without incubation with SIM (vehicle only)/AA were set at one. (F) P-MLC2t18/s19, MLC2, P-Akt and Akt content was analysed by western blotting in lysates of PC3-GFP cells incubated at different times with 1 μM SIM or vehicle only (DMSO). Figure is representative of two separate experiments done in duplicate. *P<0.05, **P<0.01 vs no SIM (vehicle only). Densitometric values of controls without incubation with SIM (vehicle only) were set at one. (G) P-MLC2t18/s19, MLC2, P-Akts473 and Akt content was analysed by western blotting in lysates of PC3-GFP cells±pre-incubated with simvastatin 1 μM (SIM) (24 h) and incubated over time with AA (10 μM). Figure is representative of two separate experiments done in duplicate. *P⩽0.05 vs Ctrl (DMSO) at the same time with AA incubation. Densitometric values of controls (DMSO, without AA) were set at one. (H) P-MLC2t18/s19, MLC2, P-Akt and Akt content was analysed by western blotting in lysates of DU-145 cells incubated at different times with AA (10 μM). Levels of P-Akt and P-MLC2 were compared with total levels of Akt and MLC2, respectively. Figure is representative of two separate experiments done in duplicate. *P⩽0.05 vs Ctrl (DMSO) without AA. Densitometric values of controls were set at one. (I) Invasion assays with DU-145 cells were performed using cell-culture inserts (8 μm pore size) coated by a synthetic basement membrane (Matrigel) (left panel) or culture inserts (8 μm pores) coated by a layer of BMEC above a synthetic basement membrane (Matrigel) (right panel). 2 × 10⁵ DU-145 cells were added to the top of the inserts and allowed to invade towards AA (10 μM) for 18 h. DU-145 cells were pre-incubated with SIM or vehicle only (DMSO) 24 h before the invasion assays. Data represent means±s.e.m. of three separate experiments (in triplicate). *P<0.05 vs DMSO towards AA. Cells were counted after staining with either crystal violet or CK immunostaining. (J) Adhesion assays to BMEC over 15 min±AA (10 μM) were undertaken using DU-145 cells. These were pre-incubated with SIM or vehicle only (DMSO) 24 h before the adhesion assays. Data represent means±s.e.m. of three separate experiments. *P⩽0.05 vs DMSO incubated with AA. (K) Migration assays were performed using DU-145±AA (10 μM). DU-145 cells were pre-incubated with SIM or vehicle only (DMSO) 24 h before the migration assays. Data represent means±s.e.m. of two separate experiments. *P⩽0.05 vs DMSO incubated with AA.

Similar articles

Cited by

References

    1. Aktories K, Just I. Clostridial Rho-inhibiting protein toxins. Curr Top Microbiol Immunol. 2005;291:113–1145. - PubMed
    1. Boureux A, Vignal E, Faure S, Fort P. Evolution of the Rho family of ras-like GTPases in eukaryotes. Mol Biol Evol. 2007;24 (1:203–216. - PMC - PubMed
    1. Breau RH, Karnes RJ, Jacobson DJ, McGree ME, Jacobsen SJ, Nehra A, Lieber MM, St, Sauver JL. The association between statin use and the diagnosis of prostate cancer in a population based cohort. J Urol. 2010;184 (2:494–499. - PMC - PubMed
    1. Brown M, Hart C, Tawadros T, Ramani V, Sangar V, Lau M, Clarke N. The differential effects of statins on the metastatic behaviour of prostate cancer. Br J Cancer. 2012;106 (10:1689–1696. - PMC - PubMed
    1. Brown MD, Hart C, Gazi E, Gardner P, Lockyer N, Clarke N. Influence of omega-6 PUFA arachidonic acid and bone marrow adipocytes on metastatic spread from prostate cancer. Br J Cancer. 2010;102 (2:403–413. - PMC - PubMed

Publication types

MeSH terms