. 2014 Mar 4;7(315):ra22.
doi: 10.1126/scisignal.2005025.

KCNQ1, KCNE2, and Na+-coupled solute transporters form reciprocally regulating complexes that affect neuronal excitability

Affiliations

KCNQ1, KCNE2, and Na+-coupled solute transporters form reciprocally regulating complexes that affect neuronal excitability

Geoffrey W Abbott et al. Sci Signal. .

Abstract

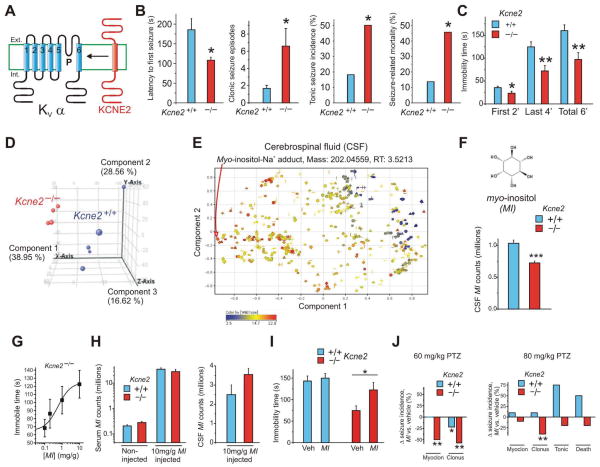
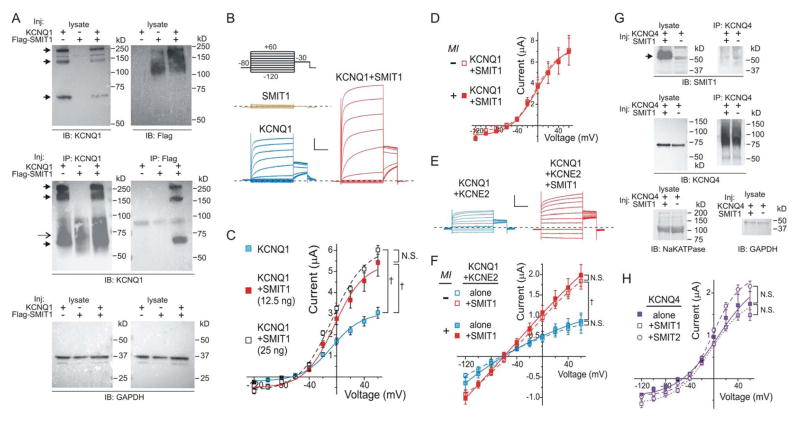
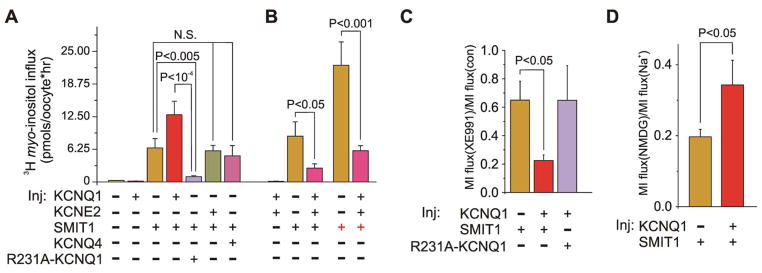
Na(+)-coupled solute transport is crucial for the uptake of nutrients and metabolic precursors, such as myo-inositol, an important osmolyte and precursor for various cell signaling molecules. We found that various solute transporters and potassium channel subunits formed complexes and reciprocally regulated each other in vitro and in vivo. Global metabolite profiling revealed that mice lacking KCNE2, a K(+) channel β subunit, showed a reduction in myo-inositol concentration in cerebrospinal fluid (CSF) but not in serum. Increased behavioral responsiveness to stress and seizure susceptibility in Kcne2(-/-) mice were alleviated by injections of myo-inositol. Suspecting a defect in myo-inositol transport, we found that KCNE2 and KCNQ1, a voltage-gated potassium channel α subunit, colocalized and coimmunoprecipitated with SMIT1, a Na(+)-coupled myo-inositol transporter, in the choroid plexus epithelium. Heterologous coexpression demonstrated that myo-inositol transport by SMIT1 was augmented by coexpression of KCNQ1 but was inhibited by coexpression of both KCNQ1 and KCNE2, which form a constitutively active, heteromeric K(+) channel. SMIT1 and the related transporter SMIT2 were also inhibited by a constitutively active mutant form of KCNQ1. The activities of KCNQ1 and KCNQ1-KCNE2 were augmented by SMIT1 and the glucose transporter SGLT1 but were suppressed by SMIT2. Channel-transporter signaling complexes may be a widespread mechanism to facilitate solute transport and electrochemical crosstalk.


Conflict of interest statement

Competing interests: The authors declare that they have no competing interests.

Figures

Figure 1
Figure 1. Global metabolite profiling reveals Kcne2−/− mice have depleted CSF myo-inositol, supplementation with which alleviates their neurological phenotypes
A. Transmembrane topology of Kv channel α subunit (blue) and KCNE2 (red). B. Mean seizure activity during the first 20 minutes after injection of pentylenetetrazole in Kcne2+/+ and Kcne2−/− mice; n = 22 mice per genotype. * P<0.05. C. Mean immobility time, and immobile-to-mobile switches, during tail suspension test for Kcne2+/+ and Kcne2−/− mice; n = 15 mice per genotype. * P<0.05; ** P<0.01. D. Unsupervised principal component analysis (PCA) of CSF metabolites acquired by LC-MS in positive ion mode. Relative quantification of 586 features (defined by an accurate mass and retention time pair) was obtained in CSF from all samples in at least one genotype. Data points are a 3-D projection that summarizes the variance of all CSF features (metabolites) from an individual mouse as three principal components, quantified as coordinates on each of three graphical projections. Results show consistent clustering of CSF metabolites for both Kcne2+/+ and Kcne2−/− mice. These genotypes were distinguished by principal component 1 (PC1; quantified on the X-axis), which accounted for >38% of total between-genotype variance. E. Loading plot, depicting the relative contribution of individual features (metabolites) to the between-genotype variance observed for PC1 and PC2, as depicted in (D). The features that are most distant from the origin in PC1 are those that make the greatest contribution to distinguishing CSF in Kcne2−/− compared to Kcne2+/+ mice. The single greatest contributor to PC1 variance (loading −0.948) (red arrow) was later identified as the Na+ adduct of myo-inositol (RT, retention time). F. Extracted ion chromatograms (EICs) for myo-inositol in CSF. Relative abundances for the Na+ adduct of myo-inositol in CSF samples were calculated based on the area under EIC curves. The concentration of myo-inositol in CSF was significantly lower in Kcne2−/− compared to Kcne2+/+ mice (30% decrease); n = 4–5 mice per genotype. ***P <0.002. G. Dose-dependent effects of intraperitoneal injection of myo-inositol on the immobility of Kcne2−/− mice during the final four minutes of the tail suspension test; n = 9–20 mice per dose. H. Serum (left) and CSF (right) concentrations of myo-inositol in non-injected and myo-inositol-injected mice. No significant genotype-dependent differences (P>0.05). I. Comparison of effects of myo-inositol (n = 10–15 mice per group) on immobility time of Kcne2+/+ and Kcne2−/− mice in the tail suspension test. *Significantly different from values obtained for non-injected and vehicle-injected Kcne2−/− mice only (P < 0.05). J. Effects of myo-inositol on seizure incidence during the first 20 minutes following injection of pentylenetetrazole; n = 10 mice per group. Significant difference from same-genotype, vehicle-injected mice: *P < 0.05; **P < 0.01.
Figure 2
Figure 2. KCNE2 and KCNQ1 co-assemble with SMIT1 in mouse choroid plexus epithelium
A. Mean serum myo-inositol concentration of Kcne2+/+ and Kcne2−/− mice (n = 5 mice/genotype). B. Western blots of mouse Kcne2+/+ and Kcne2−/− choroid plexus epithelium and kidney lysates showing no appreciable effect of Kcne2 deletion on SMIT1 protein abundance, with GAPDH as a loading control (each lane using lysate from a different mouse). C. Representative (of multiple sections from n = 2 mice per genotype) immunofluorescence images of adult Slc5a3+/+ and Slc5a3−/− mouse choroid plexus epithelium. White arrows, apically localized SMIT1. Scale bar: 40 μm. Green, anti-SMIT1 antibody; blue, DAPI. D. Representative (of multiple sections from n = 2 mice per genotype) immunofluorescence images of adult Kcne2−/− mouse choroid plexus epithelium showing regions of apical membrane regions with (white arrows) or without (red arrow) SMIT1 signal. Scale bar: 40 μm. Green, anti-SMIT1 antibody; blue, DAPI. E. Immunohistochemistry of adult Kcne2+/+ mouse choroid plexus epithelium, showing apical localization of KCNQ1 (arrows). Scale bar: 80 μm. Brown, anti-KCNQ1 antibody; representative of n = 3 mice. F. Immunohistochemistry of adult Kcne2+/+ mouse choroid plexus epithelium, showing apical localization of KCNE2 (arrows). Scale bar: 40 μm. Brown, anti-KCNE2 antibody; representative of n = 3 mice. G. Western blots using immunoblotting (IB) antibodies as indicated, on adult Kcne2+/+ mouse choroid plexus epithelium lysates and immunoprecipitates (IP) using IP antibodies as indicated. Left, KCNE2 forms complexes with each of KCNQ1, Kv1.3 and SMIT1, but not NKCC1. Right, SMIT1 (arrow) forms complexes with KCNQ1 but not Kv1.3. Representative of n = 2 experiments. H. Western blots using immunoblotting (IB) antibodies as indicated, on adult Kcne2+/+ and Kcne2−/− mouse choroid plexus epithelium lysates and immunoprecipitates (IP) using IP antibodies as indicated. KCNQ1 (but not Kv1.3 or GAPDH) forms complexes with SMIT1 (but not NKCC1). Representative of n = 2 experiments. Arrow, higher exposure of blot directly above, to show KCNQ1 bands in the lysate.
Figure 3
Figure 3. SMIT1 co-assembles with and augments activity of KCNQ1-KCNE2
A. Western blots using immunoblotting (IB) antibodies as indicated, on CHO cell lysates (upper blots) and immunoprecipitates (IP) (middle blots) using IP antibodies as indicated. Cells were transfected with KCNQ1 and/or Flag-tagged SMIT1 cDNA as indicated. Filled arrowheads indicate the characteristic monomer, dimer and tetramer banding pattern of heterologously expressed KCNQ1. Single arrow indicates precipitating antibody detected by secondary antibody. Lower blots: GAPDH loading controls for lysates used in gels above. Results representative of 2 independent experiments. B. Exemplar current traces recorded in oocytes expressing SMIT1 and/or KCNQ1 using the standard voltage family protocol (inset). Scale bars: vertical, 1 μA; horizontal, 1 s. Zero current level indicated by dashed line. C. Mean raw current-voltage relationships for oocytes co-injected with KCNQ1 cRNA with or without the amount of SMIT1 cRNA indicated; n = 21 (KCNQ1), 7 (SMIT1+KCNQ1, 12.5 ng), 11 (SMIT1+KCNQ1, 25 ng). P<0.0005 at 60 mV. N.S., non-significant (P>0.05). D. Mean raw macroscopic current-voltage relationships for oocytes in ND96 bath solution, with or without myo-inositol, co-injected with KCNQ1 cRNA and SMIT1 cRNA; n = 4–5 oocytes per group. E. Exemplar current traces recorded in oocytes expressing SMIT1 and/or KCNQ1-KCNE2 using the standard voltage family protocol (panel B). Scale bars: vertical, 0.5 μA; horizontal, 1 s. Zero current level indicated by dashed line. F. Mean raw current-voltage relationships for oocytes as in E, with or without myo-inositol in bath solution; n = 5–10 oocytes per group. P<0.01 at 60 mV. N.S., non-significant (P>0.05). G. Upper: western blots of membrane-fractionated lysate (left) and anti-KCNQ4 antibody immunoprecipitated (IP) fraction (right) of X. laevis oocytes injected (Inj) with cRNA encoding KCNQ4 and/or SMIT1 and immunoblotted (IB) with anti-SMIT1 antibody. Arrow, the expected migration distance for SMIT1. Results representative of 2 independent experiments. Middle: as above but IB with anti-KCNQ4 antibody. Lower, Na+/K+ATPase (left) and GAPDH (right) loading controls for lysates. H. Mean raw current-voltage relationships for oocytes expressing SMIT1 or SMIT2 and/or KCNQ4 using the standard voltage family protocol (panel B); n = 9–12 oocytes per group. N.S., non-significant (P>0.05).
Figure 4
Figure 4. KCNQ1 and KCNQ1-KCNE2 have differential effects on SMIT1 myo-inositol transport
A. Mean myo-[2-3H(N)] inositol uptake by oocytes injected with cRNA encoding KCNQ1, KCNE2, SMIT1, KCNQ4, and/or R231A-KCNQ1 as indicated; n = 9–12. All SMIT1-injected groups gave mean values significantly different from non-SMIT1-injected groups (P<0.001). N.S., non-significant (P>0.05). B. Mean myo-[2-3H(N)] inositol uptake by oocytes injected with cRNA encoding KCNQ1, KCNE2, and/or SMIT1 as indicated (black +, SMIT1; red +, SMIT1); n = 10–11. All SMIT1-injected groups gave mean values significantly different from the non-SMIT1-injected group (P<0.001). C. Effects of XE991 on myo-[2-3H(N)] inositol uptake by oocytes injected with cRNA encoding KCNQ1, R231A-KCNQ1, and/or SMIT1 as indicated, normalized to mean flux in the absence of XE991 (con); n = 9–12. D. Effects of Na+ substitution with NMDG on mean myo-[2-3H(N)] inositol uptake by oocytes injected with cRNA encoding KCNQ1, and/or SMIT1 as indicated, normalized to mean flux in the presence of 96 mM NaCl (con); n = 12–13.
Figure 5
Figure 5. Co-regulation of the KCNQ1 channel with SMIT2 and SGLT1 transporters
A. Exemplar current traces recorded in oocytes expressing KCNQ1 and/or SMIT2, SMCT, SGLT1, using the standard voltage family protocol (inset). Scale bars: vertical, 1 μA; horizontal, 1 s. Zero current levels indicated by dashed lines. B. Mean raw current-voltage relationships, oocytes (and symbols) as in (A); n = 19 (KCNQ1), 13 (SMIT2+KCNQ1), 12 (SMCT+KCNQ1), 16 (SGLT1+KCNQ1). P<0.0001 at 60 mV. C. Mean effects of the various transporters on KCNQ1 or KCNQ4 current density at 60 mV normalized to current density in the absence of co-expressed transporters, pooled from 2–3 batches of oocytes; n = 25–37. N.S., non-significant (P>0.05). D. Mean myo-[2-3H(N)] inositol uptake of oocytes injected with cRNA encoding KCNQ1, KCNE2, SMIT2, KCNQ4, and/or R231A-KCNQ1 as indicated. Data are pooled from 4–5 batches of oocytes and normalized to each intra-batch mean for SMIT2 alone (n = 45–51) except for KCNQ4 and R231A-KCNQ1 (each pooled and normalized from 2 batches, n = 16–19). E. Mean myo-[2-3H(N)] inositol uptake by oocytes injected with cRNA encoding KCNQ1, KCNE2, and/or SMIT2 as indicated; n = 9–10.

Similar articles

Cited by

References

    1. McCrossan ZA, Abbott GW. The MinK-related peptides. Neuropharmacology. 2004;47:787–821. - PubMed
    1. Panaghie G, Abbott GW. The role of S4 charges in voltage-dependent and voltage-independent KCNQ1 potassium channel complexes. J Gen Physiol. 2007;129:121–33. - PMC - PubMed
    1. Abbott GW, Sesti F, Splawski I, Buck ME, Lehmann MH, Timothy KW, Keating MT, Goldstein SA. MiRP1 forms IKr potassium channels with HERG and is associated with cardiac arrhythmia. Cell. 1999;97:175–87. - PubMed
    1. Heron SE, Hernandez M, Edwards C, Edkins E, Jansen FE, Scheffer IE, Berkovic SF, Mulley JC. Neonatal seizures and long QT syndrome: a cardiocerebral channelopathy? Epilepsia. 2010;51:293–6. - PubMed
    1. Tam GW, van de Lagemaat LN, Redon R, Strathdee KE, Croning MD, Malloy MP, Muir WJ, Pickard BS, Deary IJ, Blackwood DH, Carter NP, Grant SG. Confirmed rare copy number variants implicate novel genes in schizophrenia. Biochem Soc Trans. 2010;38:445–51. - PubMed

Publication types

MeSH terms