. 2014;41(1):129-49.
doi: 10.3233/JAD-131370.

Brain pyroglutamate amyloid-β is produced by cathepsin B and is reduced by the cysteine protease inhibitor E64d, representing a potential Alzheimer's disease therapeutic

Affiliations

Brain pyroglutamate amyloid-β is produced by cathepsin B and is reduced by the cysteine protease inhibitor E64d, representing a potential Alzheimer's disease therapeutic

Gregory Hook et al. J Alzheimers Dis. 2014.

Abstract

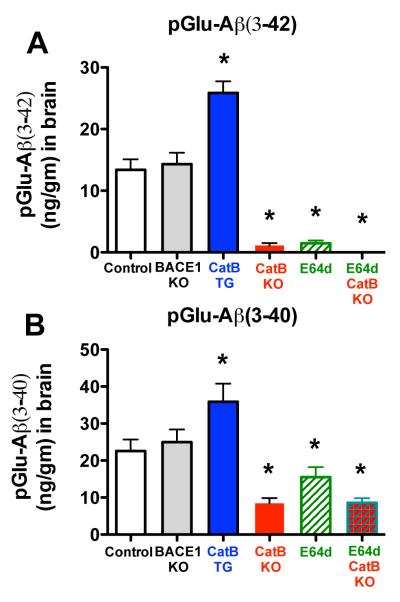
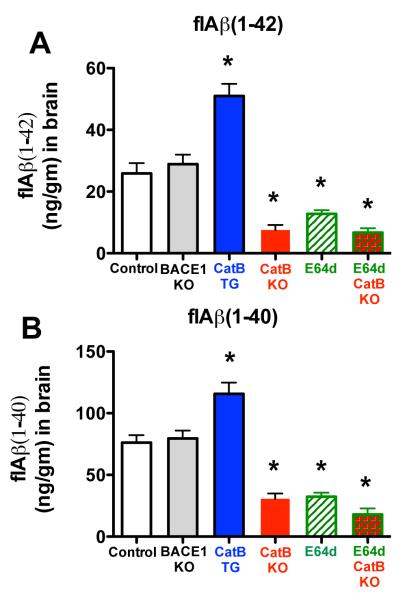
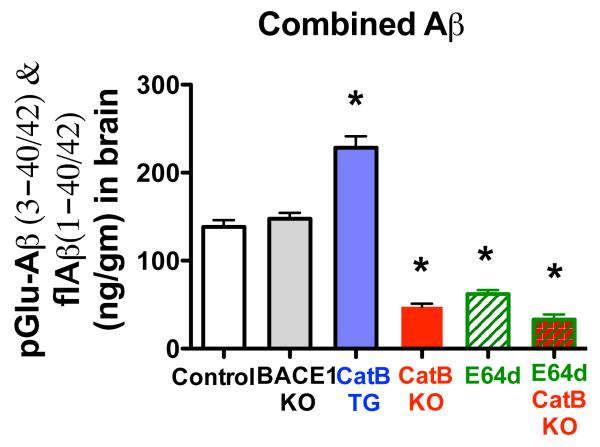
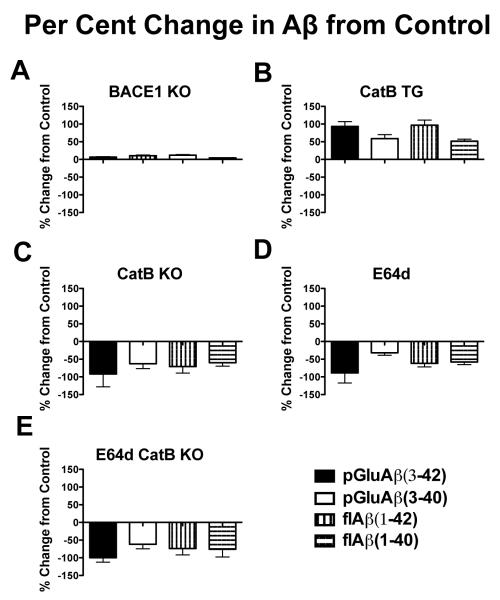
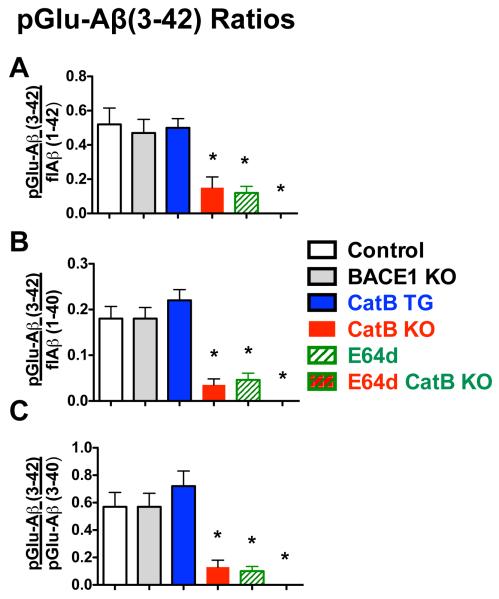
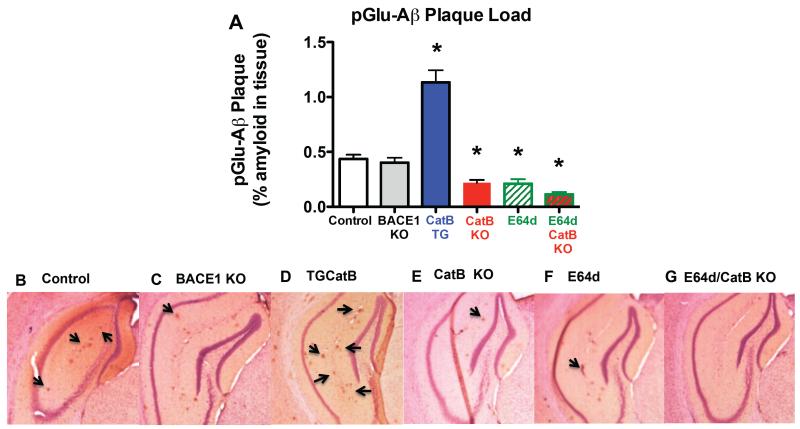
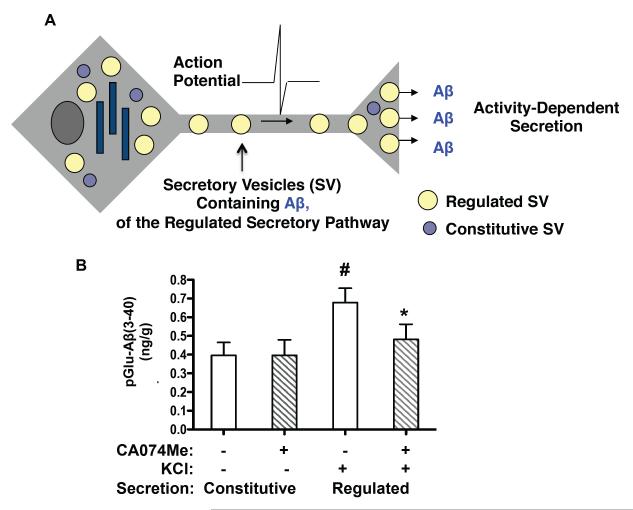
Pyroglutamate amyloid-β peptides (pGlu-Aβ) are particularly pernicious forms of amyloid-β peptides (Aβ) present in Alzheimer's disease (AD) brains. pGlu-Aβ peptides are N-terminally truncated forms of full-length Aβ peptides (flAβ(1-40/42)) in which the N-terminal glutamate is cyclized to pyroglutamate to generate pGlu-Aβ(3-40/42). β-secretase cleavage of amyloid-β precursor protein (AβPP) produces flAβ(1-40/42), but it is not yet known whether the β-secretase BACE1 or the alternative β-secretase cathepsin B (CatB) participate in the production of pGlu-Aβ. Therefore, this study examined the effects of gene knockout of these proteases on brain pGlu-Aβ levels in transgenic AβPPLon mice, which express AβPP isoform 695 and have the wild-type (wt) β-secretase activity found in most AD patients. Knockout or overexpression of the CatB gene reduced or increased, respectively, pGlu-Aβ(3-40/42), flAβ(1-40/42), and pGlu-Aβ plaque load, but knockout of the BACE1 gene had no effect on those parameters in the transgenic mice. Treatment of AβPPLon mice with E64d, a cysteine protease inhibitor of CatB, also reduced brain pGlu-Aβ(3-42), flAβ(1-40/42), and pGlu-Aβ plaque load. Treatment of neuronal-like chromaffin cells with CA074Me, an inhibitor of CatB, resulted in reduced levels of pGlu-Aβ(3-40) released from the activity-dependent, regulated secretory pathway. Moreover, CatB knockout and E64d treatment has been previously shown to improve memory deficits in the AβPPLon mice. These data illustrate the role of CatB in producing pGlu-Aβ and flAβ that participate as key factors in the development of AD. The advantages of CatB inhibitors, especially E64d and its derivatives, as alternatives to BACE1 inhibitors in treating AD patients are discussed.

Keywords: AβPP; BACE1; Pyroglutamate amyloid-β; cathepsin B; cysteine protease; inhibitor; protease; secretion; transgenic AD mice.


Figures

Figure 1
Figure 1. Illustration of flAβ(1-40), flAβ(1-42), N-truncated Aβ(3-40), N-truncated Aβ(3-42), pGlu-Aβ(3-40), and pGlu-Aβ(3-42) indicates the differences and similarities among these Aβ species
All Aβ species are shown with details of their N- and C-termini. Aβ species having C-terminal residues at position 40 and 42 are colored blue and red, respectively. This study analyzed flAβ(1-40), flAβ(1-42), pGlu-Aβ(3-40), and pGlu-Aβ(3-42) (but not N-truncated Aβ(3-40) and N-truncated Aβ(3-42)). A. flAβ(1-40). In this Aβ species, aspartic acid (D) is located at the N-terminus, which is known as position 1 of the Aβ, and valine (V) is at the C-terminus located at position 40. The N-terminus of flAβ(1-40) is created by β-secretase cleavage of AβPP. B. flAβ(1-42). Like flAβ(1-40), this Aβ species begins at the N-terminus position 1 with D but has two additional amino acids (compared to flAβ(1-40)) at the C-terminus, which are isoleucine (I) and alanine (A) with the latter located at position 42. These additional C-terminal residues make flAβ(1-42) more neurotoxic with a greater propensity to aggregate Aβ than flAβ(1-40). The N-terminus of flAβ(1-42) is also created by β-secretase cleavage of AβPP. C. N-truncated Aβ(3-40). D and A found in flAβ at positions 1 and 2 are not present and the N-terminus begins with glutamate (E) at position 3. This Aβ species has the C-terminal V residue at position 40 as in flAβ(1-40). N-truncated Aβ(3-40) is required for pGlu-Aβ(3-40) formation because E can only be cyclized if it is an N-terminal amino acid. How N-truncated Aβ(3-40) is formed from AβPP is not known. D. N-truncated Aβ(3-42). This species has features of N-truncated Aβ(3-40) in that the N-terminus is E at position 3 and the C-terminus is residue A at position 42 (like that of flAβ(1-42)). Again, N-truncated Aβ(3-42) is required for pGlu-Aβ(3-42) formation but how that occurs is not known. E. pGlu-Aβ(3-40). This Aβ species is the same as N-terminal Aβ(3-40) except the N-terminal E residue is cyclized to pyroglutamate (pGlu or pE) at position 3. E is converted to pE by the enzyme glutaminyl cyclase (QC). One aspect of this study was to determine if the established β-secretase, BACE1, or the alternative β-secretase, CatB, affects pGlu-Aβ(3-40) levels. F. pGlu-Aβ(3-42). This Aβ species is the same as N-terminal Aβ(3-42) except the N-terminal E residue is cyclized to pE at position 3. pGlu-Aβ(3-42) is more neurotoxic, has a greater propensity to aggregate Aβ, and is much more resistant to degradation than flAβ(1-42). pGlu-Aβ(3-42) is thought by some to be the Aβ species which causes AD. Again, a focus of this study was to evaluate the effects of BACE1 and CatB on pGlu-Aβ(3-42) levels.
Figure 2
Figure 2. pGlu-Aβ(3-40/42) levels were reduced in AβPPLon mice with CatB gene knockout (KO) or with E64d inhibition of CatB activity, increased in animals expressing the CatB gene, and not effected in BACE1 KO animals
A. pGlu-Aβ(3-42). The mean brain pGlu-Aβ(3-42) levels for AβPPLon mice (control), BACE1 gene knockout AβPPLon mice (BACE1 KO), transgenic CatB AβPPLon mice (CatB TG), CatB knockout AβPPLon mice (CatB KO), AβPPLon mice fed E64d-containing chow (E64d), and CatB knockout AβPPLon mice fed E64d-containing chow (E64d CatB KO) are shown. Brain pGlu-Aβ(3-42) levels were significantly reduced in CatB KO, E64d, and E64d CatB KO mice, significantly increased in CatB TG mice, and the same in BACE1 KO mice as compared to control mice. B. pGlu-Aβ(3-40). The mean brain pGlu-Aβ(3-40) values for the same animal groups as in Fig. 2A are shown. Brain pGlu-Aβ(3-40) levels were significantly reduced in CatB KO, E64d, and E64d CatB KO mice, significantly increased in CatB TG mice, and the same in BACE1 KO mice as compared to control mice. (All animal data in this study were from animals that were12 months old at sacrifice. Panels ‘A’ and ‘B,’ ANOVA, one way analysis of variance, p < 0.0001, Dunnett’s multiple comparison with control, *p < 0.05)
Figure 3
Figure 3. flAβ(1-40/42) levels were reduced by CatB gene knockout or inhibition by E64d, increased by CatB gene expression, and not effected by BACE1 knockout in AβPPLon animals
A. flAβ(1-42). CatB KO, E64d, and E64d CatB KO mice had significantly lower flAβ(1-42), CatB TG mice had significantly higher flAβ(1-42), and BACE1 KO mice had statistically equivalent flAβ(1-42) levels as in control mice. B. Aβ(1-40). CatB KO, E64d, and E64d CatB KO mice had significantly reduced Aβ(1-40), CatB TG mice had significantly increased Aβ(1-40), and BACE1 KO mice had flAβ(1-40) that were statistically equivalent to that of control mice. (panels ‘A’ and ‘B’, ANOVA, one way analysis of variance, p < 0.0001, Dunnett’s multiple comparison to control,*p < 0.05)
Figure 4
Figure 4. Total measured Aβ was lower in AβPPLon mice with CatB knockout or inhibition, higher in animals having expressing the CatB gene, and not effected in animals with BACE1 gene knockout
The combined sum of the pGlu-Aβ(3-42), pGlu-Aβ(3-40), flAβ(1-42), and flAβ(1-40) is displayed for each animal group. The total measured Aβ was significantly reduced in CatB KO, E64d, and E64d CatB KO mice, significantly increased in CatB TG mice, and unaffected in BACE1 KO mice compared to control mice. (ANOVA, one way analysis of variance, p < 0.0001, Dunnett’s multiple comparison to control, *p < 0.05)
Figure 5
Figure 5. The percent changes in pGlu-Aβ(3-42), pGlu-Aβ(3-40), flAβ(1-42), and flAβ(1-40) were all greatly reduced in AβPPLon mice CatB knockout or inhibition, all greatly increased in animals expressing the CatB gene, and not significantly changed in animals with BACE1 knockout relative to the levels in control mice
The panels show for each experimental animal group the percent changes in pGlu-Aβ(3-42), pGlu-Aβ(3-40), flAβ(1-42), and flAβ(1-40) relative to the corresponding species in control mice. The ordinate axis is the same scale in all panels so that direct comparisons among the panels can be made. A. BACE1 KO mice. The Aβ species had very small positive and negative percent changes. B. CatB TG mice. All Aβ species had large positive percent changes with pGlu-Aβ(3-40) and flAβ(1-40) being about 50% higher, and pGlu-Aβ(3-42) and flAβ(1-42) being about 100% higher than controls. C. CatB KO mice. All Aβ species had large negative percent changes with pGlu-Aβ(3-40) and flAβ(1-40) being more than 50% and 60% lower respectively, and pGlu-Aβ(3-42) and flAβ(1-42) being more than 90% and 70% lower, respectively. D. E64d mice. All Aβ species had large negative percent changes with pGlu-Aβ(3-40) and flAβ(1-40) being about 35% and 55% lower, respectively, and pGlu-Aβ(3-42) and flAβ(1-42) being more than 90% and 50% lower, respectively. E. E64d CatB KO mice. All Aβ species had large negative percent changes with pGlu-Aβ(3-40) and flAβ(1-40) being 66% and 75% lower, respectively, and pGlu-Aβ(3-42) and flAβ(1-42) being 100% and 80% lower, respectively.
Figure 6
Figure 6. Ratios of pGlu-Aβ(3-42) to flAβ(1-40/42) and pGlu-Aβ(3-40) were significantly lower in AβPPLon mice with CatB gene knockout or with E64d treatment relative to those in control mice
Of all the ratios of Aβ species, only the pGlu-Aβ(3-42) ratios differed among the animal groups and those ratios are shown here. The E64d CatB KO mouse data is in the far right column position, but because the pGlu-Aβ(3-42) level was zero, all the pGlu-Aβ(3-42) ratios were zero for those animals and thus no column appears at that position. A. pGlu-Aβ(3-42)/flAβ(1-42). This ratio was about 3.7 – 4.2 fold lower in CatB KO, E64d mice, and E64d CatB KO mice as compared to that ratio in control mice. The ratio did was not significantly different for the BACE1 KO and CatB TG mice relative to control mice. B. pGlu-Aβ(3-42)/flAβ(1-40). This ratio was about 4.5 - 5 fold lower in the CatB KO, E64d, and E64d CatB KO mice than control mice. There were no significant difference in the ratio of the BACE1 KO and CatB TG relative to control mice but the CatB TG mice tended to have a higher ratio. C. pGlu-Aβ(3-42)/pGlu-Aβ(3-40). This ratio was a significant 4.8 -5 times lower in the CatB KO, E64d and E64d CatB KO mice relative to control mice. There was no significant difference in this ratio in the BACE1 KO and CatB TG relative to that of the control mice but the CatB mice tended to have a higher ratio. (ANOVA, one way analysis of variance, p < 0.0001, Dunnett’s multiple comparison to control using standard deviations of the ratios, *p < 0.05)
Figure 7
Figure 7. pGlu-Aβ amyloid plaque load was about 50% lower in CatB KO, E64d, and E64d CatB KO mice, much higher in CatB TG mice, and the same in BACE1 KO mice
A. Quantitation of pGlu-Aβ amyloid plaque load. Quantitative image analysis data are shown for immunohistological brain sections analyzed for plaques detected with anti-pGlu-Aβ antibody that recognizes both pGlu-Aβ(3-40) and pGlu-Aβ(3-42) in all animal groups. The pGlu-Aβ plaque load was significantly lower in CatB KO, E64d, and E64d CatB KO mice and significantly higher in CatB TG animals, but the same in BACE1 KO mice relative to that in control mice. (ANOVA, one way analysis of variance, p < 0.0001, Dunnett’s multiple comparison to control, *p < 0.05) B-G. Exemplary micrographs of brain sections. Representative micrographs of the hippocampus from control (B), BACE1 KO (C), CatB TG (D), CatB KO (E), E64d (F), and E64d CatB KO mice (G) are shown. Arrows point to examples of individual pGlu-Aβ plaque deposits within the section.
Figure 8
Figure 8. The CatB inhibitor CA-074Me reduces pGlu-Aβ(3-40) generated in the regulated secretory pathway of neuronal-like chromaffin cells
A. Illustration of neuronal activity-dependent regulated secretion and constitutive (basal) secretion. Regulated and constitutive secretory pathways represent two distinct secretory vesicle systems in which neurons produce bioactive molecules [68-73]. Notably activity-dependent secretion of neurotransmitters and bioactive molecules utilize the regulated secretory pathway, composed of regulated secretory vesicles that release molecules in an activity-dependent manner [68-73]. Both pathways are illustrated. B. pGlu-Aβ(3-40) is produced and secreted from the regulated secretory pathway, and is reduced by CA074Me, an inhibitor of CatB. In cultured neurons, activity-dependent secretion is modeled by KCl depolarization (high KCl in the medium). Constitutive, basal secretion was conducted without KCl. Neuronal-like chromaffin cells (in primary culture, prepared from the sympathetic nervous system) were utilized to assess pGlu-Aβ released from the regulated and constitutive secretory pathways, and to assess the effects of the CatB inhibitor CA074Me. KCl significantly stimulated the regulated secretion of pGlu-Aβ(3-40) by ~2-fold above basal constitutive secretion (open bars). Importantly, treatment of cells with CA074Me (striped bars) reduced the amount of pGluAβ(3-40) in the regulated compared to the constitutive secretory pathway. (Statistically significant for KCl compared to no KCl, student’s t-test, #p < 0.05; statistically significant for CA074Me and KCl condition, compared to KCl condition, student’s t-test, * p < 0.05)

References

    1. Selkoe DJ. Alzheimer’s disease: genes, proteins, and therapy. Physiol Rev. 2001;81:741–766. - PubMed
    1. Gandy S, Martins RN, Buxbaum J. Molecular and cellular basis for anti-amyloid therapy in Alzheimer disease. Alzheimer Dis Assoc Disord. 2003;17:259–266. - PubMed
    1. Crews L, Masliah E. Molecular mechanisms of neurodegeneration in Alzheimer’s disease. Hum Mol Genet. 2010;19:R12–20. - PMC - PubMed
    1. Huang Y, Mucke L. Alzheimer mechanisms and therapeutic strategies. Cell. 2012;148:1204–1222. - PMC - PubMed
    1. De Kimpe L, Scheper W. From alpha to omega with Abeta: targeting the multiple molecular appearances of the pathogenic peptide in Alzheimer’s disease. Curr Med Chem. 2010;17:198–212. - PubMed

Publication types

MeSH terms

LinkOut - more resources