

Distinct Wnt-driven primitive streak-like populations reflect in vivo lineage precursors
- PMID: 24595287
- PMCID: PMC3943179
- DOI: 10.1242/dev.101014
Distinct Wnt-driven primitive streak-like populations reflect in vivo lineage precursors
Erratum in
-
Distinct Wnt-driven primitive streak-like populations reflect in vivo lineage precursors.Development. 2015 Feb 15;142(4):809. doi: 10.1242/dev.122093. Development. 2015. PMID: 25670799 Free PMC article. No abstract available.
Abstract
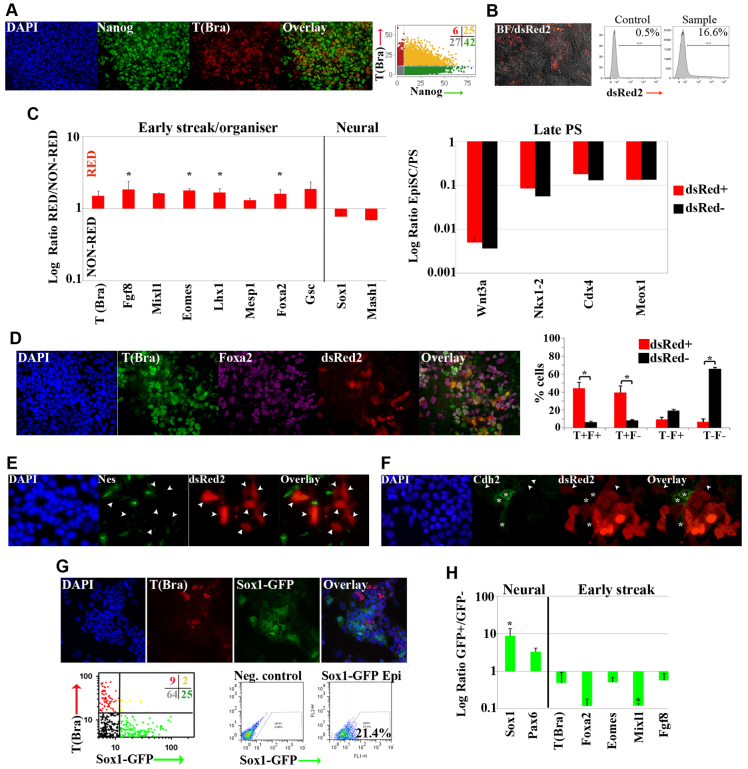
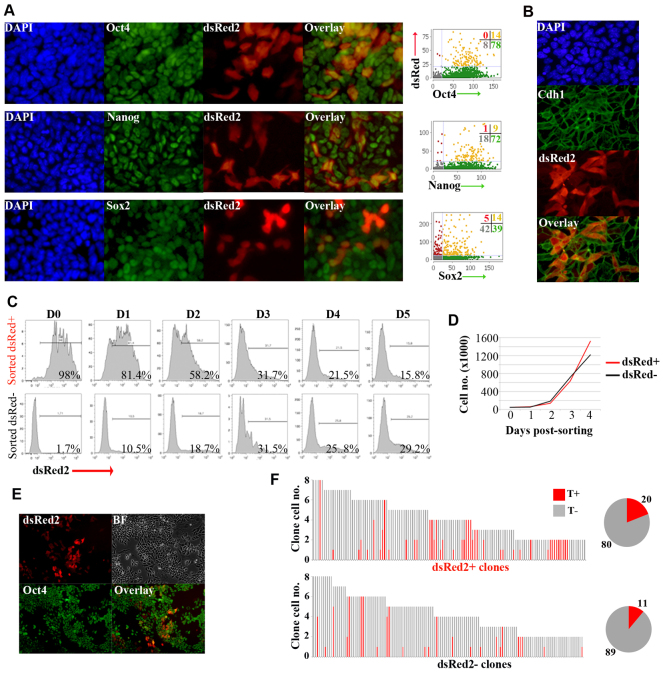
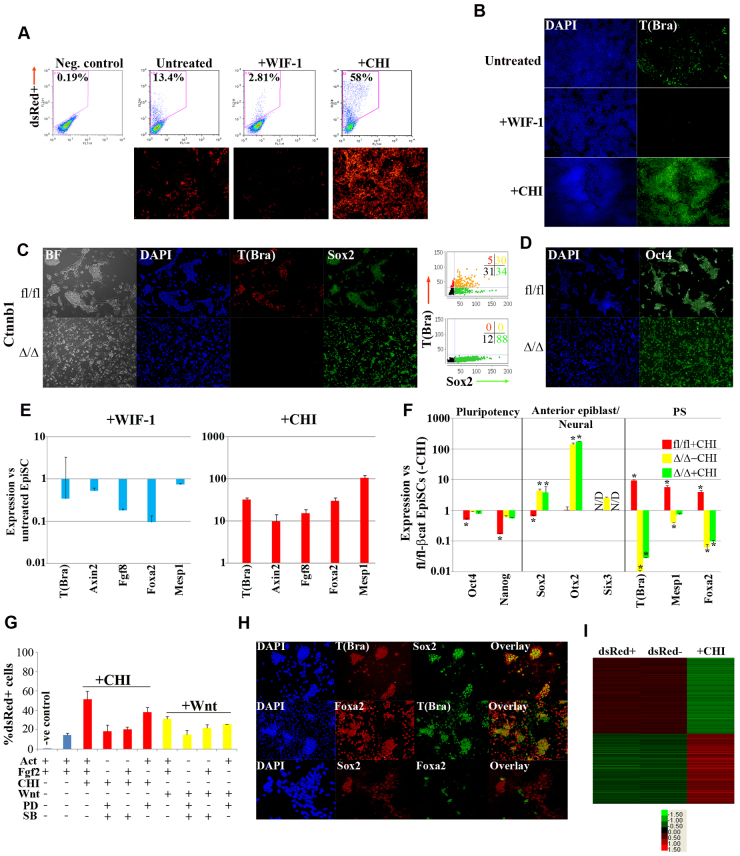
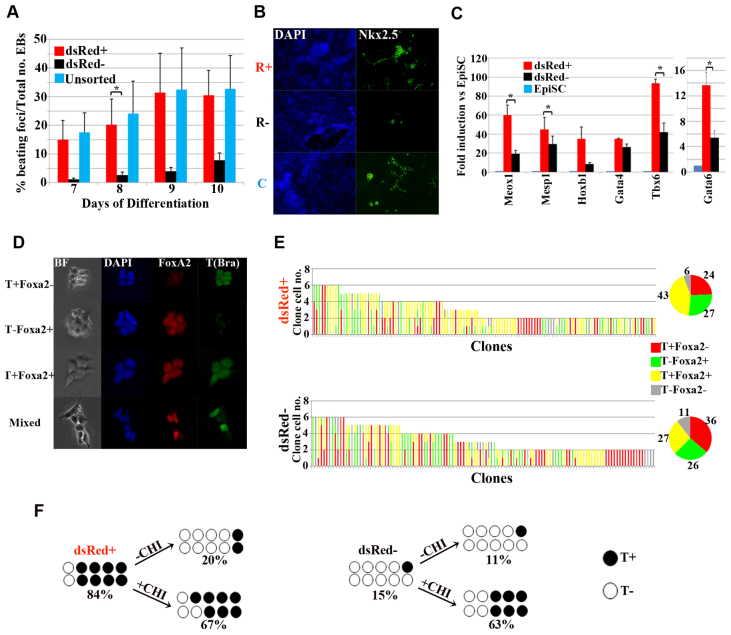
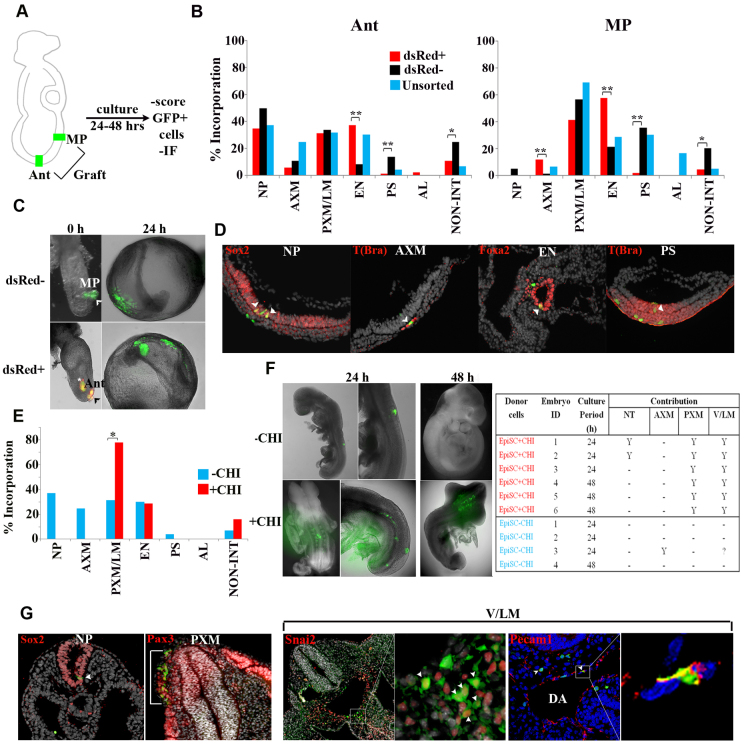
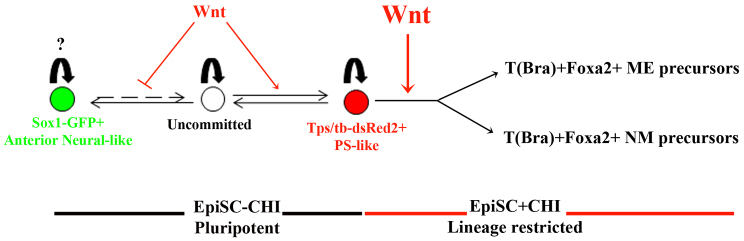
During gastrulation, epiblast cells are pluripotent and their fate is thought to be constrained principally by their position. Cell fate is progressively restricted by localised signalling cues from areas including the primitive streak. However, it is unknown whether this restriction accompanies, at the individual cell level, a reduction in potency. Investigation of these early transition events in vitro is possible via the use of epiblast stem cells (EpiSCs), self-renewing pluripotent cell lines equivalent to the postimplantation epiblast. Strikingly, mouse EpiSCs express gastrulation stage regional markers in self-renewing conditions. Here, we examined the differentiation potential of cells expressing such lineage markers. We show that undifferentiated EpiSC cultures contain a major subfraction of cells with reversible early primitive streak characteristics, which is mutually exclusive to a neural-like fraction. Using in vitro differentiation assays and embryo grafting we demonstrate that primitive streak-like EpiSCs are biased towards mesoderm and endoderm fates while retaining pluripotency. The acquisition of primitive streak characteristics by self-renewing EpiSCs is mediated by endogenous Wnt signalling. Elevation of Wnt activity promotes restriction towards primitive streak-associated lineages with mesendodermal and neuromesodermal characteristics. Collectively, our data suggest that EpiSC pluripotency encompasses a range of reversible lineage-biased states reflecting the birth of pioneer lineage precursors from a pool of uncommitted EpiSCs similar to the earliest cell fate restriction events taking place in the gastrula stage epiblast.
Keywords: Epiblast stem cells; Gastrulation; Heterogeneity; Mouse; Neuromesodermal progenitors; Primitive Streak; Wnt signalling.
Figures
Similar articles
-
The transcriptional and functional properties of mouse epiblast stem cells resemble the anterior primitive streak.Cell Stem Cell. 2014 Jan 2;14(1):107-20. doi: 10.1016/j.stem.2013.09.014. Epub 2013 Oct 17. Cell Stem Cell. 2014. PMID: 24139757
-
ERK inhibition promotes neuroectodermal precursor commitment by blocking self-renewal and primitive streak formation of the epiblast.Stem Cell Res Ther. 2018 Jan 5;9(1):2. doi: 10.1186/s13287-017-0750-8. Stem Cell Res Ther. 2018. PMID: 29304842 Free PMC article.
-
Heterogeneity in Epiblast Stem Cells.Adv Exp Med Biol. 2019;1123:5-17. doi: 10.1007/978-3-030-11096-3_2. Adv Exp Med Biol. 2019. PMID: 31016592 Review.
-
Basal delamination during mouse gastrulation primes pluripotent cells for differentiation.Dev Cell. 2024 May 20;59(10):1252-1268.e13. doi: 10.1016/j.devcel.2024.03.008. Epub 2024 Apr 4. Dev Cell. 2024. PMID: 38579720 Free PMC article.
-
The evolution of amniote gastrulation: the blastopore-primitive streak transition.Wiley Interdiscip Rev Dev Biol. 2017 Mar;6(2). doi: 10.1002/wdev.262. Epub 2017 Feb 8. Wiley Interdiscip Rev Dev Biol. 2017. PMID: 28177589 Review.
Cited by
-
On the road again: Establishment and maintenance of stemness in the neural crest from embryo to adulthood.Stem Cells. 2021 Jan;39(1):7-25. doi: 10.1002/stem.3283. Epub 2020 Nov 4. Stem Cells. 2021. PMID: 33017496 Free PMC article. Review.
-
Human muscle production in vitro from pluripotent stem cells: Basic and clinical applications.Semin Cell Dev Biol. 2021 Nov;119:39-48. doi: 10.1016/j.semcdb.2021.04.017. Epub 2021 Apr 30. Semin Cell Dev Biol. 2021. PMID: 33941447 Free PMC article. Review.
-
Epigenetic control of transcriptional regulation in pluripotency and early differentiation.Development. 2019 Sep 25;146(19):dev164772. doi: 10.1242/dev.164772. Development. 2019. PMID: 31554624 Free PMC article. Review.
-
Generation of stable integration-free pig induced pluripotent stem cells under chemically defined culture condition.Cell Prolif. 2023 Nov;56(11):e13487. doi: 10.1111/cpr.13487. Epub 2023 May 15. Cell Prolif. 2023. PMID: 37190930 Free PMC article.
-
Major transcriptome re-organisation and abrupt changes in signalling, cell cycle and chromatin regulation at neural differentiation in vivo.Development. 2014 Aug;141(16):3266-76. doi: 10.1242/dev.112623. Epub 2014 Jul 25. Development. 2014. PMID: 25063452 Free PMC article.
References
-
- Acampora D., Di Giovannantonio L. G., Simeone A. (2013). Otx2 is an intrinsic determinant of the embryonic stem cell state and is required for transition to a stable epiblast stem cell condition. Development 140, 43–55 - PubMed
-
- Arnold S. J., Robertson E. J. (2009). Making a commitment: cell lineage allocation and axis patterning in the early mouse embryo. Nat. Rev. Mol. Cell Biol. 10, 91–103 - PubMed
-
- Arnold S. J., Stappert J., Bauer A., Kispert A., Herrmann B. G., Kemler R. (2000). Brachyury is a target gene of the Wnt/beta-catenin signaling pathway. Mech. Dev. 91, 249–258 - PubMed
-
- Baldwin H. S., Shen H. M., Yan H. C., DeLisser H. M., Chung A., Mickanin C., Trask T., Kirschbaum N. E., Newman P. J., Albelda S. M., et al. (1994). Platelet endothelial cell adhesion molecule-1 (PECAM-1/CD31): alternatively spliced, functionally distinct isoforms expressed during mammalian cardiovascular development. Development 120, 2539–2553 - PubMed
-
- Beddington S. P. (1981). An autoradiographic analysis of the potency of embryonic ectoderm in the 8th day postimplantation mouse embryo. J. Embryol. Exp. Morphol. 64, 87–104 - PubMed
Publication types
MeSH terms
Grants and funding
LinkOut - more resources
Full Text Sources
Other Literature Sources
Molecular Biology Databases
