

Proinflammatory cytokines differentially regulate adipocyte mitochondrial metabolism, oxidative stress, and dynamics
- PMID: 24595304
- PMCID: PMC4010657
- DOI: 10.1152/ajpendo.00422.2013
Proinflammatory cytokines differentially regulate adipocyte mitochondrial metabolism, oxidative stress, and dynamics
Abstract
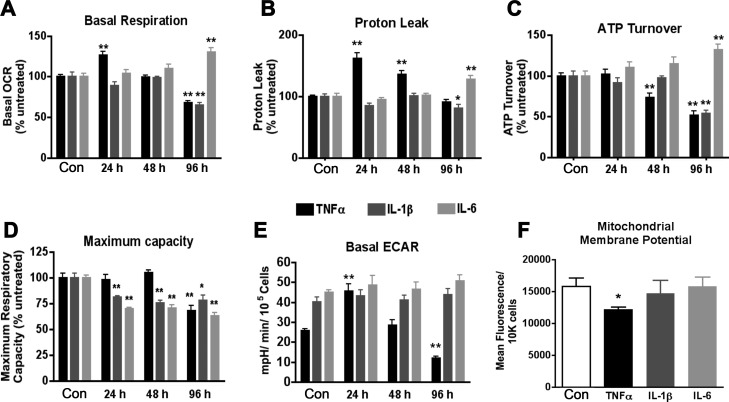
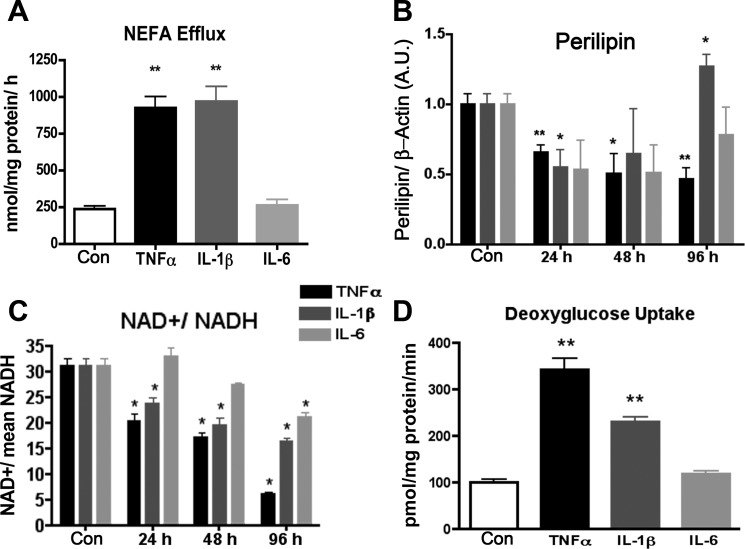
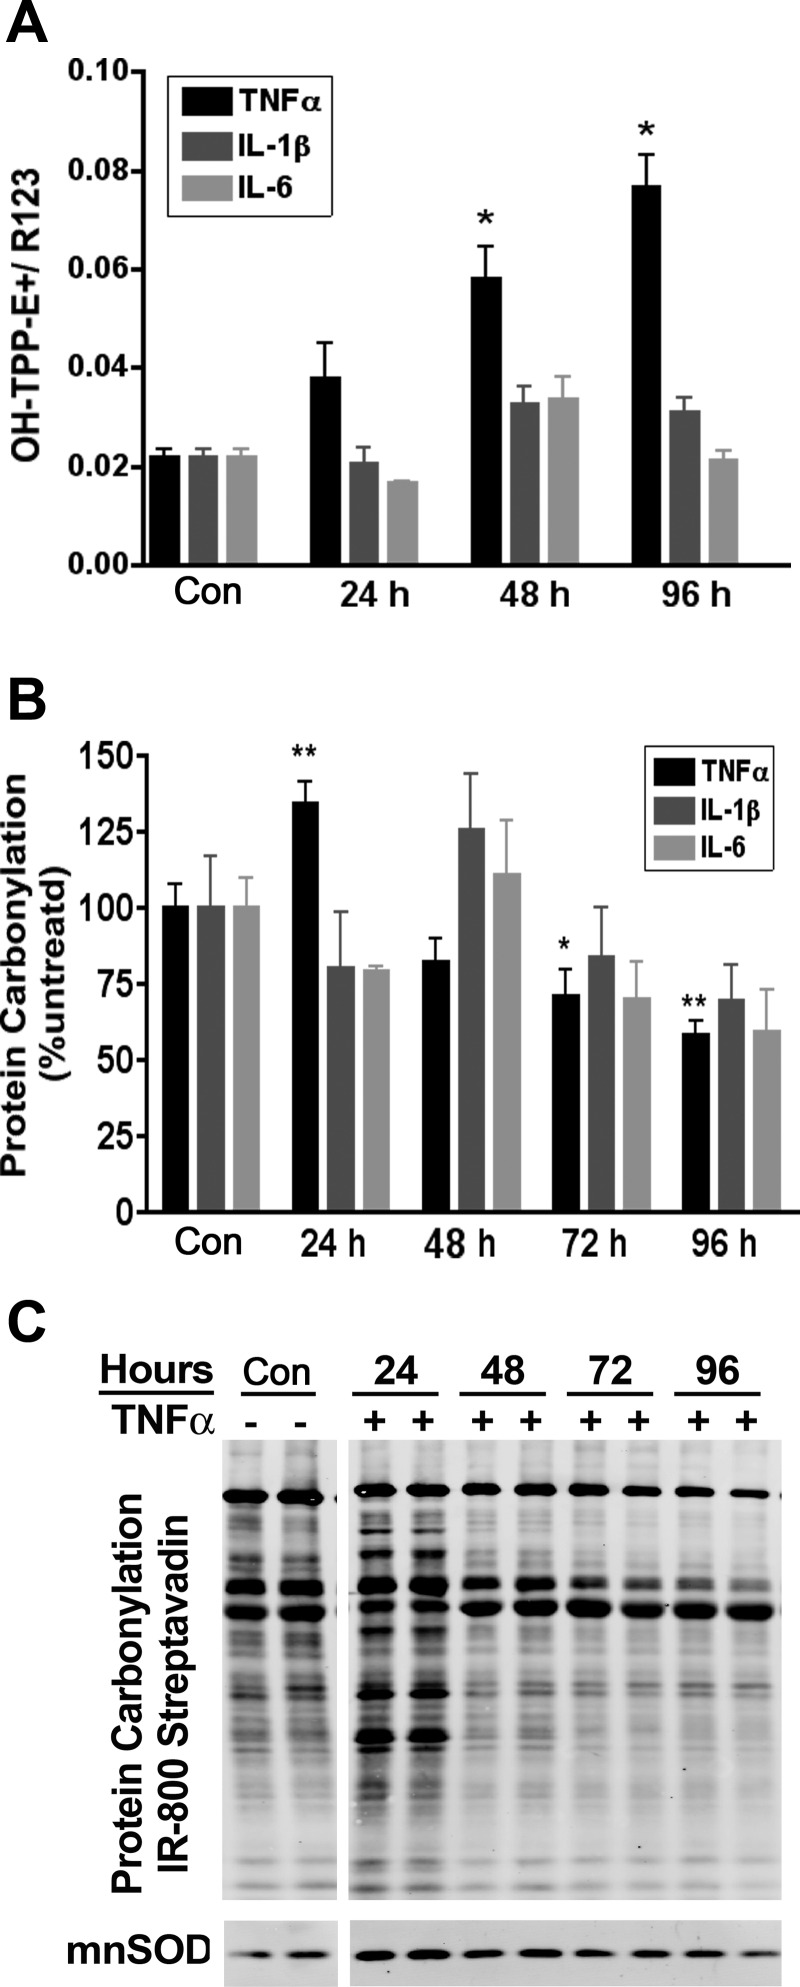
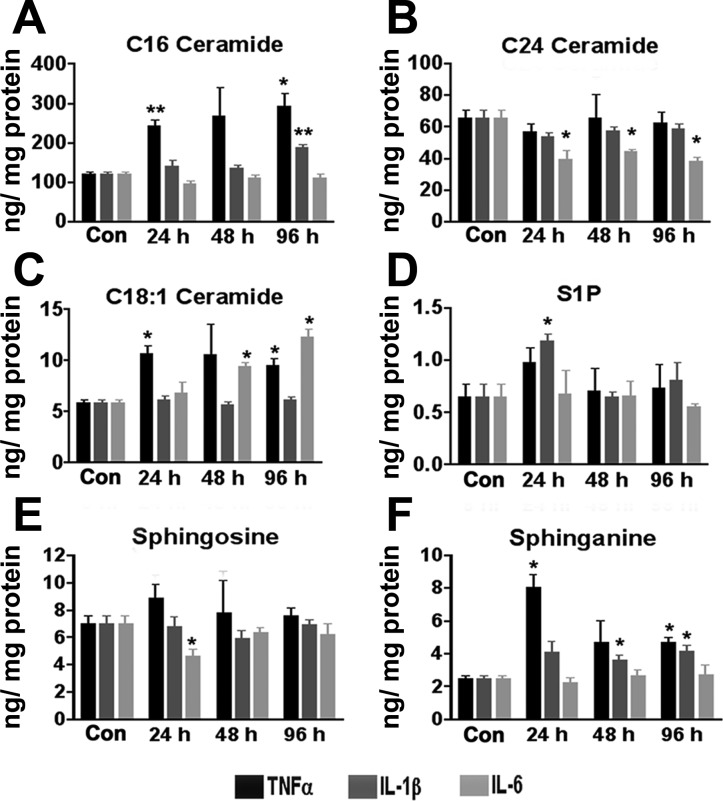
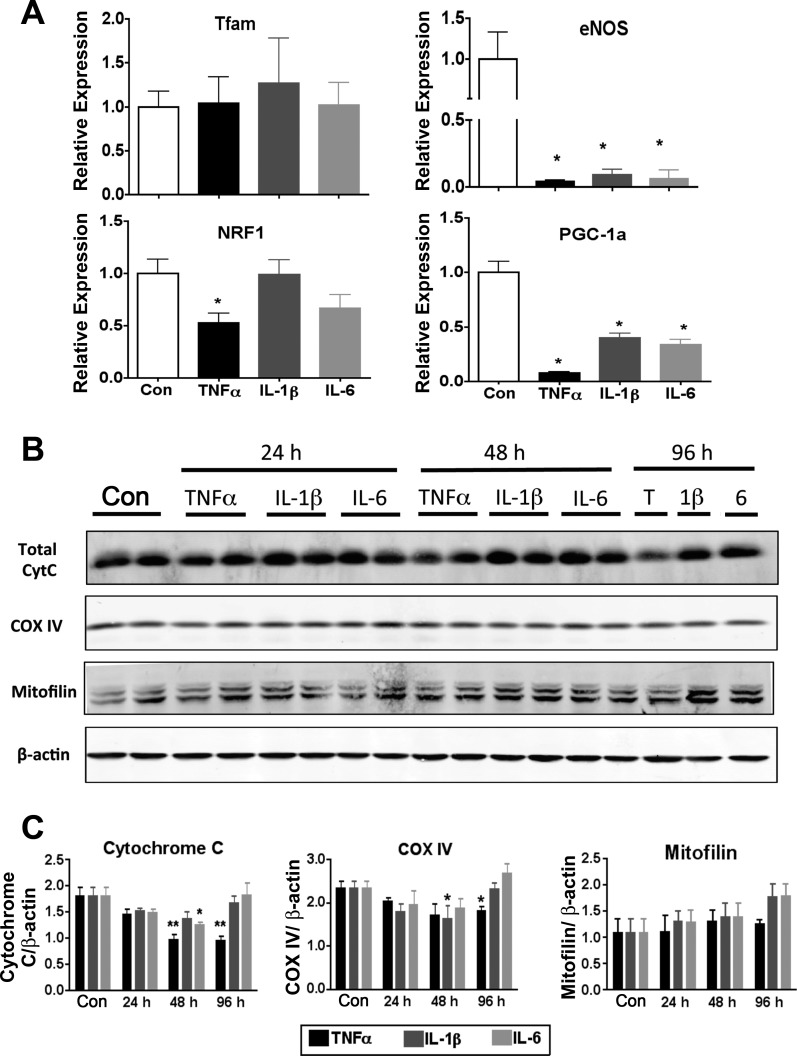
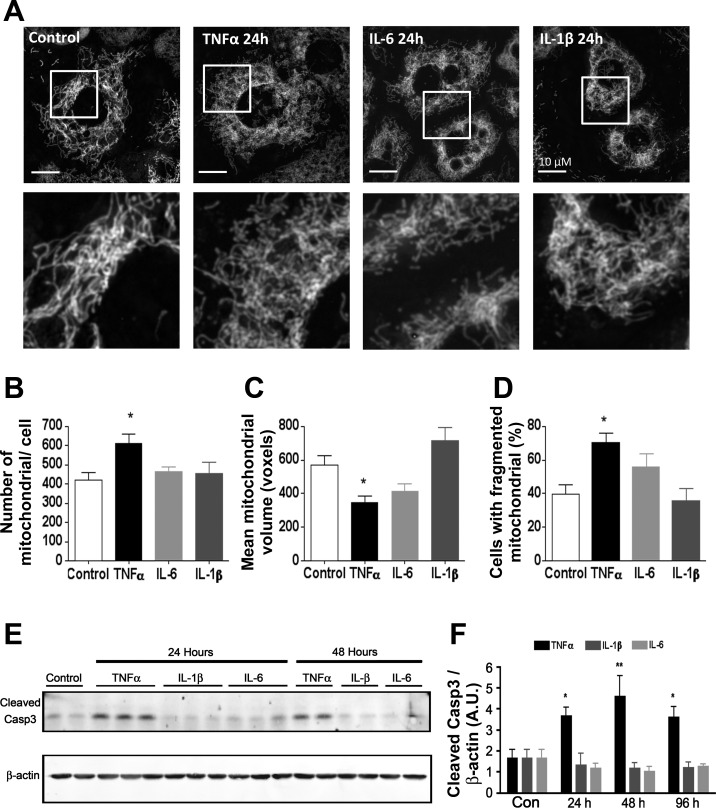
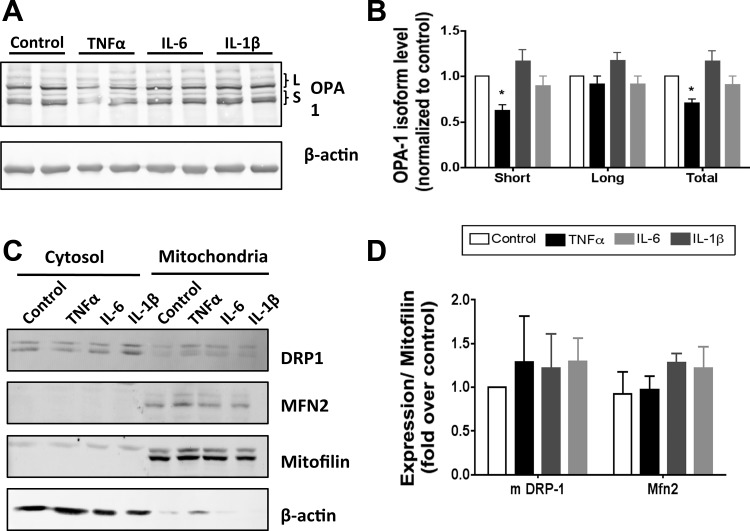
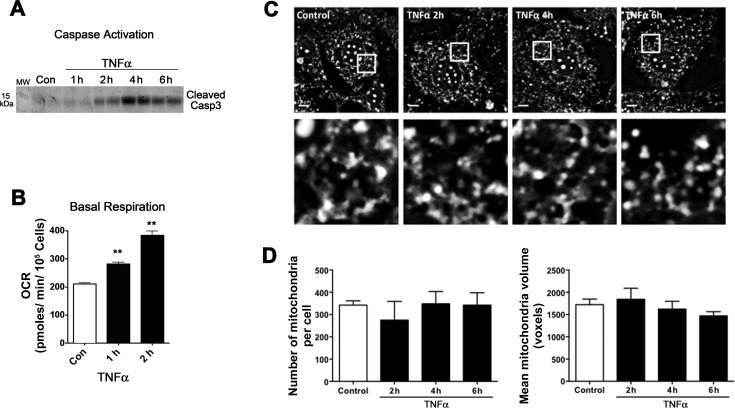
Proinflammatory cytokines differentially regulate adipocyte mitochondrial metabolism, oxidative stress, and dynamics. Macrophage infiltration of adipose tissue and the chronic low-grade production of inflammatory cytokines have been mechanistically linked to the development of insulin resistance, the forerunner of type 2 diabetes mellitus. In this study, we evaluated the chronic effects of TNFα, IL-6, and IL-1β on adipocyte mitochondrial metabolism and morphology using the 3T3-L1 model cell system. TNFα treatment of cultured adipocytes led to significant changes in mitochondrial bioenergetics, including increased proton leak, decreased ΔΨm, increased basal respiration, and decreased ATP turnover. In contrast, although IL-6 and IL-1β decreased maximal respiratory capacity, they had no effect on ΔΨm and varied effects on ATP turnover, proton leak, or basal respiration. Only TNFα treatment of 3T3-L1 cells led to an increase in oxidative stress (as measured by superoxide anion production and protein carbonylation) and C16 ceramide synthesis. Treatment of 3T3-L1 adipocytes with cytokines led to decreased mRNA expression of key transcription factors and control proteins implicated in mitochondrial biogenesis, including PGC-1α and eNOS as well as deceased expression of COX IV and Cyt C. Whereas each cytokine led to effects on expression of mitochondrial markers, TNFα exclusively led to mitochondrial fragmentation and decreased the total level of OPA1 while increasing OPA1 cleavage, without expression of levels of mitofusin 2, DRP-1, or mitofilin being affected. In summary, these results indicate that inflammatory cytokines have unique and specialized effects on adipocyte metabolism, but each leads to decreased mitochondrial function and a reprogramming of fat cell biology.
Keywords: adipocyte; cytokine; fusion; mitochondria; respiration.
Figures
References
-
- Adam-Vizi V. Production of reactive oxygen species in brain mitochondria: contribution by electron transport chain and non-electron transport chain sources. Antioxid Redox Signal 7: 1140–1149, 2005 - PubMed
-
- Baricault L, Ségui B, Guégand L, Olichon A, Valette A, Larminat F, Lenaers G. OPA1 cleavage depends on decreased mitochondrial ATP level and bivalent metals. Exp Cell Res 313: 3800–3808, 2007 - PubMed
Publication types
MeSH terms
Substances
Grants and funding
LinkOut - more resources
Full Text Sources
Other Literature Sources
Molecular Biology Databases
Miscellaneous