

Low-rank modeling of local k-space neighborhoods (LORAKS) for constrained MRI
- PMID: 24595341
- PMCID: PMC4122573
- DOI: 10.1109/TMI.2013.2293974
Low-rank modeling of local k-space neighborhoods (LORAKS) for constrained MRI
Abstract
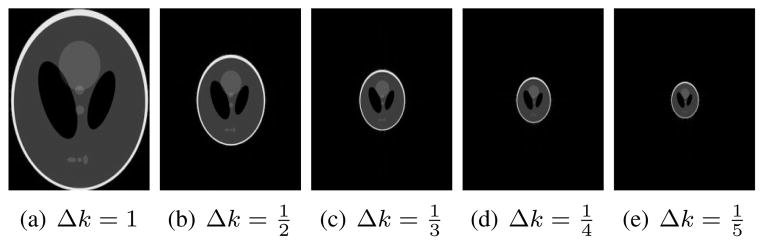
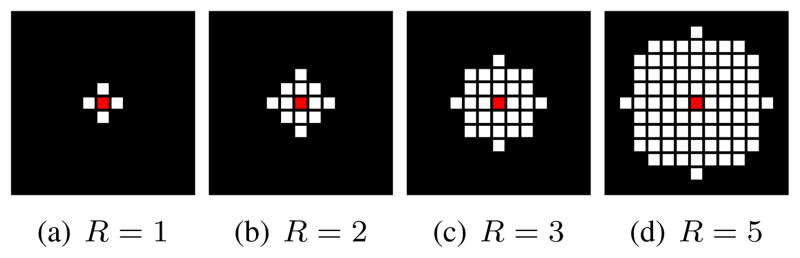
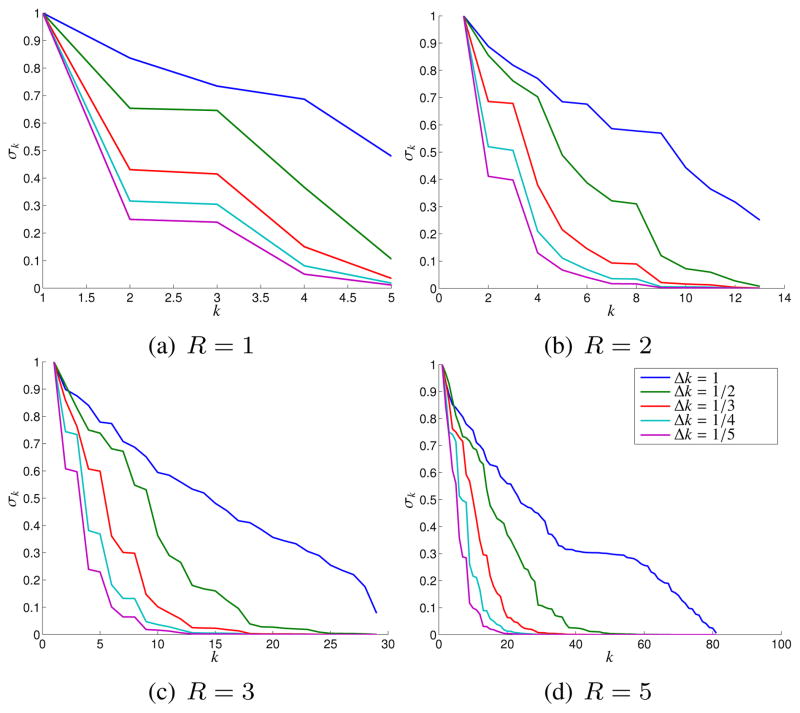
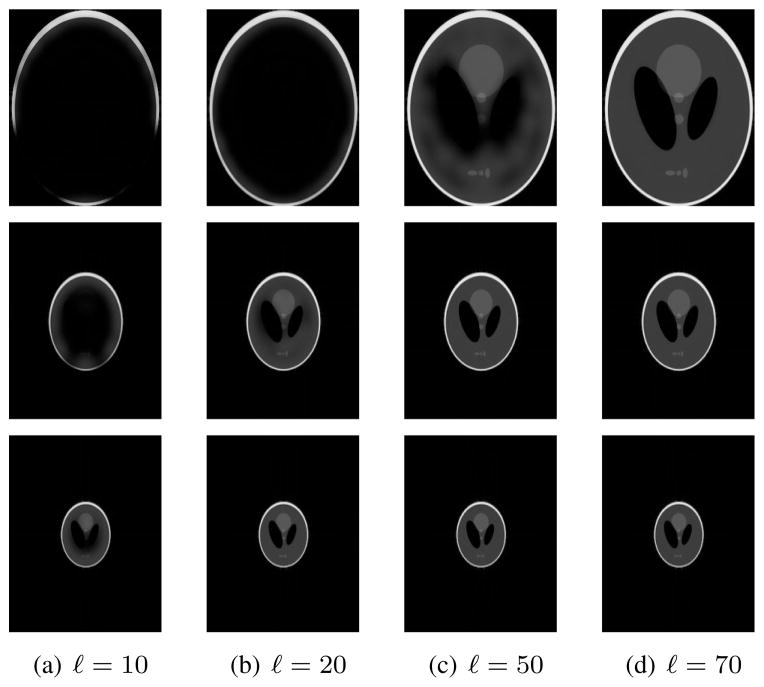
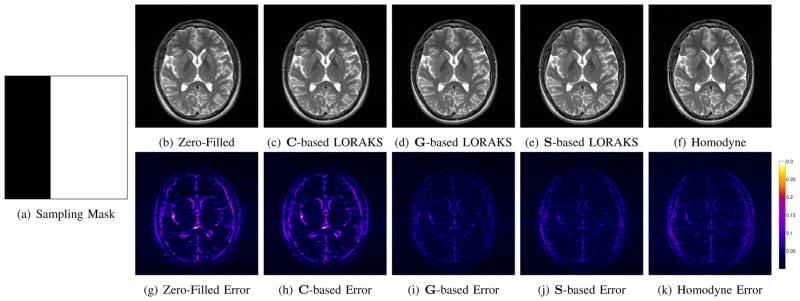
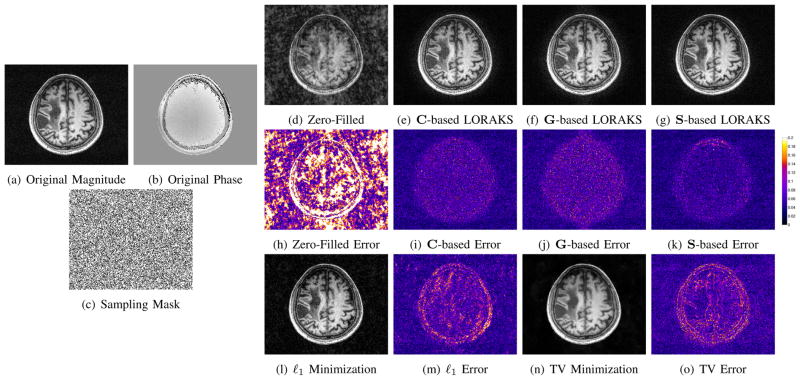
Recent theoretical results on low-rank matrix reconstruction have inspired significant interest in low-rank modeling of MRI images. Existing approaches have focused on higher-dimensional scenarios with data available from multiple channels, timepoints, or image contrasts. The present work demonstrates that single-channel, single-contrast, single-timepoint k-space data can also be mapped to low-rank matrices when the image has limited spatial support or slowly varying phase. Based on this, we develop a novel and flexible framework for constrained image reconstruction that uses low-rank matrix modeling of local k-space neighborhoods (LORAKS). A new regularization penalty and corresponding algorithm for promoting low-rank are also introduced. The potential of LORAKS is demonstrated with simulated and experimental data for a range of denoising and sparse-sampling applications. LORAKS is also compared against state-of-the-art methods like homodyne reconstruction, l1-norm minimization, and total variation minimization, and is demonstrated to have distinct features and advantages. In addition, while calibration-based support and phase constraints are commonly used in existing methods, the LORAKS framework enables calibrationless use of these constraints.
Figures
Similar articles
-
P-LORAKS: Low-rank modeling of local k-space neighborhoods with parallel imaging data.Magn Reson Med. 2016 Apr;75(4):1499-514. doi: 10.1002/mrm.25717. Epub 2015 May 7. Magn Reson Med. 2016. PMID: 25952136 Free PMC article.
-
LORAKS makes better SENSE: Phase-constrained partial fourier SENSE reconstruction without phase calibration.Magn Reson Med. 2017 Mar;77(3):1021-1035. doi: 10.1002/mrm.26182. Epub 2016 Apr 1. Magn Reson Med. 2017. PMID: 27037836 Free PMC article.
-
Wave-LORAKS: Combining wave encoding with structured low-rank matrix modeling for more highly accelerated 3D imaging.Magn Reson Med. 2019 Mar;81(3):1620-1633. doi: 10.1002/mrm.27511. Epub 2018 Sep 25. Magn Reson Med. 2019. PMID: 30252157 Free PMC article.
-
Joint calibrationless reconstruction of highly undersampled multicontrast MR datasets using a low-rank Hankel tensor completion framework.Magn Reson Med. 2021 Jun;85(6):3256-3271. doi: 10.1002/mrm.28674. Epub 2021 Feb 3. Magn Reson Med. 2021. PMID: 33533092
-
Comparison of phase-constrained parallel MRI approaches: Analogies and differences.Magn Reson Med. 2016 Mar;75(3):1086-99. doi: 10.1002/mrm.25685. Epub 2015 Apr 4. Magn Reson Med. 2016. PMID: 25845973 Review.
Cited by
-
A majorize-minimize framework for Rician and non-central chi MR images.IEEE Trans Med Imaging. 2015 Oct;34(10):2191-202. doi: 10.1109/TMI.2015.2427157. Epub 2015 Apr 28. IEEE Trans Med Imaging. 2015. PMID: 25935028 Free PMC article.
-
Deep Generalization of Structured Low-Rank Algorithms (Deep-SLR).IEEE Trans Med Imaging. 2020 Dec;39(12):4186-4197. doi: 10.1109/TMI.2020.3014581. Epub 2020 Nov 30. IEEE Trans Med Imaging. 2020. PMID: 32755854 Free PMC article.
-
Improving robustness of 3D multi-shot EPI by structured low-rank reconstruction of segmented CAIPI sampling for fMRI at 7T.Neuroimage. 2023 Feb 15;267:119827. doi: 10.1016/j.neuroimage.2022.119827. Epub 2022 Dec 23. Neuroimage. 2023. PMID: 36572131 Free PMC article.
-
Reduced-field of view three-dimensional MR acoustic radiation force imaging with a low-rank reconstruction for targeting transcranial focused ultrasound.Magn Reson Med. 2022 Dec;88(6):2419-2431. doi: 10.1002/mrm.29403. Epub 2022 Aug 2. Magn Reson Med. 2022. PMID: 35916311 Free PMC article.
-
Simultaneous auto-calibration and gradient delays estimation (SAGE) in non-Cartesian parallel MRI using low-rank constraints.Magn Reson Med. 2018 Nov;80(5):2006-2016. doi: 10.1002/mrm.27168. Epub 2018 Mar 9. Magn Reson Med. 2018. PMID: 29524244 Free PMC article.
References
-
- Liang ZP, Boada F, Constable T, Haacke EM, Lauterbur PC, Smith MR. Constrained reconstruction methods in MR imaging. Rev Magn Reson Med. 1992;4:67–185.
-
- Haldar JP. PhD dissertation. University of Illinois; Urbana-Champaign, Urbana, IL, USA: 2011. Constrained imaging: Denoising and sparse sampling. [Online]. Available: http://hdl.handle.net/2142/24286.
-
- Griswold MA, Jakob PM, Heidemann RM, Nittka M, Jellus V, Wang J, Kiefer B, Haase A. Generalized autocalibrating partially parallel acquisitions (GRAPPA) Magn Reson Med. 2002;47:1202–1210. - PubMed
Publication types
MeSH terms
Grants and funding
LinkOut - more resources
Full Text Sources
Other Literature Sources
Medical
