

Relaxed functional constraints on triplicate α-globin gene in the bank vole suggest a different evolutionary history from other rodents
- PMID: 24595364
- PMCID: PMC4815648
- DOI: 10.1038/hdy.2014.12
Relaxed functional constraints on triplicate α-globin gene in the bank vole suggest a different evolutionary history from other rodents
Abstract
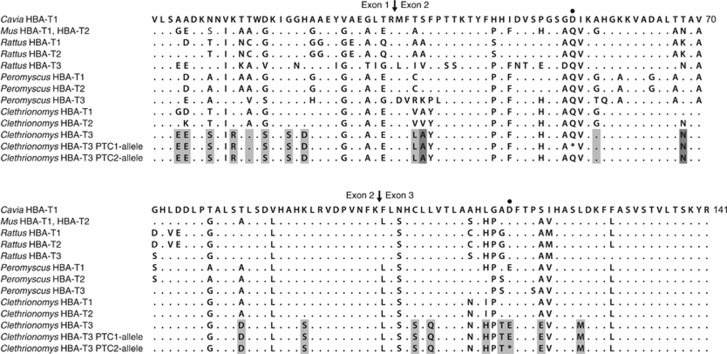
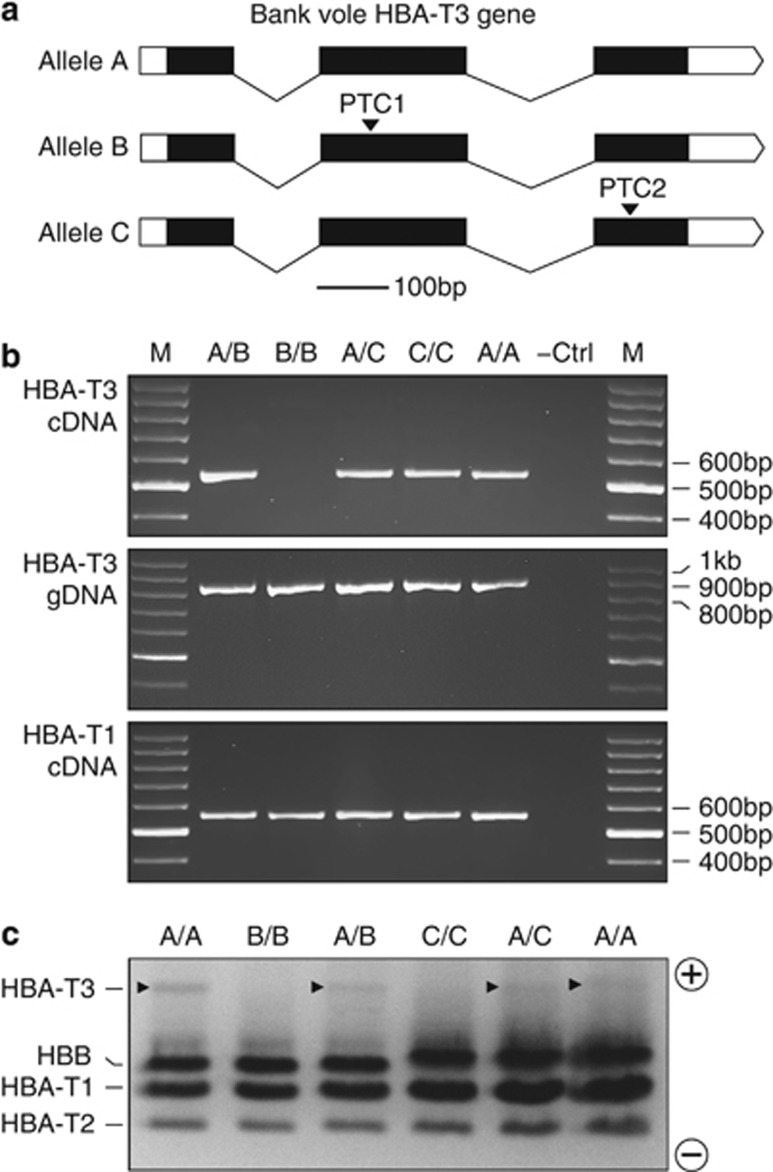
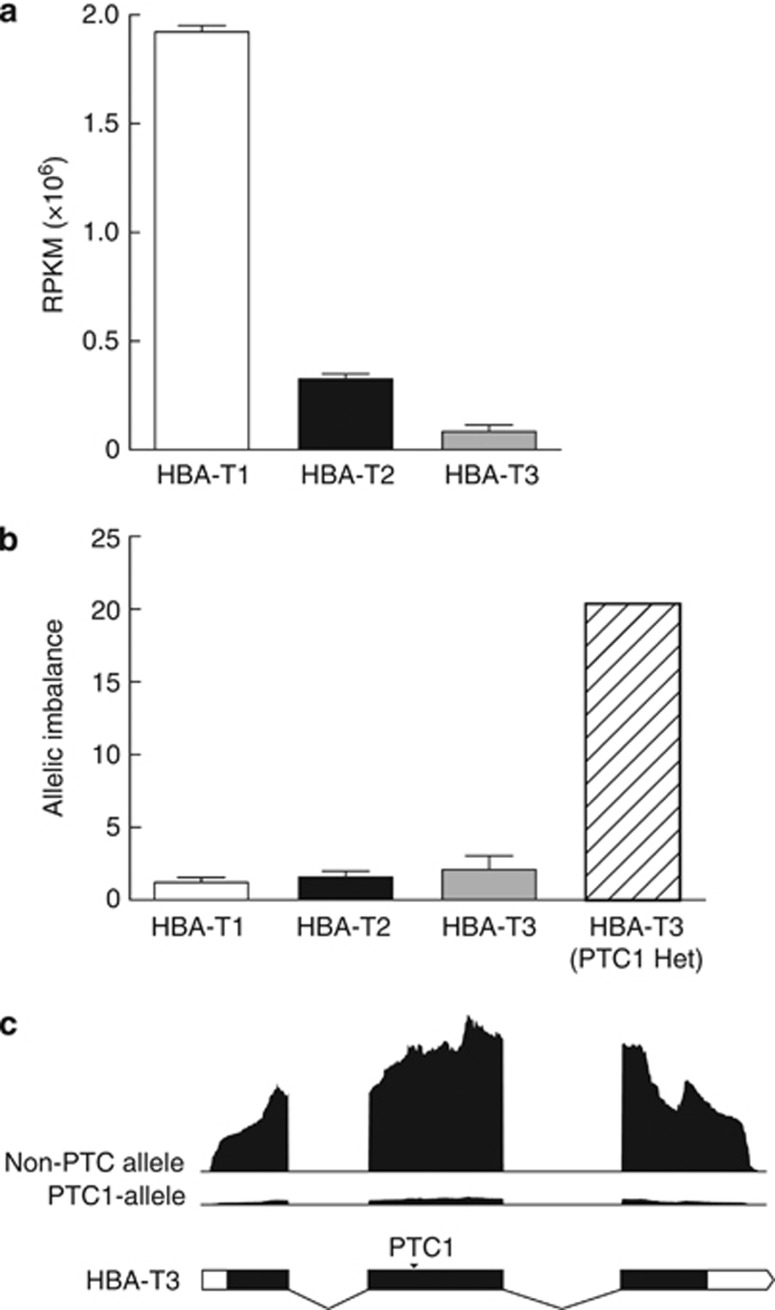
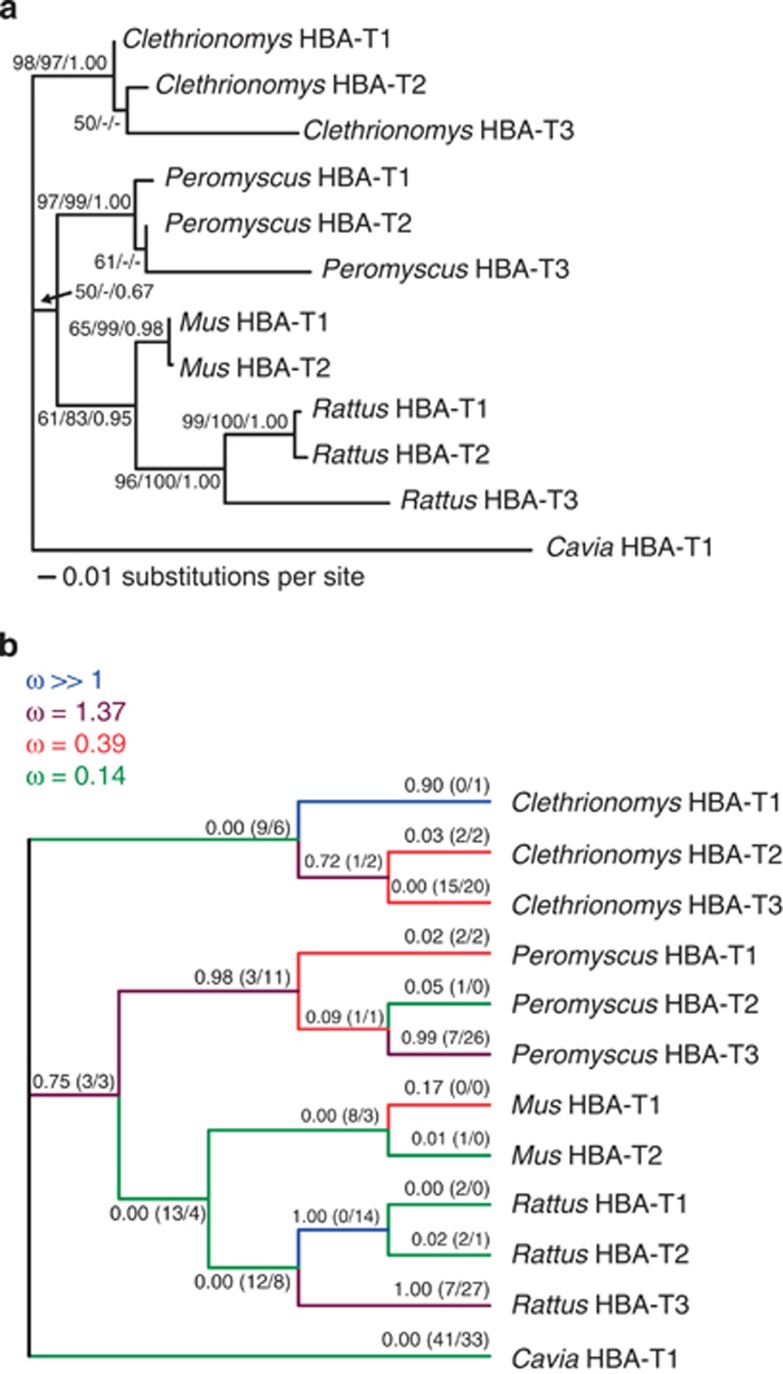
Gene duplication plays an important role in the origin of evolutionary novelties, but the mechanisms responsible for the retention and functional divergence of the duplicated copy are not fully understood. The α-globin genes provide an example of a gene family with different numbers of gene duplicates among rodents. Whereas Rattus and Peromyscus each have three adult α-globin genes (HBA-T1, HBA-T2 and HBA-T3), Mus has only two copies. High rates of amino acid evolution in the independently derived HBA-T3 genes of Peromyscus and Rattus have been attributed to positive selection. Using RACE PCR, reverse transcription-PCR (RT-PCR) and RNA-seq, we show that another rodent, the bank vole Clethrionomys glareolus, possesses three transcriptionally active α-globin genes. The bank vole HBA-T3 gene is distinguished from each HBA-T1 and HBA-T2 by 20 amino acids and is transcribed 23- and 4-fold lower than HBA-T1 and HBA-T2, respectively. Polypeptides corresponding to all three genes are detected by electrophoresis, demonstrating that the translated products of HBA-T3 are present in adult erythrocytes. Patterns of codon substitution and the presence of low-frequency null alleles suggest a postduplication relaxation of purifying selection on bank vole HBA-T3.
Figures
Similar articles
-
Adaptive functional divergence among triplicated alpha-globin genes in rodents.Genetics. 2008 Mar;178(3):1623-38. doi: 10.1534/genetics.107.080903. Epub 2008 Feb 3. Genetics. 2008. PMID: 18245844 Free PMC article.
-
Evolution of duplicated beta-globin genes and the structural basis of hemoglobin isoform differentiation in Mus.Mol Biol Evol. 2009 Nov;26(11):2521-32. doi: 10.1093/molbev/msp165. Epub 2009 Aug 12. Mol Biol Evol. 2009. PMID: 19675095 Free PMC article.
-
Mitogenomic phylogenetics of the bank vole Clethrionomys glareolus, a model system for studying end-glacial colonization of Europe.Mol Phylogenet Evol. 2015 Jan;82 Pt A:245-57. doi: 10.1016/j.ympev.2014.10.016. Epub 2014 Oct 30. Mol Phylogenet Evol. 2015. PMID: 25450101
-
Genomic organization and differential signature of positive selection in the alpha and beta globin gene clusters in two cetacean species.Genome Biol Evol. 2013;5(12):2359-67. doi: 10.1093/gbe/evt176. Genome Biol Evol. 2013. PMID: 24259315 Free PMC article.
-
Repositioning-dependent fate of duplicate genes.DNA Cell Biol. 2005 Sep;24(9):529-42. doi: 10.1089/dna.2005.24.529. DNA Cell Biol. 2005. PMID: 16153154 Review.
Cited by
-
De novo transcriptome assembly facilitates characterisation of fast-evolving gene families, MHC class I in the bank vole (Myodes glareolus).Heredity (Edinb). 2017 Apr;118(4):348-357. doi: 10.1038/hdy.2016.105. Epub 2016 Oct 26. Heredity (Edinb). 2017. PMID: 27782121 Free PMC article.
-
Mapping 3' transcript ends in the bank vole (Clethrionomys glareolus) mitochondrial genome with RNA-Seq.BMC Genomics. 2015 Oct 26;16:870. doi: 10.1186/s12864-015-2103-2. BMC Genomics. 2015. PMID: 26503603 Free PMC article.
-
Genomics of end-Pleistocene population replacement in a small mammal.Proc Biol Sci. 2018 Feb 14;285(1872):20172624. doi: 10.1098/rspb.2017.2624. Proc Biol Sci. 2018. PMID: 29436497 Free PMC article.
-
Relaxed selective constraints drove functional modifications in peripheral photoreception of the cavefish P. andruzzii and provide insight into the time of cave colonization.Heredity (Edinb). 2016 Nov;117(5):383-392. doi: 10.1038/hdy.2016.59. Epub 2016 Aug 3. Heredity (Edinb). 2016. PMID: 27485669 Free PMC article.
-
Adaptive phylogeography: functional divergence between haemoglobins derived from different glacial refugia in the bank vole.Proc Biol Sci. 2014 Jul 7;281(1786):20140021. doi: 10.1098/rspb.2014.0021. Proc Biol Sci. 2014. PMID: 24827438 Free PMC article.
References
-
- Altschul SF, Gish W, Miller W, Myers EW, Lipman DJ. (1990). Basic local alignment search tool. J Mol Biol 215: 403–410. - PubMed
-
- Arnold K, Bordoli L, Kopp J, Schwede T. (2006). The SWISS-MODEL Workspace: a web-based environment for protein structure homology modelling. Bioinformatics 22: 195–201. - PubMed
-
- Baker KE, Parker R. (2004). Nonsense-mediated mRNA decay: terminating erroneous gene expression. Curr Opin Cell Biol 16: 293. - PubMed
-
- Betrán E, Long M. (2002). Expansion of genome coding regions by acquisition of new genes. Genetica 115: 65–80. - PubMed
Publication types
MeSH terms
Substances
Associated data
- Actions
- Actions
- Actions
- Actions
- Actions
- Actions
- Actions
- Actions
- Actions
- Actions
- Actions
LinkOut - more resources
Full Text Sources
Other Literature Sources
Miscellaneous
