

Hypoperfusion intensity ratio predicts infarct progression and functional outcome in the DEFUSE 2 Cohort
- PMID: 24595591
- PMCID: PMC4047639
- DOI: 10.1161/STROKEAHA.113.003857
Hypoperfusion intensity ratio predicts infarct progression and functional outcome in the DEFUSE 2 Cohort
Erratum in
- Stroke. 2014 May;45(5):e92
Abstract
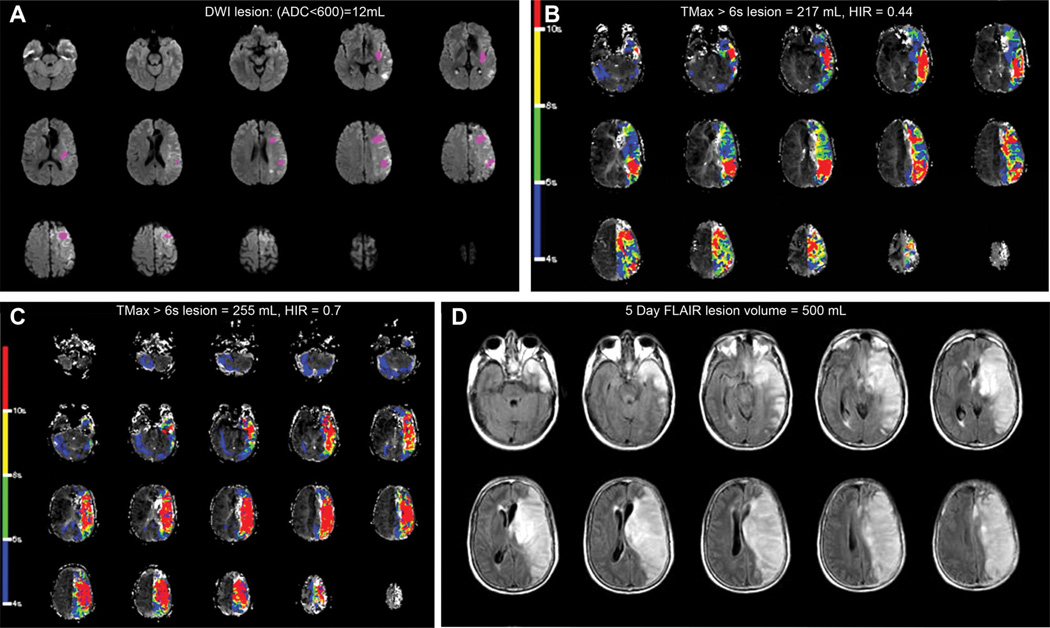
Background and purpose: We evaluate associations between the severity of magnetic resonance perfusion-weighted imaging abnormalities, as assessed by the hypoperfusion intensity ratio (HIR), on infarct progression and functional outcome in the Diffusion and Perfusion Imaging Evaluation for Understanding Stroke Evolution Study 2 (DEFUSE 2).
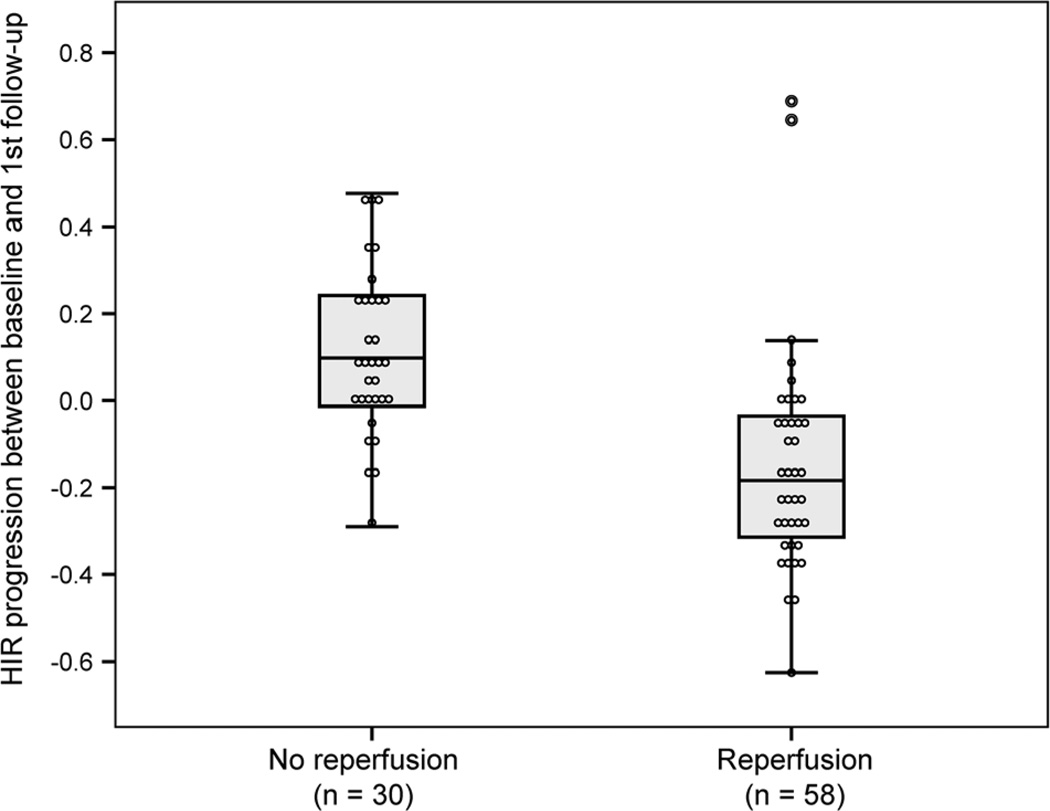
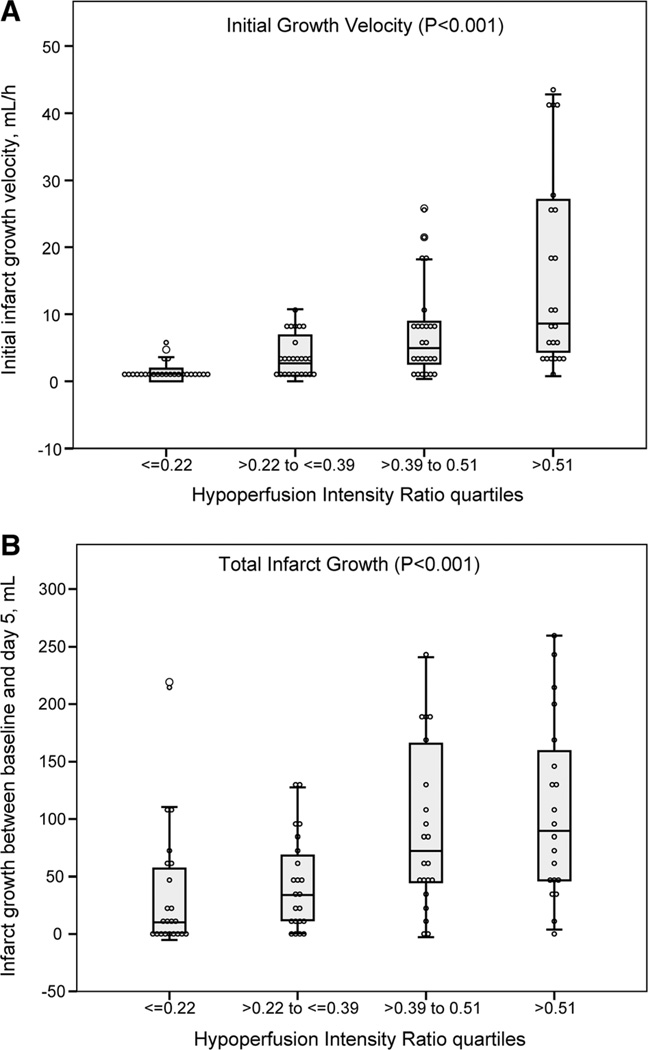
Methods: Diffusion-weighted magnetic resonance imaging and perfusion-weighted imaging lesion volumes were determined with the RAPID software program. HIR was defined as the proportion of TMax >6 s lesion volume with a Tmax >10 s delay and was dichotomized based on its median value (0.4) into low versus high subgroups as well as quartiles. Final infarct volumes were assessed at day 5. Initial infarct growth velocity was calculated as the baseline diffusion-weighted imaging (DWI) lesion volume divided by the delay from symptom onset to baseline magnetic resonance imaging. Total Infarct growth was determined by the difference between final infarct and baseline DWI volumes. Collateral flow was assessed on conventional angiography and dichotomized into good and poor flow. Good functional outcome was defined as modified Rankin Scale ≤2 at 90 days.
Results: Ninety-nine patients were included; baseline DWI, perfusion-weighted imaging, and final infarct volumes increased with HIR quartiles (P<0.01). A high HIR predicted poor collaterals with an area under the curve of 0.73. Initial infarct growth velocity and total infarct growth were greater among patients with a high HIR (P<0.001). After adjustment for age, DWI volume, and reperfusion, a low HIR was associated with good functional outcome: odds ratio=4.4 (95% CI, 1.3-14.3); P=0.014.
Conclusions: HIR can be easily assessed on automatically processed perfusion maps and predicts the rate of collateral flow, infarct growth, and clinical outcome.
Keywords: brain infarction; magnetic resonance imaging; perfusion imaging.
Conflict of interest statement
Dr Albers has equity interest in iSchemaView and has worked as a consultant for Covidien, Codman, and Stryker. Dr Bammer has equity interest in iSchemaView. Dr Zaharchuk receives modest research funding support from GE Healthcare. The other authors report no conflicts.
Figures
References
-
- Hossmann KA. Viability thresholds and the penumbra of focal ischemia. Ann Neurol. 1994;36:557–565. - PubMed
-
- Calamante F, Christensen S, Desmond PM, Ostergaard L, Davis SM, Connelly A. The physiological significance of the time-to-maximum (Tmax) parameter in perfusion MRI. Stroke. 2010;41:1169–1174. - PubMed
-
- Takasawa M, Jones PS, Guadagno JV, Christensen S, Fryer TD, Harding S, et al. How reliable is perfusion MR in acute stroke? Validation and determination of the penumbra threshold against quantitative PET. Stroke. 2008;39:870–877. - PubMed
Publication types
MeSH terms
Substances
Grants and funding
LinkOut - more resources
Full Text Sources
Other Literature Sources
Medical
