. 2014 May;27(5):578-93.
doi: 10.1002/nbm.3097. Epub 2014 Mar 5.

Characterization of metabolites in infiltrating gliomas using ex vivo ¹H high-resolution magic angle spinning spectroscopy

Affiliations
Free PMC article

Characterization of metabolites in infiltrating gliomas using ex vivo ¹H high-resolution magic angle spinning spectroscopy

Adam Elkhaled et al. NMR Biomed. 2014 May.
Free PMC article

Abstract

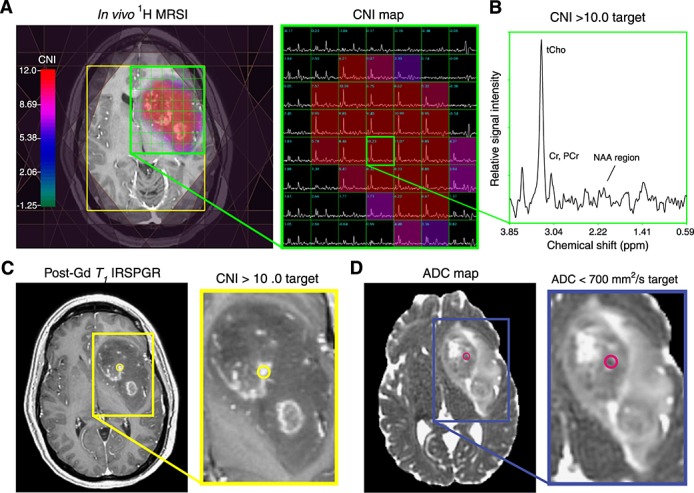
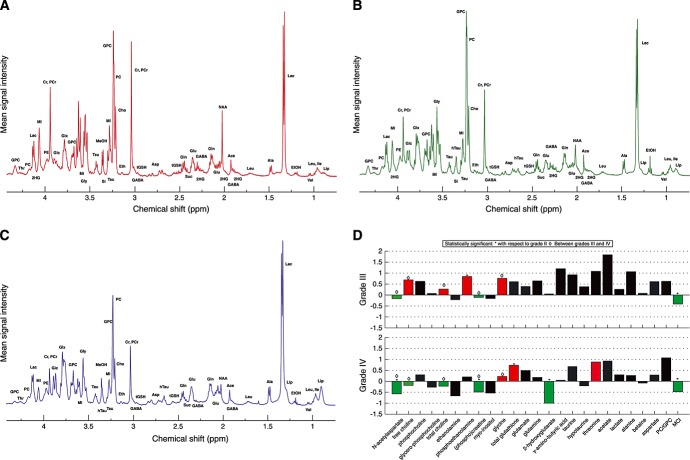
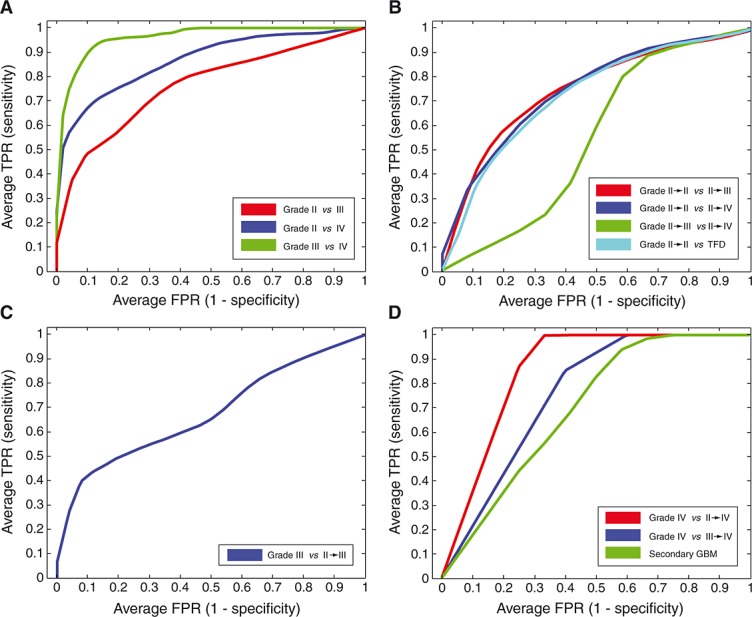
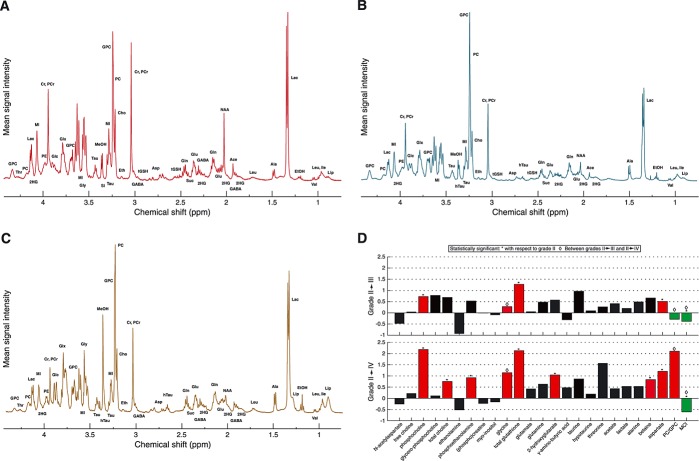
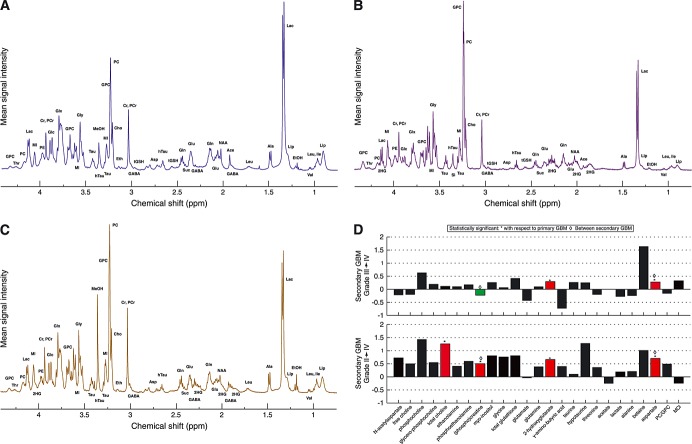
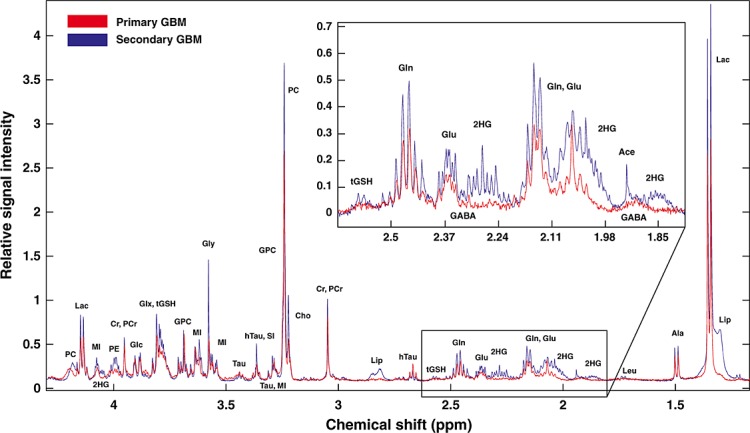
Gliomas are routinely graded according to histopathological criteria established by the World Health Organization. Although this classification can be used to understand some of the variance in the clinical outcome of patients, there is still substantial heterogeneity within and between lesions of the same grade. This study evaluated image-guided tissue samples acquired from a large cohort of patients presenting with either new or recurrent gliomas of grades II-IV using ex vivo proton high-resolution magic angle spinning spectroscopy. The quantification of metabolite levels revealed several discrete profiles associated with primary glioma subtypes, as well as secondary subtypes that had undergone transformation to a higher grade at the time of recurrence. Statistical modeling further demonstrated that these metabolomic profiles could be differentially classified with respect to pathological grading and inter-grade conversions. Importantly, the myo-inositol to total choline index allowed for a separation of recurrent low-grade gliomas on different pathological trajectories, the heightened ratio of phosphocholine to glycerophosphocholine uniformly characterized several forms of glioblastoma multiforme, and the onco-metabolite D-2-hydroxyglutarate was shown to help distinguish secondary from primary grade IV glioma, as well as grade II and III from grade IV glioma. These data provide evidence that metabolite levels are of interest in the assessment of both intra-grade and intra-lesional malignancy. Such information could be used to enhance the diagnostic specificity of in vivo spectroscopy and to aid in the selection of the most appropriate therapy for individual patients.

Keywords: 1H HR-MAS spectroscopy; 2-hydroxyglutarate; glioma; image-guided biopsy; malignant transformation; metabolite profiling.


Figures

Figure 1
Figure 1
Planning of image- and MRSI-guided tissue sampling. In vivo 1H MRS of a patient diagnosed with glioblastoma multiforme. Point-resolved spectroscopic selection (PRESS) coverage defined by yellow box; outer volume suppression (OVS) of lipid shown on periphery; map of the choline to N-acetylaspartate (NAA) index (CNI) is overlaid on a T1-weighted inversion recovery spoiled-gradient echo (IRSPGR) post-Gd image. The corresponding subsets of spectra covering the lesion are shown on the right with CNI values; voxel highlighted in green is designated as a putative tumor region on the basis of elevated CNI within the contrast-enhancing lesion (A). The spectrum from the voxel highlighted in green is enhanced to show the relative metabolite levels contributing to the CNI (B). A 5-mm-diameter target planned for surgical navigation based on this elevated CNI is shown on the T1-weighted post-contrast image (C). An adjacent target based on restricted diffusion is shown on an apparent diffusion coefficient (ADC) map as a regional hypointensity (D). Cr, creatine; GPC, glycerophosphocholine; PC, phosphocholine; PCr, phosphocreatine; tCho, total choline ([Cho] + [PC] + [GPC]).
Figure 2
Figure 2
Metabolite profiles of primary glioma. Mean Carr–Purcell–Meiboom–Gill (CPMG) spectra for glioma samples histologically defined as grade II (n = 43) (A), grade III (n = 25) (B) and grade IV glioblastoma multiforme (GBM) (n = 114) (C). Deviation in quantified mean metabolite levels of grade II and IV glioma relative to grade II glioma; reported levels are unitless owing to the T2 dependence of the CPMG acquisition (D). Significant increases or decreases in the metabolite levels displayed as residuals are highlighted in red and green, respectively. Significance was defined as p < 0.05 for the comparative analysis among subtypes using the proportional odds logistic regression analysis. MeOH and EtOH are contaminants resulting from surgical sterilization procedures. 2HG, d-2-hydroxyglutarate; Ace, acetate; Ala, alanine; Asp, aspartate; Bet, betaine; Cho, free choline; Cr, PCr, creatine, phosphocreatine; Eth, ethanolamine; EtOH, ethanol; GABA, γ-aminobutyric acid; Glc, glucose; Gln, glutamine; Glu, glutamate; Gly, glycine; GPC, glycerophosphocholine; GSH, glutathione; GSSG, glutathione disulfide; hTau, hypotaurine; Ile, isoleucine; Lac, lactate; Leu, leucine; Lip, lipid; Lys, lysine; MCI, myo-inositol to total choline index; MeOH, methanol; MI, myo-inositol; NAA, N-acetylaspartate; PC, phosphocholine; PE, phosphoethanolamine; SI, scyllo-inositol; Suc, succinate; Tau, taurine; tCho, total choline ([Cho] + [PC] + [GPC]); tGSH, total glutathione ([GSH] + [GSSG]); Thr, threonine; Val, valine.
Figure 3
Figure 3
Average receiver operating characteristic (ROC) curves for the logistic ridge regression classification models shown in Table 3: primary glioma (A), recurrent low-grade glioma transformation status (B), primary versus secondary grade III (C), and primary versus secondary glioblastoma multiforme (GBM) (D). The averaged curves represent the results of 100 training sets per classification model. FPR, false positive rate; TFD, transformed to a higher grade of malignancy; TPR, true positive rate.
Figure 4
Figure 4
Metabolite profiles of recurrent low-grade glioma. Mean Carr–Purcell–Meiboom–Gill (CPMG) spectra for glioma samples histologically defined according to malignant transformation status as grade II → II (n = 43) (A), grade II → III (n = 52) (B) and grade II → IV (n = 19) (C). Deviation in quantified mean metabolite levels of grade II → III and II → IV glioma relative to grade II → II glioma; reported levels are unitless owing to the T2 dependence of the CPMG acquisition (D). Significant increases or decreases in the metabolite levels displayed as residuals are highlighted in red and green, respectively. Statistical significance was defined as p < 0.05 for the comparative analysis among subtypes using the proportional odds logistic regression analysis. MeOH and EtOH are contaminants resulting from surgical sterilization procedures. 2HG, d-2-hydroxyglutarate; Ace, acetate; Ala, alanine; Asp, aspartate; Bet, betaine; Cho, free choline; Cr, PCr, creatine, phosphocreatine; Eth, ethanolamine; EtOH, ethanol; GABA, γ-aminobutyric acid; Glc, glucose; Gln, glutamine; Glu, glutamate; Gly, glycine; GPC, glycerophosphocholine; GSH, glutathione; GSSG, glutathione disulfide; hTau, hypotaurine; Ile, isoleucine; Lac, lactate; Leu, leucine; Lip, lipid; Lys, lysine; MCI, myo-inositol to total choline index; MeOH, methanol; MI, myo-inositol; NAA, N-acetylaspartate; PC, phosphocholine; PE, phosphoethanolamine; SI, scyllo-inositol; Suc, succinate; Tau, taurine; tCho, total choline ([Cho] + [PC] + [GPC]); tGSH, total glutathione ([GSH] + [GSSG]); Thr, threonine; Val, valine.
Figure 5
Figure 5
Metabolite profiles of primary versus secondary glioblastoma multiforme (GBM). Mean Carr–Purcell–Meiboom–Gill (CPMG) spectra for glioma samples histologically defined as primary grade IV (n = 101) (A) and secondary grade III → IV (n = 14) (B) or grade II → IV (n = 19) (C). Deviation in quantified mean metabolite levels of grade II → III and II → IV glioma relative to grade II → II glioma; reported levels are unitless owing to the T2 dependence of the CPMG acquisition (D). Significant increases or decreases in the metabolite levels displayed as residuals are highlighted in red and green, respectively. Statistical significance was defined as p < 0.05 for the comparative analysis among subtypes using the proportional odds logistic regression analysis. MeOH and EtOH are contaminants resulting from surgical sterilization procedures. 2HG, d-2-hydroxyglutarate; Ace, acetate; Ala, alanine; Asp, aspartate; Bet, betaine; Cho, free choline; Cr, PCr, creatine, phosphocreatine; Eth, ethanolamine; EtOH, ethanol; GABA, γ-aminobutyric acid; Glc, glucose; Gln, glutamine; Glu, glutamate; Gly, glycine; GPC, glycerophosphocholine; GSH, glutathione; GSSG, glutathione disulfide; hTau, hypotaurine; Ile, isoleucine; Lac, lactate; Leu, leucine; Lip, lipid; Lys, lysine; MCI, myo-inositol to total choline index; MeOH, methanol; MI, myo-inositol; NAA, N-acetylaspartate; PC, phosphocholine; PE, phosphoethanolamine; SI, scyllo-inositol; Suc, succinate; Tau, taurine; tCho, total choline ([Cho] + [PC] + [GPC]); tGSH, total glutathione ([GSH] + [GSSG]); Thr, threonine; Val, valine.
Figure 6
Figure 6
Representative spectra from primary versus secondary glioblastoma multiforme (GBM). Red trace represents the high-resolution magic angle spinning (HR-MAS) spectrum from a primary de novo GBM; blue trace represent the spectrum from a secondary GBM (grade II → IV). Spectra were normalized by the electronic reference to access in vivo concentrations (ERETIC) signal and tissue sample weights. This example shows the characteristic elevation of metabolites in secondary GBM relative to a primary counterpart, together with the distinguishing presence of the onco-metabolite 2HG. 2HG, d-2-hydroxyglutarate; Ace, acetate; Ala, alanine; Asp, aspartate; Cho, free choline; Cr, PCr, creatine, phosphocreatine; GABA, γ-aminobutyric acid; Glc, glucose; Gln, glutamine; Glu, glutamate; Gly, glycine; GPC, glycerophosphocholine; GSH, glutathione; GSSG, glutathione disulfide; hTau, hypotaurine; Lac, lactate; Lip, lipid; Lys, lysine; MI, myo-inositol; PC, phosphocholine; PE, phosphoethanolamine; SI, scyllo-inositol; Tau, taurine; tGSH, total glutathione ([GSH] + [GSSG]).

Similar articles

Cited by

References

    1. Lois DN, Ohgaki H, Wiestler OD, Cavenee WK, Burger PC, Jouvet A, Scheithauer BW, Kleihues P. The 2007 WHO classification of tumours of the central nervous system. Acta Neuropathol. 2007;114(2):97–109. - PMC - PubMed
    1. Lopes MBS, VandenBerg SR, Scheithauer BW. The World Health Organization classification of nervous system tumors in experimental neuro-oncology. In: Levine AJ, Schmidek HH, editors. Molecular Genetics of Nervous System Tumors. Wiley-Liss: New York; 1993. pp. 1–36.
    1. Jaeckle KA, Decker PA, Ballman KV, Flynn PJ, Giannini C, Scheithauer BW, Jenkins RB, Bucknew JC. Transformation of low grade glioma and correlation with outcome: an NCCTG database analysis. J. Neurooncol. 2011;104(1):253–259. - PMC - PubMed
    1. Glunde K, Bhujwalla ZM, Ronen SM. Choline metabolism in malignant transformation. Nat. Rev. Cancer. 2011;11(12):835–848. - PMC - PubMed
    1. Chow LM, Endersby R, Zhu X, Rankin S, Qu C, Zhang J, Broniscer A, Ellison DW, Baker SJ. Cooperativity within and among Pten, p53, Rb pathways induces high-grade astrocytoma in adult brain. Cancer Cell. 2011;19(3):305–316. - PMC - PubMed

Publication types

LinkOut - more resources