. 2014 Jan 1:3:e01566.
doi: 10.7554/eLife.01566.

TTC26/DYF13 is an intraflagellar transport protein required for transport of motility-related proteins into flagella

Affiliations

TTC26/DYF13 is an intraflagellar transport protein required for transport of motility-related proteins into flagella

Hiroaki Ishikawa et al. Elife. .

Erratum in

Abstract

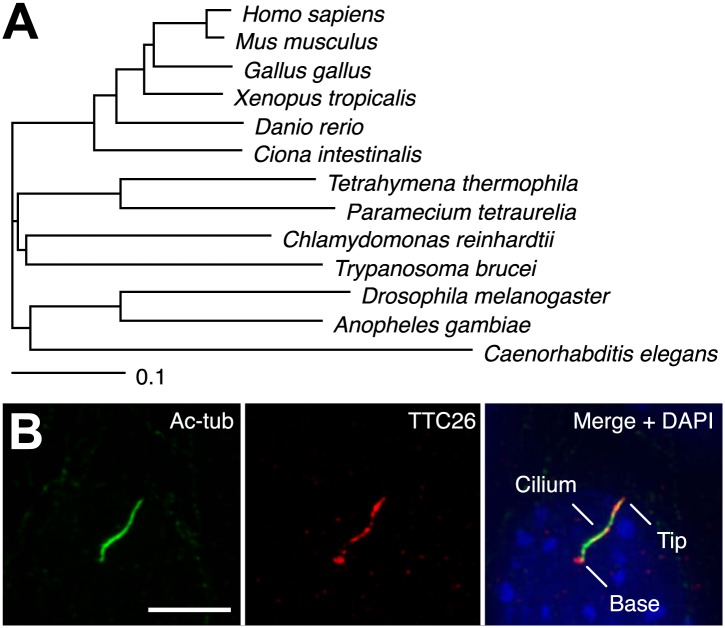
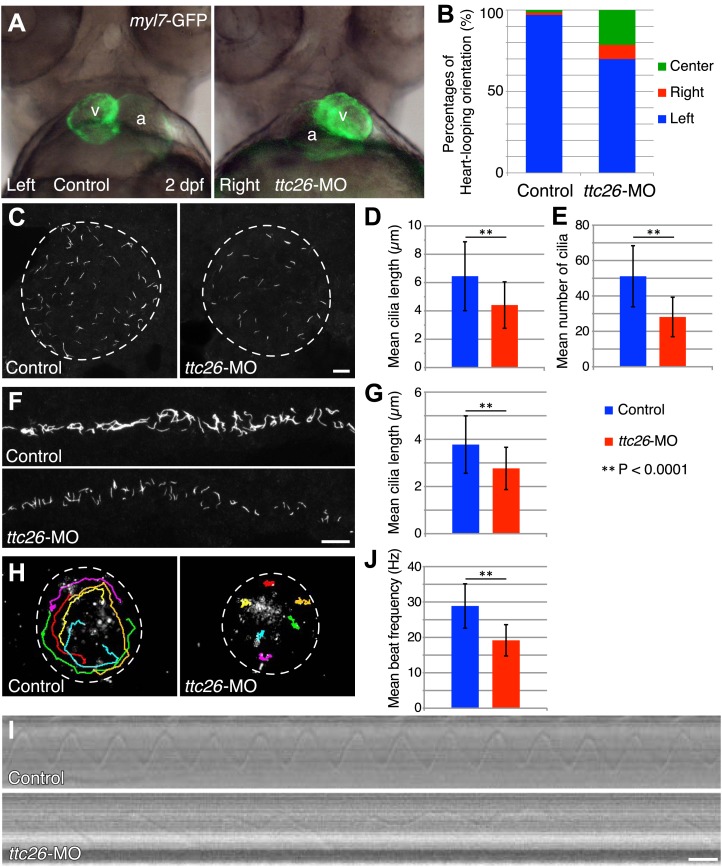
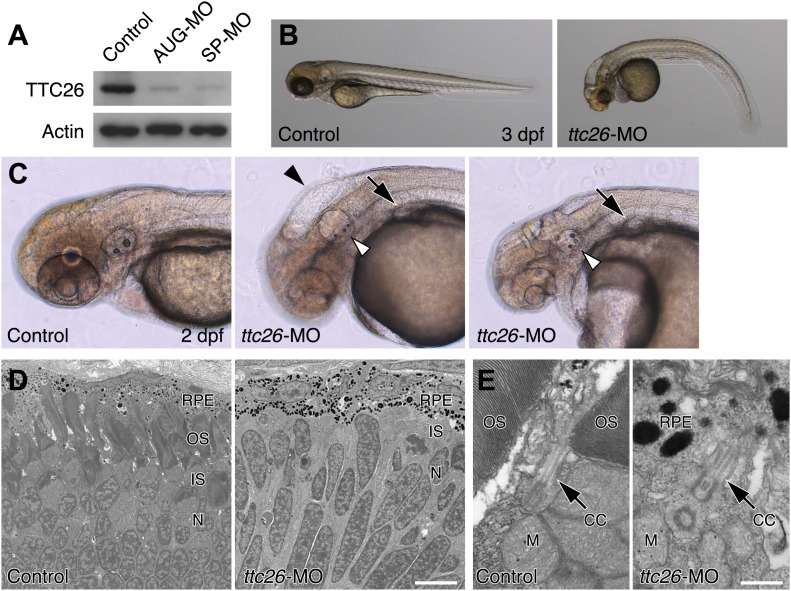
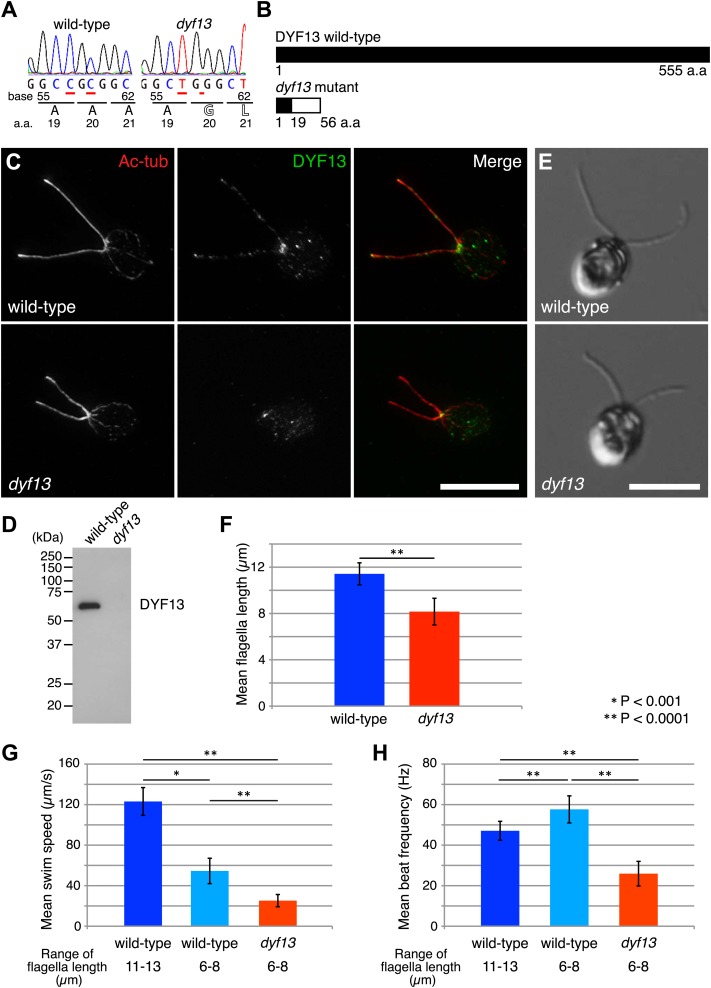
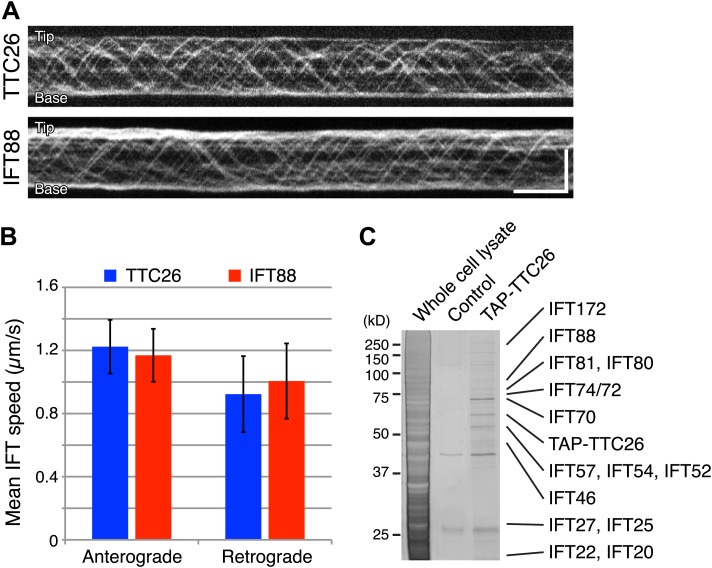
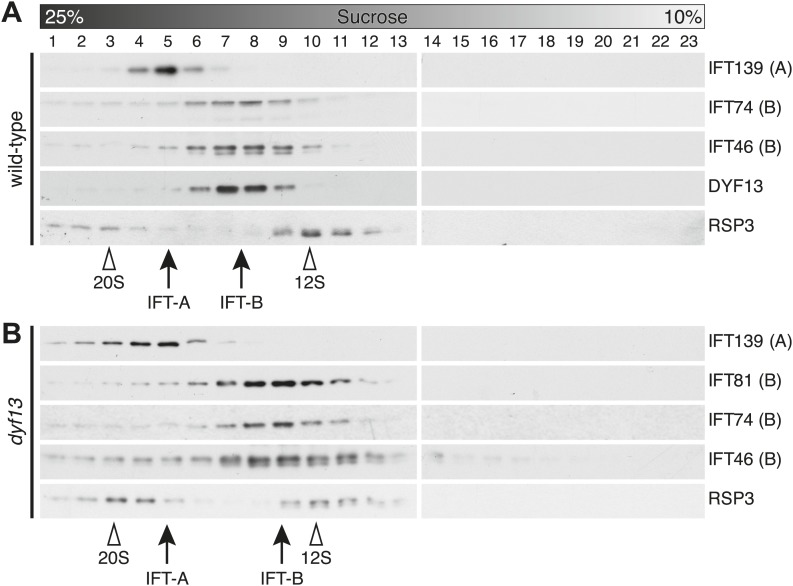
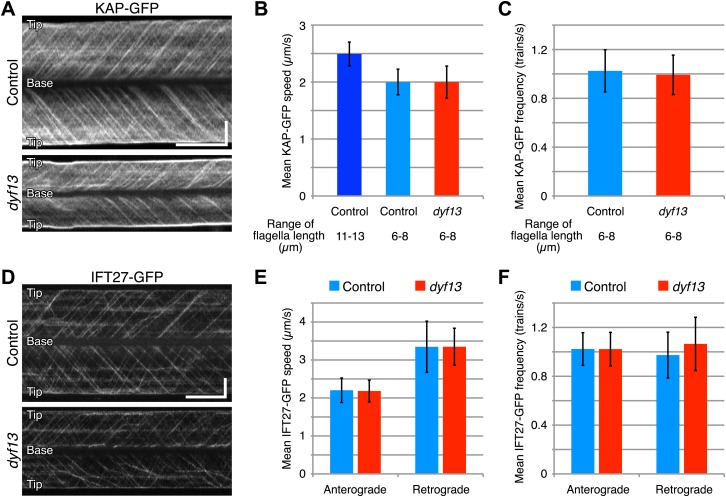
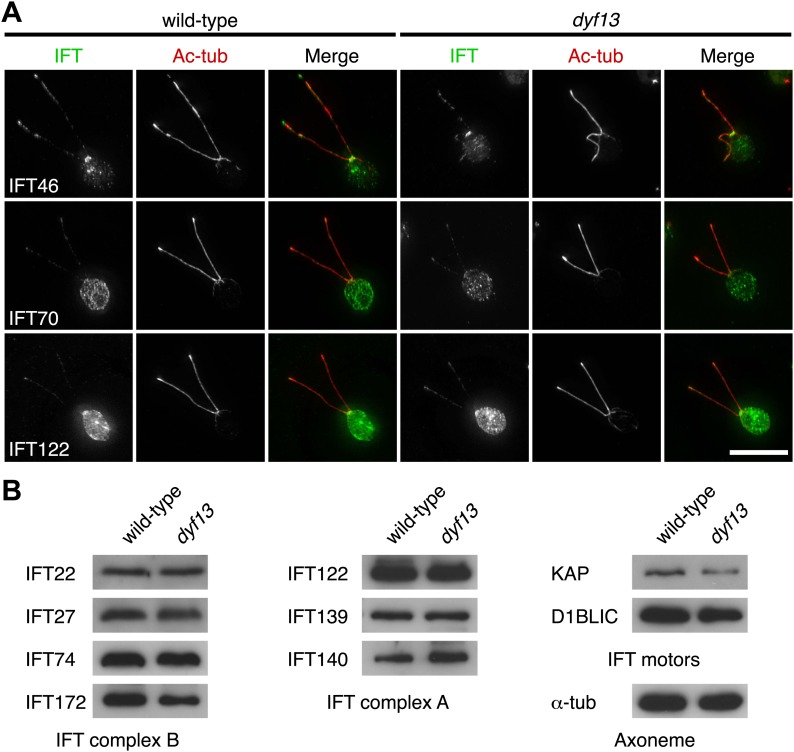
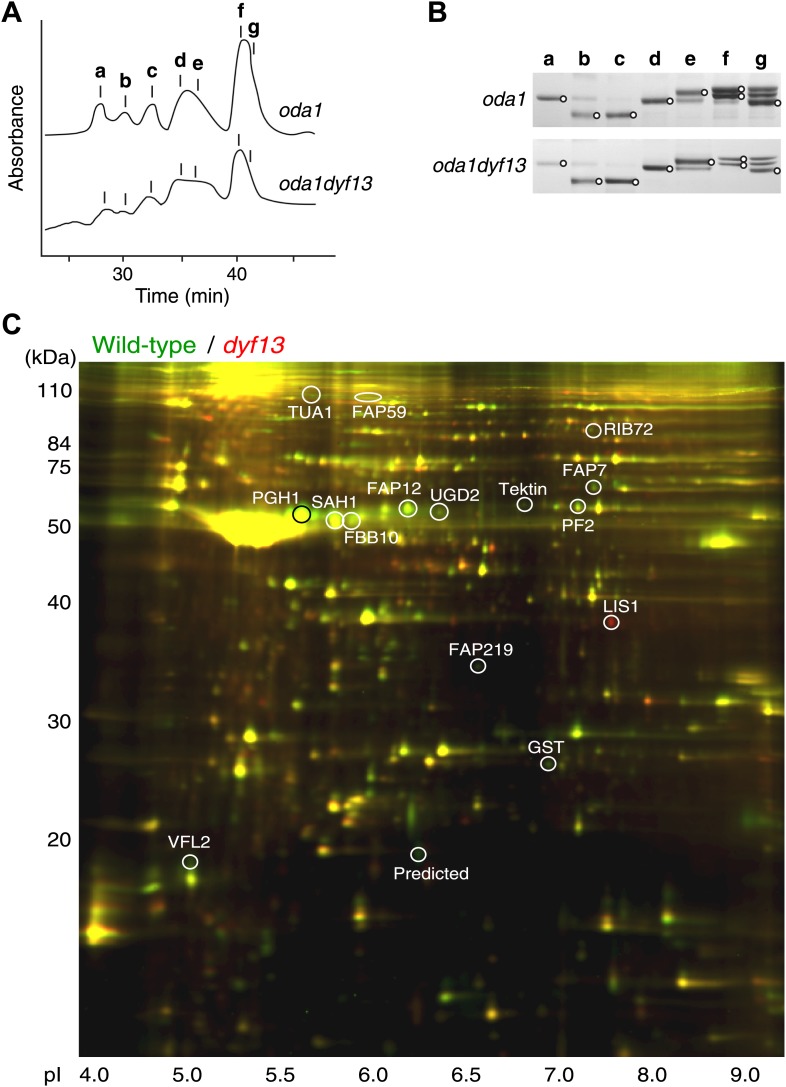
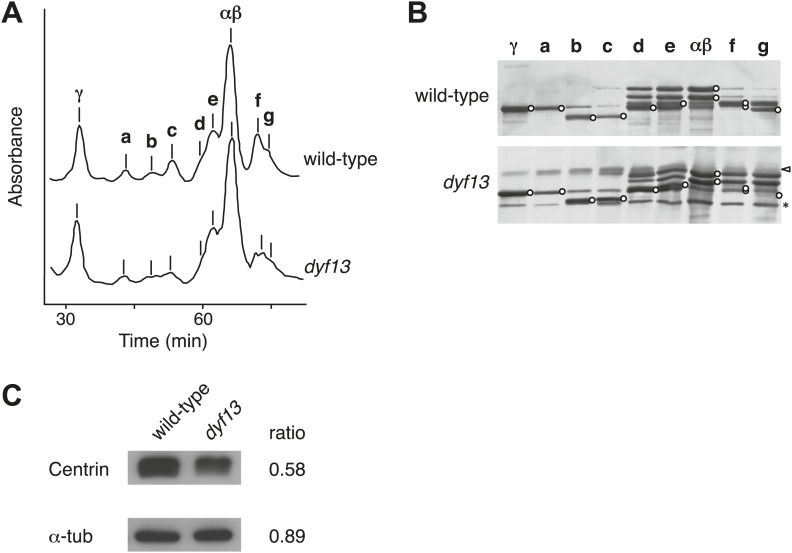
Cilia/flagella are assembled and maintained by the process of intraflagellar transport (IFT), a highly conserved mechanism involving more than 20 IFT proteins. However, the functions of individual IFT proteins are mostly unclear. To help address this issue, we focused on a putative IFT protein TTC26/DYF13. Using live imaging and biochemical approaches we show that TTC26/DYF13 is an IFT complex B protein in mammalian cells and Chlamydomonas reinhardtii. Knockdown of TTC26/DYF13 in zebrafish embryos or mutation of TTC26/DYF13 in C. reinhardtii, produced short cilia with abnormal motility. Surprisingly, IFT particle assembly and speed were normal in dyf13 mutant flagella, unlike in other IFT complex B mutants. Proteomic and biochemical analyses indicated a particular set of proteins involved in motility was specifically depleted in the dyf13 mutant. These results support the concept that different IFT proteins are responsible for different cargo subsets, providing a possible explanation for the complexity of the IFT machinery. DOI: http://dx.doi.org/10.7554/eLife.01566.001.

Keywords: Chlamydomonas; axoneme; dynein; flagella.


Conflict of interest statement

The authors declare that no competing interests exist.

Figures

Figure 1.
Figure 1.. TTC26 is a conserved ciliary protein.
(A) Phylogenetic tree of TTC26 in various ciliated organisms. All protein sequences were obtained from RefSeq (NCBI). The scale bar represents 0.1 substitutions per nucleotide site. (B) Immunofluorescence images of primary cilia in IMCD3 cells. The cells were stained with antibodies to acetylated tubulin (green), TTC26 (red) and DAPI (blue). Bar: 5 μm. DOI: http://dx.doi.org/10.7554/eLife.01566.003
Figure 2.
Figure 2.. Knockdown of ttc26 in zebrafish induces shorter cilia and motility defect.
(A) Representative images of heart-looping orientations of control (Left: normal) and ttc26 knockdown (Right: reversed) fish at 2 dpf. myl7-GFP transgenic embryos were injected with control or ttc26 morpholinos. Atrium and ventricle are indicated by the letters a and v. (B) Percentages of heart-looping orientation of control (n = 338) and ttc26 (n = 309) knockdown fish. Around 97% of control morphants showed normal heart-looping orientations (left: blue). In contrast, more than 30% of ttc26 morphants showed abnormal heart-looping orientations (right: red and center: green). (C) Immunofluorescence images of Kupffer’s vesicle in control and ttc26 knockdown embryos, which were stained with antibodies to acetylated tubulin at 10-somite stage. Dashed line shows boundary of KV. Bar: 10 μm. (D) Length of KV cilia in control (n = 920) and ttc26 knockdown fish (n = 506, p<1 × 10−69). Blue shows control and red shows ttc26 knockdown embryo. Error bars represent standard deviations in all figures. (E) Number of KV cilia in control (blue, n = 18) and ttc26 knockdown fish (red, n = 18, p<1 × 10⁻⁴). (F) Immunofluorescence images of pronephric ducts that were stained with antibodies to acetylated tubulin at the 22-somite stage. Bar: 10 μm. (G) Length of pronephric duct cilia in control (n = 103) and ttc26 knockdown fish (n = 75, p<1 × 10⁻⁸). (H) The traces of fluorescent beads in KV in control and ttc26 knockdown embryos at the 8-somite stage showing impaired fluid flow in the morphant. Six representative tracks are shown in different colors in each image. These tracks were traced from the first 50 frames of Videos 1 and 2. (I) Kymographs of individual KV cilia in control and ttc26 knockdown embryos. These kymographs were assembled from Videos 3 and 4. Bar: 20 ms. (J) Beat frequency of KV cilia in control (blue, n = 38) and ttc26 knockdown fish (red, n = 21, p<1 × 10⁻⁸). Error bars show standard deviations. DOI: http://dx.doi.org/10.7554/eLife.01566.004
Figure 2—figure supplement 1.
Figure 2—figure supplement 1.. ttc26 knockdown zebrafish shows phenotypes typical of defective cilia.
(A) Expression of TTC26 in control and ttc26 knockdown zebrafish. 3 dpf embryos were lysed with 1× SDS sample buffer and detected by Western blotting with TTC26 and actin antibodies. Control, AUG-MO and SP-MO show negative control, translational blocking, and splice blocking ttc26 morpholinos injected embryos, respectively. Actin antibody was used as a loading control. (B) Brightfield images of control and ttc26 knockdown fish at 3 dpf. ttc26 knockdown fish showed phenotypes typical of defective cilia. (C) Representative images of anterior region of embryos at 2 dpf. ttc26 knockdown fish showed hydrocephalus (black arrowhead), pronephric cyst (arrow), and abnormal ear otolith formation (white arrowhead). (D) Transmission electron micrographs of retina at 4 dpf. ttc26 knockdown fish lost outer segment (OS) of photoreceptor. Bar: 5 μm. (E) Transmission electron micrographs of connecting cilium in the retina. ttc26 knockdown fish still have connecting cilia (CC: arrow) despite the absence of outer segments. Bar: 500 nm. CC, connecting cilium; IS, inner segment; M, mitochondria; N, nucleus; OS, outer segment; RPE, retinal pigment epithelium. DOI: http://dx.doi.org/10.7554/eLife.01566.005
Figure 3.
Figure 3.. C. reinhardtii dyf13 mutant has short flagella and motility defects.
(A) Sequences of the DYF13 gene (RefSeq accession: XM_001698717) in wild-type (CC125) and dyf13 mutant cells. Red underlines show places of mutations. A one-base substitution (c.57C >T) does not change amino acid. A one-base deletion (c.59delC) in the dyf13 gene induces frame-shift after 20th amino acid (a.a.) reside (p.Ala20Glufs). (B) Schematic representation of C. reinhardtii DYF13 (XP_001698769) and its mutant. The black bar indicates correct amino acid sequence and the white bar indicates frame-shift sequence. (C) Immunofluorescence images of wild-type and dyf13 mutant cells. The cells were stained with antibodies to acetylated tubulin (red) and DYF13 (green). Bar: 10 μm. (D) Isolated flagella fractions from wild-type cc125 and dyf13 mutant cells were analyzed in Western blots probed with the DYF13 antibody. The DYF13 antibody specifically recognized a ∼56 kDa band. (E) DIC images of wild-type and dyf13 mutant cells. Bar: 10 μm. (FH) Flagella length (F), swim speed (G), and beat frequency of flagella (H) of wild-type (blue, n = 12) and dyf13 mutant cells (red, n = 12, p<1 × 10⁻⁶, 10−8, 10−12, respectively). Swim speeds and beat frequencies of flagella were measured also in wild-type cells with short flagella, which were adjusted by pH shock and regeneration (light blue, n = 10). Error bars represent standard deviations. DOI: http://dx.doi.org/10.7554/eLife.01566.010
Figure 4.
Figure 4.. TTC26/DYF13 is an IFT complex B protein.
(A) Kymographs of GFP-tagged mouse TTC26 and IFT88 moving in cilia of mouse IMCD3 cells. These kymographs were assembled from Videos 7 and 8. Bars: 10 s (horizontal), 5 μm (vertical). (B) The mean IFT speeds of TTC26- and IFT88-GFP. TTC26-GFP (blue, n = 37 cilia, more than 200 particles) and IFT88-GFP (red, n = 43 cilia, more than 200 particles) showed similar speeds in both anterograde and retrograde movements. Error bars represent standard deviations. (C) TTC26/DYF13 physically associates with IFT complex B proteins in mouse cilia. Proteins obtained from tandem affinity purification of TTC26 were separated on an acrylamide gel and visualized by silver staining as shown. The identity of each protein bands as determined by mass spectrometry is indicated next to the band, with details given in Supplementary file 1A. DOI: http://dx.doi.org/10.7554/eLife.01566.013
Figure 5.
Figure 5.. DYF13 is a part of IFT complex B.
(A) The sucrose density gradient fractions of wild-type flagella. Flagellar matrix was fractionated through a 10–25% sucrose density gradient. The sucrose density gradient fractions were separated by 10% SDS-PAGE and analyzed by Western blotting. DYF13 had a peak that coincides with other IFT complex B proteins (IFT74 and IFT46). (B) Sucrose density gradient fractions of dyf13 mutant flagella. The peaks of IFT complex B proteins in dyf13 mutant flagella shifted to light density in the gradient (B; IFT81, IFT74, and IFT46), but the peak of IFT complex A protein (IFT139) did not shift. RSP3, a component of the radial spoke and not part of the IFT complex, is used as a gradient marker, which sediments at 20S and 12S in the gradient (indicated by white arrowheads). The peaks of IFT complex A and B proteins are indicated by arrows. DOI: http://dx.doi.org/10.7554/eLife.01566.016
Figure 6.
Figure 6.. DYF13 does not influence IFT particle movement.
(A) Kymographs of KAP-GFP in control and dyf13 mutant C. reinhardtii cells. These kymographs were assembled from Videos 9 and 10. Bars: 5 s (horizontal), 5 μm (vertical). (B) The mean IFT speeds of KAP-GFP in control and dyf13 mutant. (C) The mean frequencies of KAP-GFP in control and dyf13 mutant in the same range of flagella length. The mean speeds and frequencies of KAP-GFP in control (light blue) and dyf13 mutant (red) were almost same in the same range of flagella length (6–8 μm). (D) Kymographs of IFT27-GFP in control and dyf13 mutant C. reinhardtii flagella. These kymographs were assembled from Videos 11 and 12. Bars: 5 s (horizontal), 5 μm (vertical). (E) The mean IFT speeds of IFT27-GFP in control and dyf13 mutant in the same range of flagella length. (F) The mean frequencies of KAP-GFP in control and dyf13 mutant in the same range of flagella length. The mean speeds and frequencies of IFT27-GFP in control (light blue) and dyf13 mutant (red) flagella were almost same in the same range of flagella length in both anterograde and retrograde. Error bars represent standard deviations. DOI: http://dx.doi.org/10.7554/eLife.01566.017
Figure 7.
Figure 7.. DYF13 does not influence localizations and amounts of other IFT proteins.
(A) Immunofluorescence images of wild-type and dyf13 mutant cells. The cells were stained with antibodies to acetylated tubulin (red) and IFT46, IFT70, and IFT122 (green). Bar: 10 μm. (B) Western blotting images of IFT proteins in wild-type and dyf13 mutant flagella. Relative amounts of IFT proteins did not change between wild-type and dyf13 mutant flagella. DOI: http://dx.doi.org/10.7554/eLife.01566.022
Figure 8.
Figure 8.. dyf13 mutant reduces the levels of inner dynein arm components in its flagella.
(A) Elution patterns of inner-arm dyneins of oda1 single and oda1dyf13 double mutant C. reinhardtii cells. Inner-arm dyneins were extracted with high salt from outer-armless axonemes of oda1 and oda1dyf13 cells and fractionated by ion-exchange chromatography on a Mono Q column. The elution positions of each dyneins are indicated by a–g. (B) SDS-PAGE of peak fractions showing the dynein heavy chain bands (circles). Peak fractions were subjected to SDS-PAGE with a 3–5% acrylamide gradient and a 3–8 M urea gradient. Dynein a and f were reduced in oda1dyf13 compared with oda1. (C) 2D-DIGE proteomic analysis of wild-type and dyf13 mutant flagella. Fluorescence image of the 2D-DIGE analytical gel, using isoelectric focusing (IEF) in the first dimension and SDS polyacrylamide gel electrophoresis (SDS-PAGE) in the second dimension. Wild-type is shown in green and dyf13 mutant is shown in red. DOI: http://dx.doi.org/10.7554/eLife.01566.023
Figure 8—figure supplement 1.
Figure 8—figure supplement 1.. dyf13 mutant does not change the levels of outer dynein arm components in its flagella.
(A) Elution patterns of outer-arm and inner-arm dyneins of wild-type and dyf13 mutant C. reinhardtii cells. The elution positions of each dyneins are indicated by αβ, γ (outer-arm), and a–g (inner-arm). (B) SDS-PAGE of peak fractions showing the dynein heavy chain bands (circles). Peak fractions were subjected to SDS-PAGE with a 3–5% acrylamide gradient and a 3–8 M urea gradient. Contaminations of membrane fraction and degradation products are indicated by white arrowhead and asterisk, respectively. Dynein a and f were reduced in dyf13 mutant but αβ, γ were not changed compared with wild-type flagella. FPLC and SDS-PAGE were separately performed in the figure. (C) Western blotting images of isolated flagella fractions from wild-type cc125 and dyf13 mutant cells probed with antibodies centrin and α-tubulin. The ratio column shows the relative intensity ratio of dyf13 mutant band normalized with wild-type band intensity, showing that the relative amount of centrin was reduced in dyf13 mutant flagella by approximately 50%, comparable to the abundance change measured by 2D-DIGE. DOI: http://dx.doi.org/10.7554/eLife.01566.024

Comment in

Similar articles

Cited by

References

    1. Absalon S, Blisnick T, Kohl L, Toutirais G, Doré G, Julkowska D, Tavenet A, Bastin P. 2008. Intraflagellar transport and functional analysis of genes required for flagellum formation in trypanosomes. Molecular Biology of the Cell 19:929–944. 10.1091/mbc.E07-08-0749 - DOI - PMC - PubMed
    1. Ahmed NT, Gao C, Lucker BF, Cole DG, Mitchell DR. 2008. ODA16 aids axonemal outer row dynein assembly through an interaction with the intraflagellar transport machinery. Journal of Cell Biology 183:313–322. 10.1083/jcb.200802025 - DOI - PMC - PubMed
    1. Arnaiz O, Malinowska A, Klotz C, Sperling L, Dadlez M, Koll F, Cohen J. 2009. Cildb: a knowledgebase for centrosomes and cilia. Database (Oxford) 2009:bap022. 10.1093/database/bap022 - DOI - PMC - PubMed
    1. Avidor-Reiss T, Maer AM, Koundakjian E, Polyanovsky A, Keil T, Subramaniam S, Zuker CS. 2004. Decoding cilia function: defining specialized genes required for compartmentalized cilia biogenesis. Cell 117:527–539. 10.1016/S0092-8674(04)00412-X - DOI - PubMed
    1. Badano JL, Mitsuma N, Beales PL, Katsanis N. 2006. The ciliopathies: an emerging class of human genetic disorders. Annual Review of Genomics and Human Genetics 7:125–148. 10.1146/annurev.genom.7.080505.115610 - DOI - PubMed

Publication types

MeSH terms