Comparative Study
. 2014 Jan 1:3:e01630.
doi: 10.7554/eLife.01630.

A proteomic chronology of gene expression through the cell cycle in human myeloid leukemia cells

Affiliations
Comparative Study

A proteomic chronology of gene expression through the cell cycle in human myeloid leukemia cells

Tony Ly et al. Elife. .

Abstract

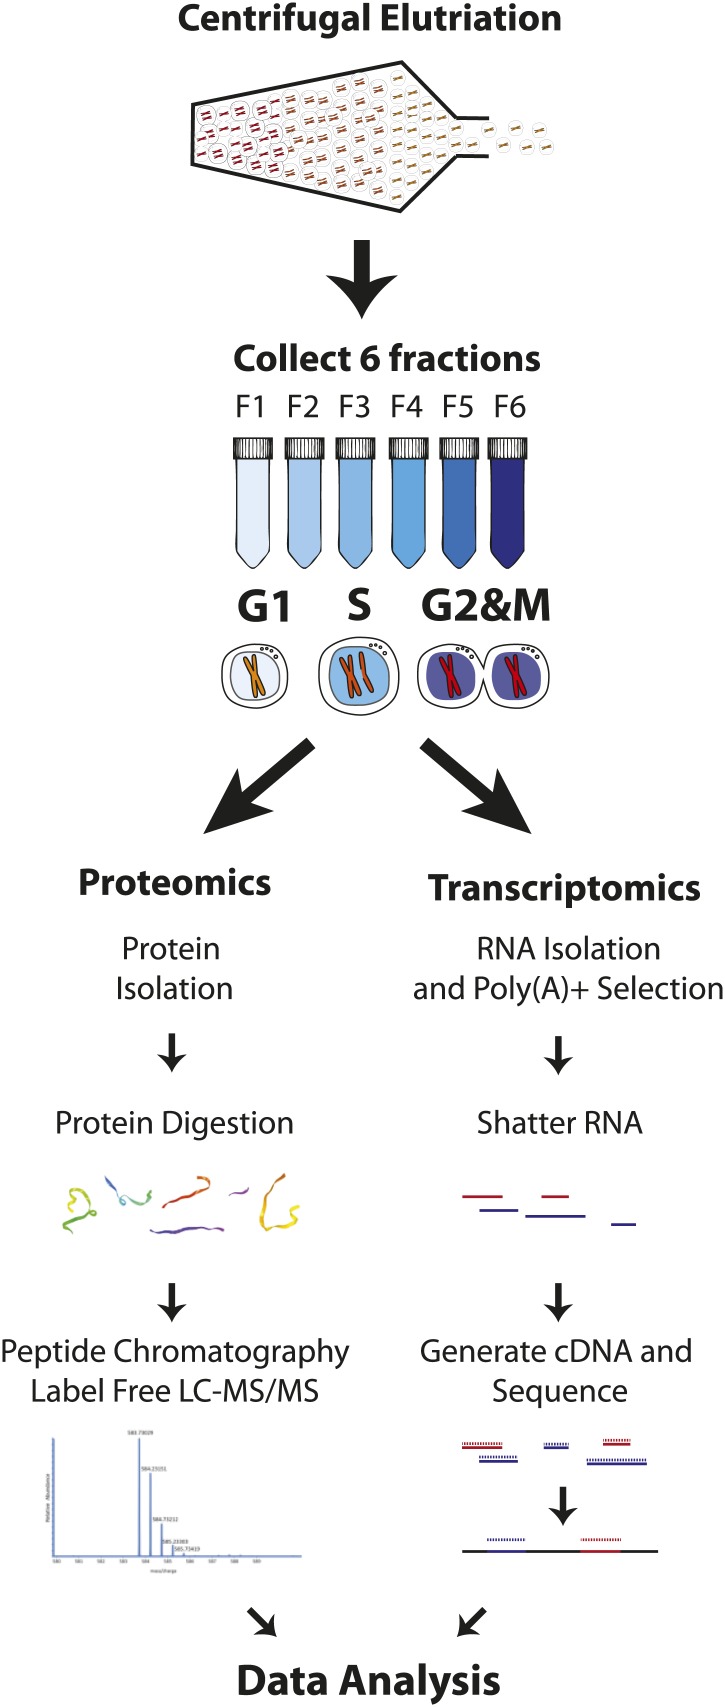
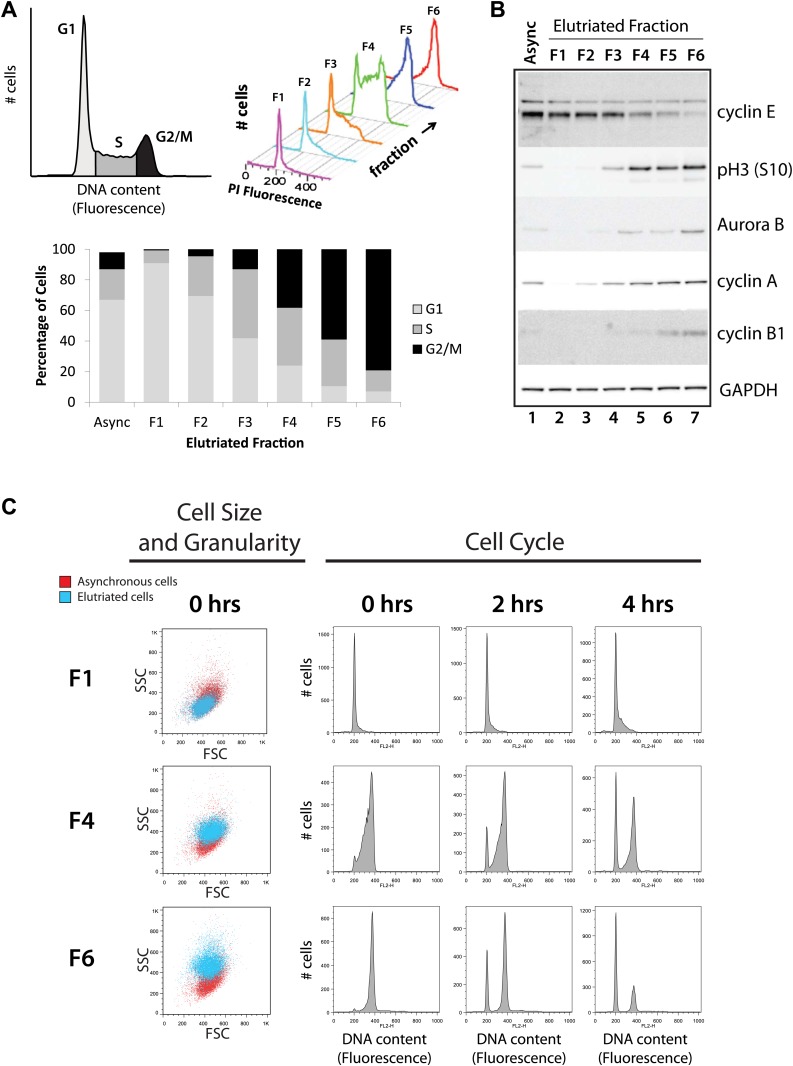
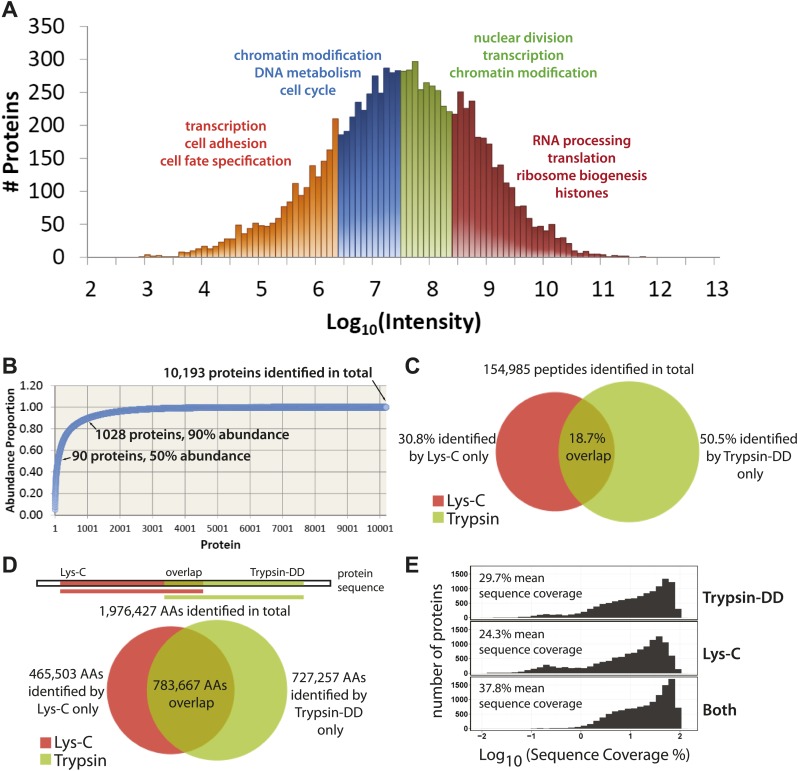
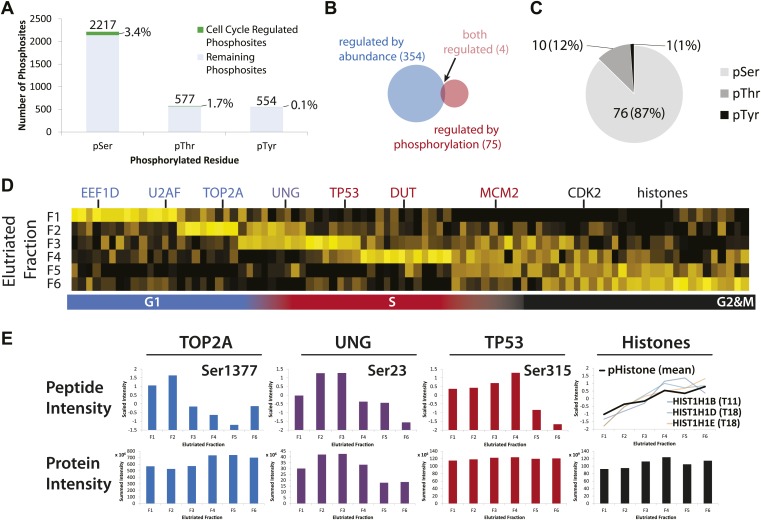
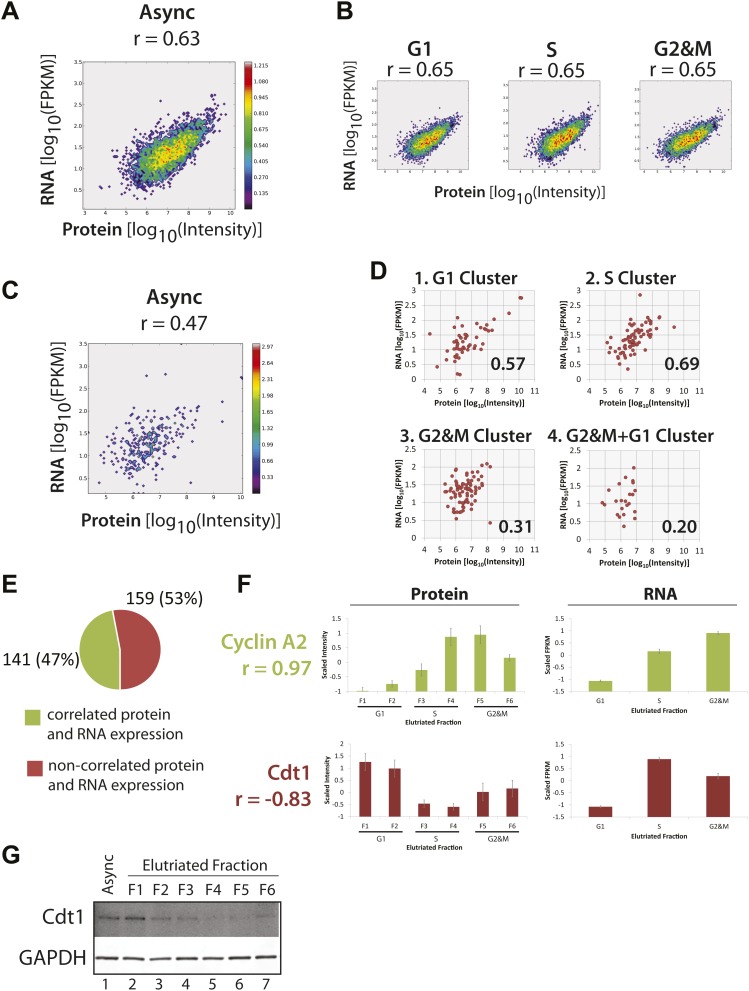
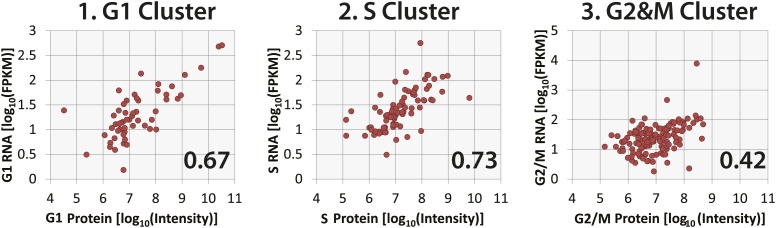
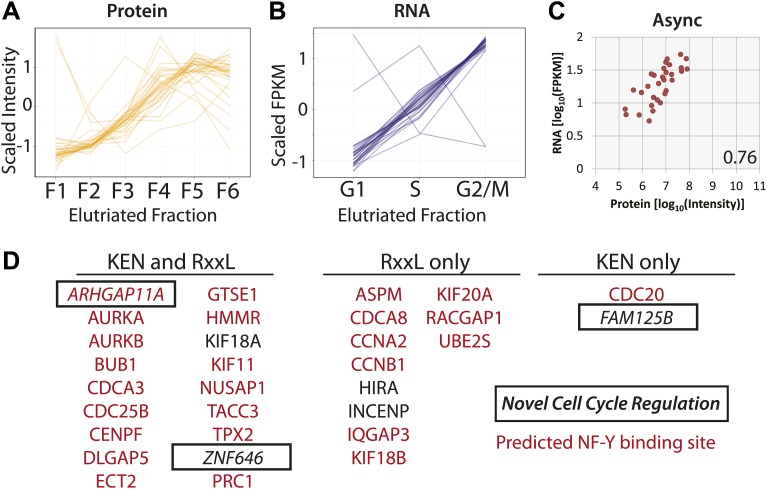
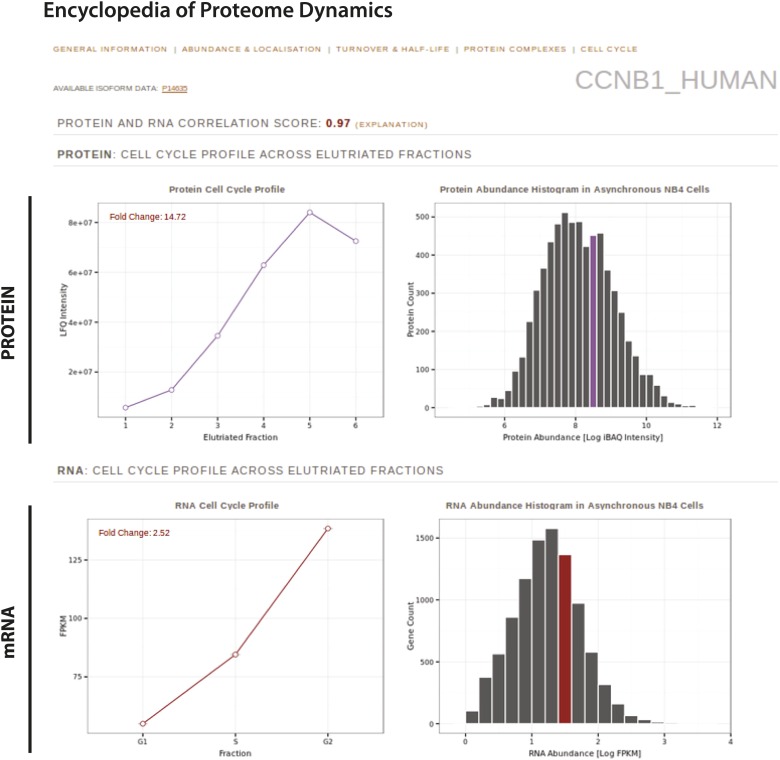
Technological advances have enabled the analysis of cellular protein and RNA levels with unprecedented depth and sensitivity, allowing for an unbiased re-evaluation of gene regulation during fundamental biological processes. Here, we have chronicled the dynamics of protein and mRNA expression levels across a minimally perturbed cell cycle in human myeloid leukemia cells using centrifugal elutriation combined with mass spectrometry-based proteomics and RNA-Seq, avoiding artificial synchronization procedures. We identify myeloid-specific gene expression and variations in protein abundance, isoform expression and phosphorylation at different cell cycle stages. We dissect the relationship between protein and mRNA levels for both bulk gene expression and for over ∼6000 genes individually across the cell cycle, revealing complex, gene-specific patterns. This data set, one of the deepest surveys to date of gene expression in human cells, is presented in an online, searchable database, the Encyclopedia of Proteome Dynamics (http://www.peptracker.com/epd/). DOI: http://dx.doi.org/10.7554/eLife.01630.001.

Keywords: RNA-Seq; cell cycle; mass spectrometry; proteomics; transcriptomics.


Conflict of interest statement

The authors declare that no competing interests exist.

Figures

Figure 1.
Figure 1.. Experimental workflow.
NB4 cells were harvested and fractionated by cell size using centrifugal elutriation. Six fractions were collected and processed separately for transcriptomics and proteomics. For proteomics, cells were lysed and digested with either Lys-C or Lys-C/trypsin. Peptides were then separated by two orthogonal modes of chromatography prior to analysis using an Orbitrap mass spectrometer. Data normalization, peak picking, database searching, peptide and protein identification were performed using the MaxQuant software suite. For transcriptomics, cells from the six fractions were pooled into three (G1, S, and G2&M-enriched fractions). Total RNA was extracted, and subjected to poly(A)+ tail selection. Poly(A)+ transcripts were shattered, reverse transcribed to establish cDNA libraries, which were sequenced using Illumina paired-end sequencing technology. Reads were aligned to the human genome (build hg19) using TopHat, and then used for quantitative gene expression analysis of known protein coding genes using Cufflinks. DOI: http://dx.doi.org/10.7554/eLife.01630.003
Figure 2.
Figure 2.. Validation of cell cycle enrichment by centrifugal elutriation.
(A) Cells from asynchronous cells (top left) and each elutriation fraction (top right) were stained with a DNA-binding fluorescent dye and analyzed with flow cytometry. Proportions of cells in each cell cycle phase (bottom) were estimated using the Watson model. Fractions 1 and 2 (F1 and F2) are enriched in G1, fractions 3 and 4 (F3 and F4) are enriched in S, and fractions 5 and 6 (F5 and F6) are enriched in G2 and M phase (G2&M). (B) Immunoblot analyses of the protein lysates for known cell cycle phase-specific markers (cyclin E, phospho-Histone H3 S10, aurora kinase B, cyclin A, and cyclin B1) are consistent with previous literature and the enrichment profiles in (A). (C) Forward scatter and side scatter plots (first column) and cell cycle distributions (remaining columns) for three representative fractions post inoculation (F1, F4, and F6). The forward and side scatter plots for each elutriated fraction are shown in cyan, and are directly compared with the same plot for asynchronous cells, which is shown in red. Cell cycle distributions of the three fractions are measured directly after elutriation (0 hr), and 2 and 4 hr after inoculation into tissue culture medium. Note that the cell cycle distributions shown includes cells with <2N DNA content. DOI: http://dx.doi.org/10.7554/eLife.01630.004
Figure 3.
Figure 3.. Quantitative, in-depth characterization of a myeloid leukemia proteome.
(A) A histogram of log-transformed protein abundance (iBAQ-scaled protein intensities). Quartile regions are shown in different colors, and enriched gene ontology terms (p<0.01) are shown above each region. (B) A cumulative plot of protein abundance, as estimated using iBAQ-scaled intensities. In total, 10,193 proteins were identified with at least two supporting peptides per protein. Protein abundances follow an exponential increase, with 90 proteins (0.9%) constituting 50% of the bulk protein mass, and 1028 proteins (10%) constituting 90% of the bulk protein mass. The remaining protein identifications (9075 or 89.1%) comprise less than 10% of the bulk protein mass in NB4 cells. (C and D) Venn diagrams showing the total number of sequence-unique peptides (154,985) and amino acid coverage (1,976,427) split by digestion method. Lys-C increases the number of peptides identified by 44% relative to Trypsin-DD. Amino acid coverage was calculated by mapping sequences back to an assembled proteome. Over 30% of the amino acids detected using Lys-C digestion reside in sections of protein sequences that are complementary to Trypsin. In summary, complementary digestion methods substantially increase the overall sequence coverage, as shown in (E). Combining data from both methods boosts the mean sequence coverage to 37.8% with comprehensive proteome depth of over 10,000 proteins. DOI: http://dx.doi.org/10.7554/eLife.01630.005
Figure 3—figure supplement 1.
Figure 3—figure supplement 1.. Estimation of technical and biological variances among replicates indicates highly reproducible protein quantitation.
A correlation matrix showing pairwise comparisons between biological and technical replicates of the SingleShot proteomics workflow is shown. Sample identifiers are shown along the diagonal. Log-transformed label-free quantitation (LFQ) intensities are shown along the bottom left corner, and the associated Pearson correlation coefficients are shown along the top right corner. All pairwise comparisons reveal high correlation (>0.95) between replicates, indicating high biological and technical reproducibility. DOI: http://dx.doi.org/10.7554/eLife.01630.006
Figure 3—figure supplement 2.
Figure 3—figure supplement 2.. Comparison of expected versus observed amino acid and gene ontology frequencies reveals no major detection bias in the proteomics data set.
(A) The amino acid frequency of identified proteins using the hSAX workflow was compared against the search database (the UniProt Complete Human Reference Proteome). Cellular compartment (B) and biological process (C) gene ontology term frequencies were calculated for the identified data set and the search database. High correlation between the expected frequencies from the search database and the observed frequencies in the identified proteome suggests that the data set is not obviously biased against or for a particular cellular compartment or biological process. DOI: http://dx.doi.org/10.7554/eLife.01630.007
Figure 4.
Figure 4.. Identification of myeloid-specific factors in the NB4 proteome.
(A) Pairwise comparisons between the NB4 proteome (this study, acute myeloid leukemia) and K562 (chronic myeloid leukemia), Jurkat-T (T-cell leukemia), HeLa (cervical carcinoma), and MCF7 (breast carcinoma) proteomes published by Geiger et al. (2012). Enriched gene ontology terms and the enrichment p-values are shown for each pairwise comparison. The observed cell-line specific gene ontology enrichments are consistent with the developmental origins of the cell lines (immune vs epithelial), and culturing conditions (suspension vs adherent). The NB4 proteome is highly enriched in transcription factors when compared to cell lines that are not in the myeloid lineage (Jurkat-T, HeLa, and MCF7), implying that there is set of shared transcription factors between NB4 and K562 that may be myeloid-specific. (B) A transcriptional regulatory network analysis of proteins identified in myeloid cells (NB4 and K562). Arrows connect transcription factors with their predicted gene substrates (MSigDB). JUN and SP1 appear to be regulatory hubs that can regulate the expression of numerous NB4- and K562-specific genes (Friedman, 2002). Together, these data highlight a protein group that may have important transcriptional regulatory activity in myeloid cells. Circles indicate genes that are annotated as being involved in myeloid differentiation (red) or transcription (yellow). DOI: http://dx.doi.org/10.7554/eLife.01630.008
Figure 5.
Figure 5.. Identification of cell cycle-regulated proteins.
(A) The fold change in label free intensities between any two fractions are shown as a histogram. To identify cell cycle-regulated proteins, an arbitrary fold change cutoff of 2.0 (1.0 in the log2-transformed axis) was set, as indicated by the border between the orange and blue boxes. Highly significant enriched gene ontology terms (p<<0.01) are shown above each group. A twofold change is sufficient to enrich for cell cycle related gene ontology terms, such as M-phase, nuclear division, and mitosis. (B) Clustering of the 358 cell cycle-regulated proteins identified in (A). Scaled protein intensity profiles were clustered by the phase of maximum expression, with the exception of a small minority of proteins that peaked in multiple phases. Graph titles indicate the phase that is enriched in that fraction. (C) The number of cell cycle-regulated proteins split by cluster. Half of the cell cycle-regulated proteins are maximally expressed in the G2&M phase of the cell cycle. (D) Scaled intensities are depicted as a heat map. Each vertical line represents a cell cycle-regulated protein, and the shading indicates the intensity (bright yellow being the most intense). Cell cycle regulators established in the literature are highlighted along the bottom of the heat map, and include cyclins A2, B1, B2, and CDT1. DOI: http://dx.doi.org/10.7554/eLife.01630.009
Figure 6.
Figure 6.. CASC4, PPFIBP1, and SDCCAG8 are examples of ORFs that encode multiple splice isoforms that behave differently across the cell cycle.
Protein spectral count profiles across the six elutriated fractions for three open reading frames (ORFs) showing protein-level isoform-specific cell cycle variation: CASC4 (A), PPFIBP1 (B), and SDCCAG8 (C). Isoform sequences are shown schematically above each graph. Sequence regions for which direct peptide evidence was detected are shaded in blue, and sequence motifs known to be important in post-translational regulation are indicated. DOI: http://dx.doi.org/10.7554/eLife.01630.011
Figure 7.
Figure 7.. Identification of cell cycle-regulated phosphopeptides.
(A) A total of 2761 phosphorylation sites were identified without phosphopeptide enrichment, which are shown split by residue (Ser, Thr, and Tyr). Cell cycle regulated phosphosites are shown in green. The numbers on top of each bar indicate the total number of pSer, pThr, and pTyr residues detected, respectively. The proportions of cell cycle-regulated pSer, pThr, and pTyr, relative to the total pSer, pThr, and pTyr sites detected respectively, are shown as percentages. (B) Overlap between proteins whose abundances are cell cycle regulated and proteins whose phosphorylation is cell cycle regulated. (C) A breakdown of cell cycle-regulated phosphosites by residue. The number and the percentage of phosphosites relative to the total number of cell cycle regulated phosphosites are shown. (D) Scaled phosphopeptide intensity profiles plotted as a heatmap. Representative cell cycle-regulated phosphorylations that are established in the literature are shown along the top of the heatmap. (E) Scaled phosphopeptide and summed protein intensity profiles for four cell cycle regulated phosphorylated proteins (TOP2A, UNG, TP53, and histones). The peptide intensity graphs are annotated with the mapped phosphorylation site. For histones, several phosphopeptide profiles (light purple, light blue, and light orange) and the average (black) are shown on the same graph. The total histone intensity is calculated as the sum of all histones identified. DOI: http://dx.doi.org/10.7554/eLife.01630.012
Figure 8.
Figure 8.. Correlation of protein and RNA levels across the cell cycle.
Log-transformed, iBAQ-scaled protein intensities and log-transformed FPKM values (RNA) from asynchronous cells (A) and cell cycle fractions (B). RNASeq data are expressed as Fragments Per Kilobase of exon per million fragments Mapped (FPKM), which is a proxy for RNA copy number. Histone genes were removed from the analysis due to the absence of poly(A)+ tails in histone-encoding messages. Each graph is annotated with the calculated Spearmen correlation coefficients (r). (C) Correlation of the protein and mRNA abundances in asynchronous cells of the 358 proteins whose abundances are cell cycle regulated (r = 0.45). (D) The same data shown in (C), but split by protein clusters as described in Figure 5. (E) Correlation of the expression profiles of the 358 cell cycle regulated proteins and their associated transcripts. Genes were classified into two groups based on protein and RNA expression correlation (Pearson’s correlation coefficient greater than or equal to 0.5). (F) Cyclin A2 and Cdt1 are examples highlighted from the groups in (E). Protein and RNA abundance standard errors were calculated from the variance in scaled peptide intensities and biological replicates, respectively. (G) Immunoblot analysis of Cdt1 and GAPDH protein expression across asynchronous and elutriated NB4 cells. DOI: http://dx.doi.org/10.7554/eLife.01630.013
Figure 8—figure supplement 1.
Figure 8—figure supplement 1.. Analysis of technical and biological variance among duplicates reveals highly reproducible RNA quantitation.
A correlation matrix showing pairwise comparisons between biological and technical replicates of the RNASeq transcriptomics workflow. Sample identifiers are shown along the diagonal. Log-transformed FPKM values are shown along the bottom left corner, and the associated Pearson correlation coefficients are shown along the top right corner. All pairwise comparisons reveal high correlation (>0.90) between replicates, indicating high biological and technical reproducibility. DOI: http://dx.doi.org/10.7554/eLife.01630.014
Figure 8—figure supplement 2.
Figure 8—figure supplement 2.. Correlation of protein and RNA abundances of cell cycle-regulated proteins.
Comparison of protein and RNA abundances in G1, S, and G2&M phases of the cell cycle for proteins that peak in G1, S, and G2&M, respectively. Spearman correlation coefficients, which are shown in the inset, follow the same trend as observed in Figure 8D, with G2&M-peaking proteins having the poorest protein and mRNA abundance correlation. DOI: http://dx.doi.org/10.7554/eLife.01630.015
Figure 9.
Figure 9.. Protein and RNA levels are correlated for the specific subset of cell cycle-regulated proteins whose cognate mRNA change by 1.5-fold.
Of the 358 proteins whose abundances are cell cycle regulated, the cognate mRNA of 31 proteins also changes across the elutriated fractions by more than 1.5-fold. Scaled protein (A) and mRNA expression profiles (B) are shown as line graphs for these 31 genes, respectively. (C) Comparison of protein and mRNA abundances in asynchronous cells reveals a Spearman correlation of 0.76. (D) 27 of the 31 genes have predicted NF-Y binding sites in their promoters, and all 31 encode proteins containing a KEN or D-box sequence degron. KEN-motifs are especially enriched (>eightfold enrichment, compared to 7% expected by random chance). Three genes have not been previously annotated as being cell cycle regulated: FAM125B, ZNF646, ARHGAP11A. DOI: http://dx.doi.org/10.7554/eLife.01630.016
Figure 10.
Figure 10.. Identification of ARHGAP11A as a cell cycle regulated protein and a substrate of the APC/C.
(A) MS and RNA-Seq quantitation for ARHGAP11A protein (left) and mRNA (right), respectively. (B) Immunoblot analysis of ARHGAP11A (HPA antibody) and GAPDH protein expression across asynchronous and elutriated NB4 cells. (C) Lysates from U2OS cells treated with either a non-targeting control siRNA (lane 1) or siRNAs targeting Cdh1 and Cdc20 (lane 2) were probed for levels of ARHGAP11A, Cdh1, Cdc20, cyclin B1, and GAPDH by immunoblot. (D) Asynchronous or serum-starved RPE-1 cells were treated with either a non-targeting control siRNA or an siRNA against Cdh1. Lysates were then probed with antibodies against ARHGAP11A (Bethyl antibody), Cdh1, cyclin B1, and GAPDH. DOI: http://dx.doi.org/10.7554/eLife.01630.017
Figure 10—figure supplement 1.
Figure 10—figure supplement 1.. Validation of anti-ARHGAP11A antibodies by siRNA-based depletion of ARHGAP11A protein.
(A) HeLa cells were either mock treated, treated with siRNAs that target lamin A/C, or treated with different concentrations of siRNAs that target ARHGAP11A. Cells were cultured for 48 hr before harvest, lysis, and immunoblot analysis with a Human Protein Atlas (HPA) antibody recognizing ARHGAP11A (top) or an antibody recognizing lamin A/C (bottom). The anti-ARHGAP11A recognizes a band at the correct molecular weight (∼100 kDa), which is significantly decreased upon siRNA depletion of ARHGAP11A protein. Note that lamin A/C levels are not significantly perturbed by treatment of siRNA targeting ARHGAP11A. (B) U2OS cells were either mock treated or treated with siRNAs that target ARHGAP11A, incubated for 48 hr, lysed, and immunoblotted with antibodies recognizing ARHGAP11A (Bethyl, top) or alpha-tubulin (bottom). The anti-ARHGAP11A recognizes a band at the same molecular weight as the HPA antibody that is significantly decreased upon siRNA depletion of ARHGAP11A. Note that alpha-tubulin levels are unchanged +/− ARHGAP11A siRNA. *Non-specific bands. DOI: http://dx.doi.org/10.7554/eLife.01630.018
Figure 11.
Figure 11.. The Encyclopedia of Proteome Dynamics, a fully searchable, open-access online repository of proteome data.
Quantitative protein and RNA data from this study are available through the Encyclopedia of Proteome Dynamics (EPD). A screenshot of the EPD is shown, which displays protein and mRNA expression profiles across the elutriated fractions, the calculated Pearson correlation coefficient between the protein and mRNA profiles, and protein and mRNA abundances in asynchronous cells for cyclin B1 (CCNB1_HUMAN). DOI: http://dx.doi.org/10.7554/eLife.01630.019
Figure 12.
Figure 12.. Many cell-line specific genes are overexpressed in tumors and normal tissues that are associated with the developmental origin of the cell line.
mRNA expression heatmaps from the Broad Global Cancer Map for NB4- and K562- specific genes (left) and HeLa-specific genes (right). Each heatmap has tissue along the horizontal axis and gene along the vertical axis. Vertical red streaks indicate that many genes are similarly overexpressed in a particular tissue. Many NB4- and K562-specific genes are overexpressed in lymphoid, leukemia, and normal hematopoietic tissues, whereas HeLa-specific genes are overexpressed in normal uterine tissues and prostate tumors. DOI: http://dx.doi.org/10.7554/eLife.01630.020

Similar articles

Cited by

  • Deep Proteome Analysis Identifies Age-Related Processes in C. elegans.
    Narayan V, Ly T, Pourkarimi E, Murillo AB, Gartner A, Lamond AI, Kenyon C. Narayan V, et al. Cell Syst. 2016 Aug;3(2):144-159. doi: 10.1016/j.cels.2016.06.011. Epub 2016 Jul 21. Cell Syst. 2016. PMID: 27453442 Free PMC article.
  • Layers of regulation of cell-cycle gene expression in the budding yeast Saccharomyces cerevisiae.
    Kelliher CM, Foster MW, Motta FC, Deckard A, Soderblom EJ, Moseley MA, Haase SB. Kelliher CM, et al. Mol Biol Cell. 2018 Nov 1;29(22):2644-2655. doi: 10.1091/mbc.E18-04-0255. Epub 2018 Sep 12. Mol Biol Cell. 2018. PMID: 30207828 Free PMC article.
  • Quantitative analysis of how Myc controls T cell proteomes and metabolic pathways during T cell activation.
    Marchingo JM, Sinclair LV, Howden AJ, Cantrell DA. Marchingo JM, et al. Elife. 2020 Feb 5;9:e53725. doi: 10.7554/eLife.53725. Elife. 2020. PMID: 32022686 Free PMC article.
  • Comparative Analysis of the Transcriptome and Proteome during Mouse Placental Development.
    Abdulghani M, Song G, Kaur H, Walley JW, Tuteja G. Abdulghani M, et al. J Proteome Res. 2019 May 3;18(5):2088-2099. doi: 10.1021/acs.jproteome.8b00970. Epub 2019 Apr 15. J Proteome Res. 2019. PMID: 30986076 Free PMC article.
  • The Global Phosphorylation Landscape of SARS-CoV-2 Infection.
    Bouhaddou M, Memon D, Meyer B, White KM, Rezelj VV, Correa Marrero M, Polacco BJ, Melnyk JE, Ulferts S, Kaake RM, Batra J, Richards AL, Stevenson E, Gordon DE, Rojc A, Obernier K, Fabius JM, Soucheray M, Miorin L, Moreno E, Koh C, Tran QD, Hardy A, Robinot R, Vallet T, Nilsson-Payant BE, Hernandez-Armenta C, Dunham A, Weigang S, Knerr J, Modak M, Quintero D, Zhou Y, Dugourd A, Valdeolivas A, Patil T, Li Q, Hüttenhain R, Cakir M, Muralidharan M, Kim M, Jang G, Tutuncuoglu B, Hiatt J, Guo JZ, Xu J, Bouhaddou S, Mathy CJP, Gaulton A, Manners EJ, Félix E, Shi Y, Goff M, Lim JK, McBride T, O'Neal MC, Cai Y, Chang JCJ, Broadhurst DJ, Klippsten S, De Wit E, Leach AR, Kortemme T, Shoichet B, Ott M, Saez-Rodriguez J, tenOever BR, Mullins RD, Fischer ER, Kochs G, Grosse R, García-Sastre A, Vignuzzi M, Johnson JR, Shokat KM, Swaney DL, Beltrao P, Krogan NJ. Bouhaddou M, et al. Cell. 2020 Aug 6;182(3):685-712.e19. doi: 10.1016/j.cell.2020.06.034. Epub 2020 Jun 28. Cell. 2020. PMID: 32645325 Free PMC article.

References

    1. Ahmad Y, Boisvert FM, Lundberg E, Uhlen M, Lamond AI. 2012. Systematic analysis of protein pools, isoforms, and modifications affecting turnover and subcellular localization. Molecular & Cellular Proteomics 11:M111.013680. 10.1074/mcp.M111.013680 - DOI - PMC - PubMed
    1. Amon A, Irniger S, Nasmyth K. 1994. Closing the cell-cycle circle in yeast - G2 cyclin proteolysis initiated at mitosis persists until the activation of G1 cyclins in the next cycle. Cell 77:1037–1050. 10.1016/0092-8674(94)90443-X - DOI - PubMed
    1. Aviner R, Geiger T, Elroy-Stein O. 2013. Novel proteomic approach (PUNCH-P) reveals cell cycle-specific fluctuations in mRNA translation. Genes & Development 27:1834–1844. 10.1101/gad.219105.113 - DOI - PMC - PubMed
    1. Ballabeni A, Zamponi R, Moore JK, Helin K, Kirschner MW. 2013. Geminin deploys multiple mechanisms to regulate Cdt1 before cell division thus ensuring the proper execution of DNA replication. Proceedings of the National Academy of Sciences of the United States of America 110:E2848–E2853. 10.1073/pnas.1310677110 - DOI - PMC - PubMed
    1. Banfalvi G. 2008. Cell cycle synchronization of animal cells and nuclei by centrifugal elutriation. Nature Protocols 3:663–673. 10.1038/nprot.2008.34 - DOI - PubMed

Publication types

MeSH terms