. 2014 Feb 7;8(Suppl 1):3-15.
doi: 10.2174/2213988501408010003. eCollection 2014.

Identifying Small Molecules which Inhibit Autophagy: a Phenotypic Screen Using Image-Based High-Content Cell Analysis

Affiliations

Identifying Small Molecules which Inhibit Autophagy: a Phenotypic Screen Using Image-Based High-Content Cell Analysis

J V Peppard et al. Curr Chem Genom Transl Med. .

Abstract

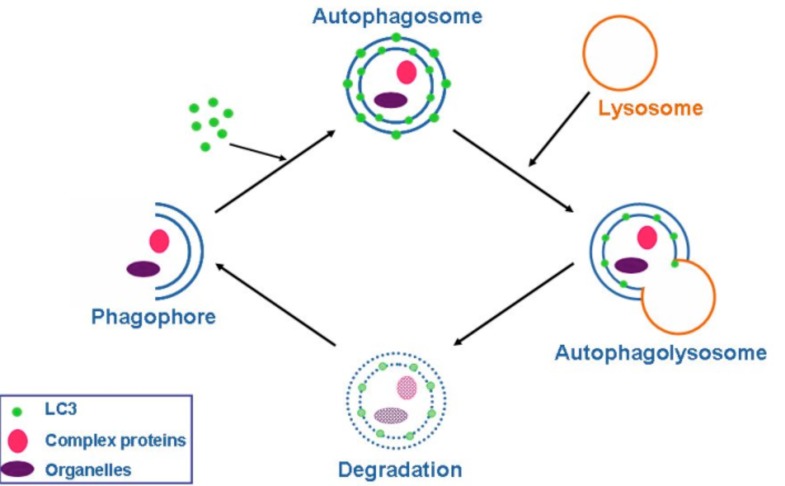
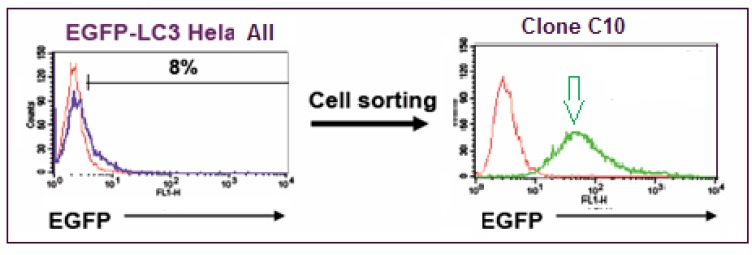
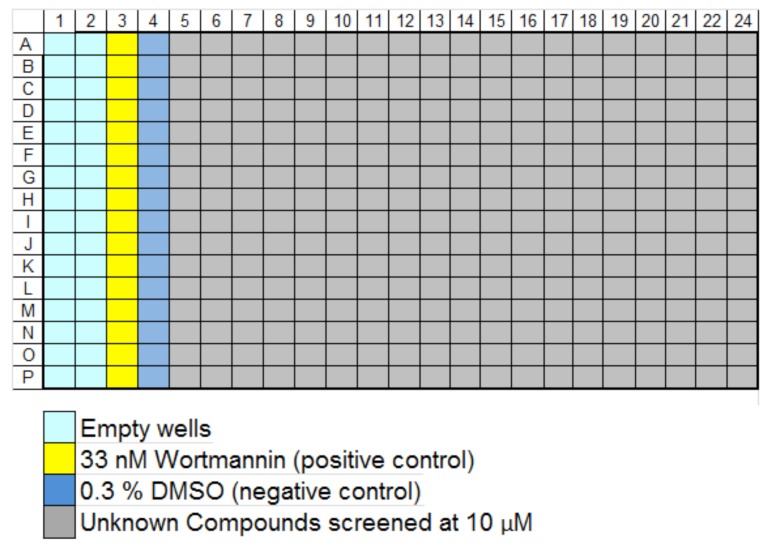
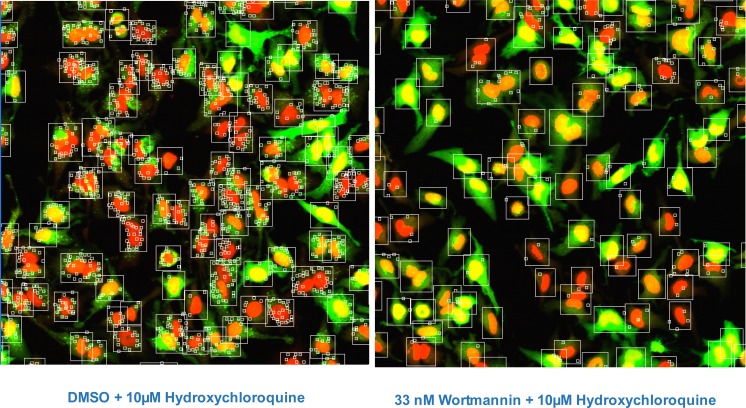
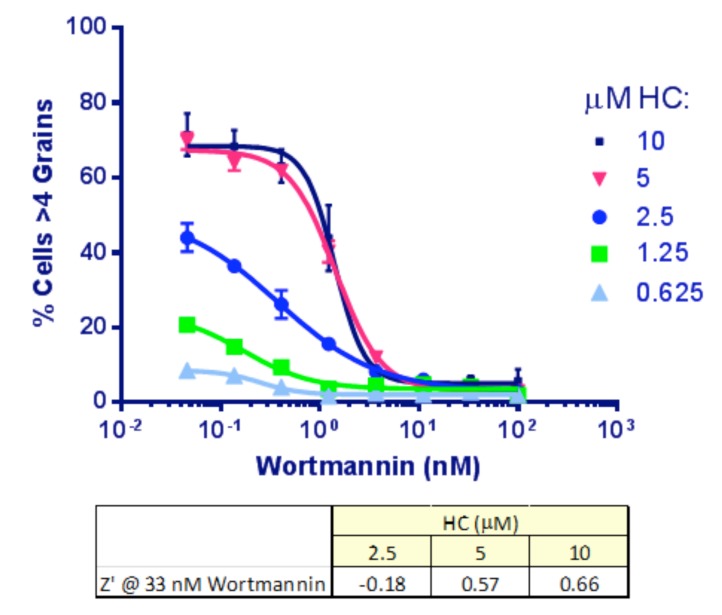
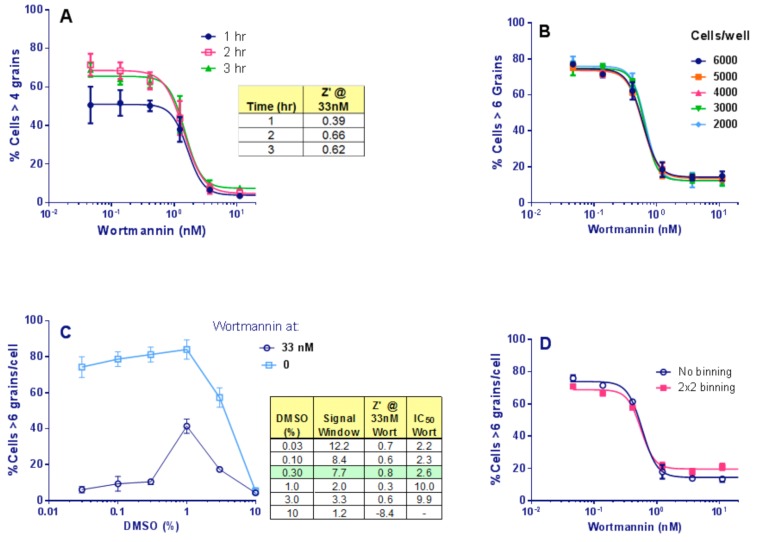
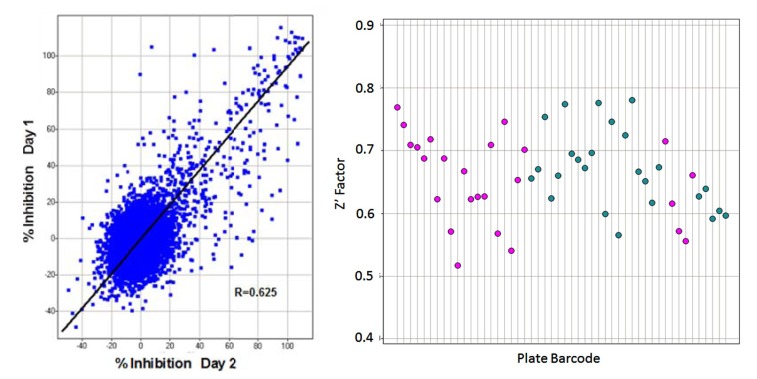
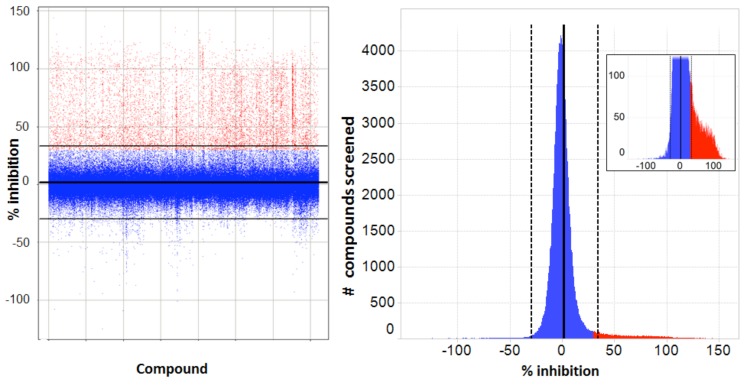
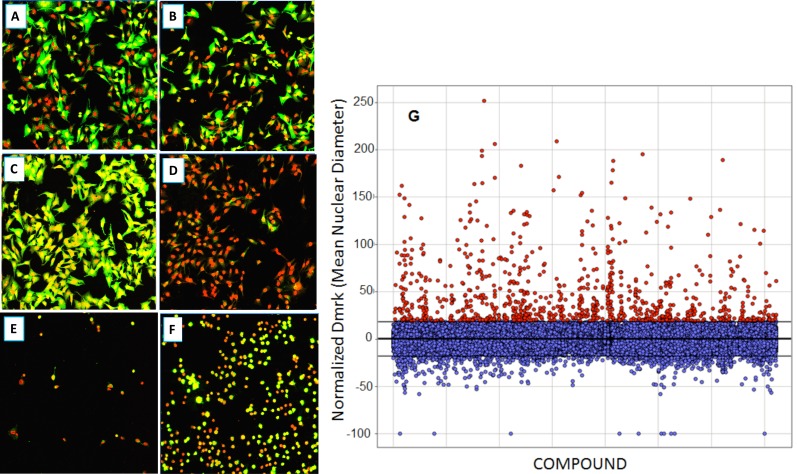
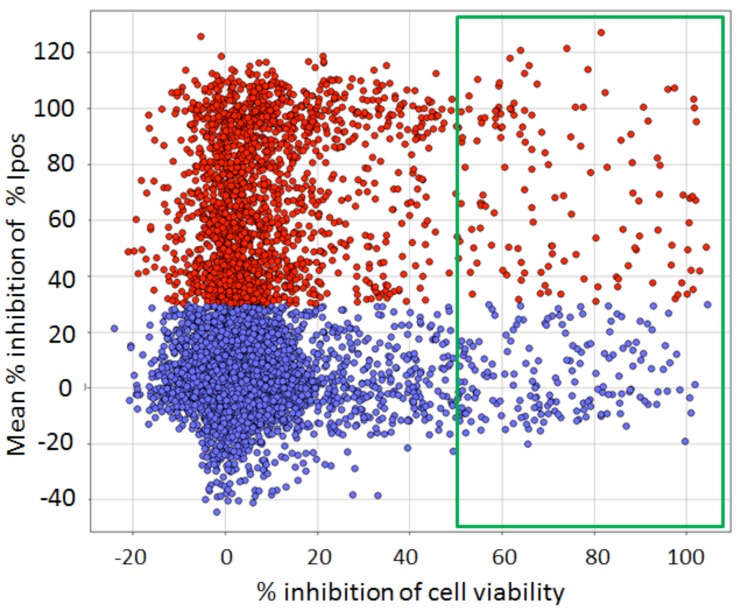
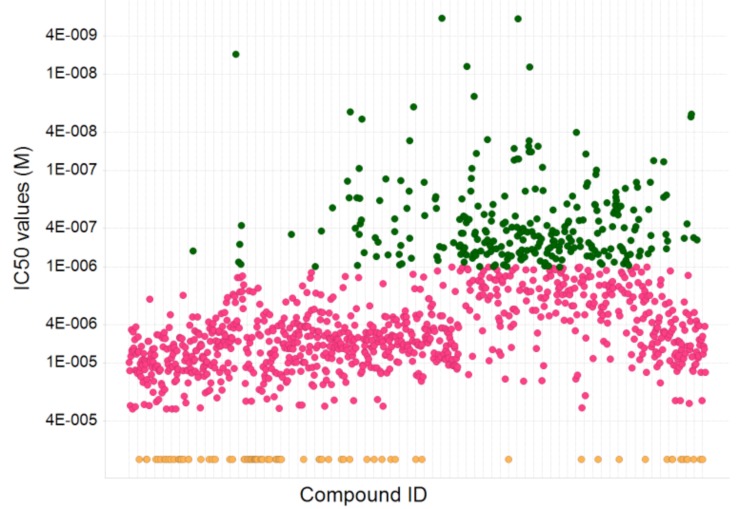
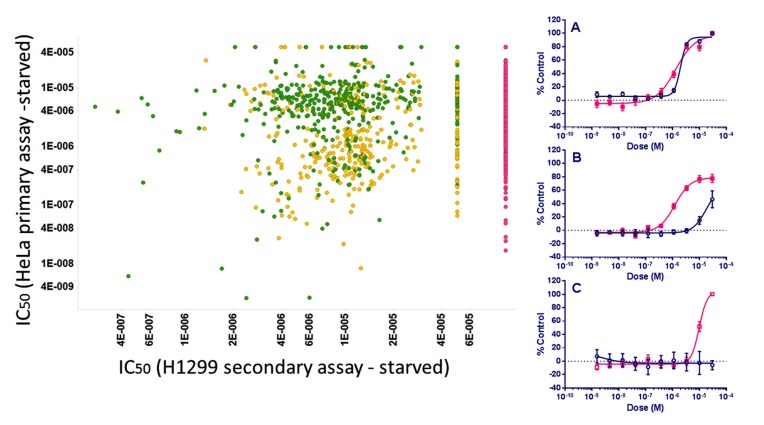
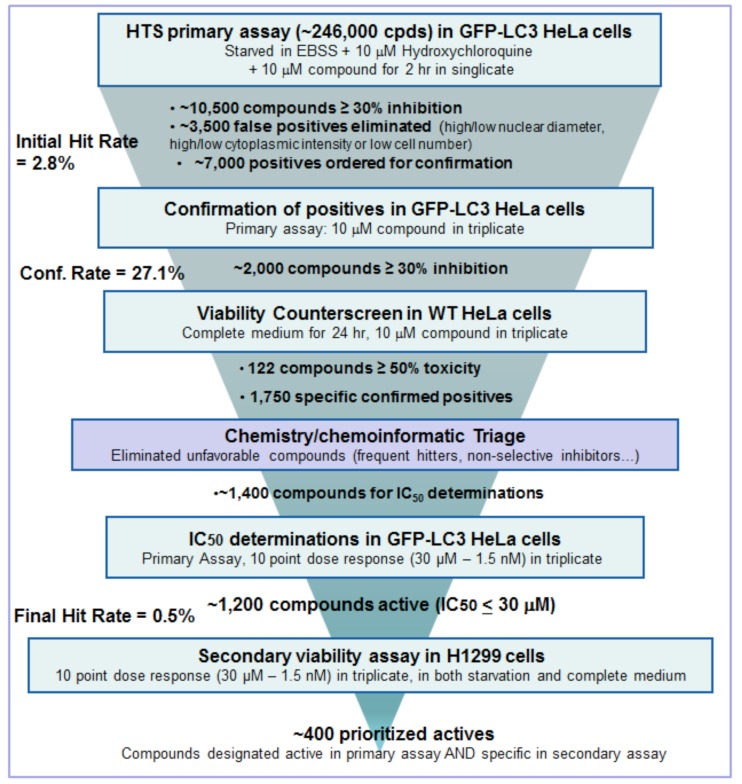
Autophagy plays an important role in cancer and it has been suggested that it functions not only as a tumor suppressor pathway to prevent tumor initiation, but also as a pro-survival pathway that helps tumor cells endure metabolic stress and resist death triggered by chemotherapeutic agents, including acquired resistance. We aimed to identify small-molecule autophagy inhibitors using a HTS/HCA approach through a phenotypic, cell image-based assay, in order to screen multiple biological targets simultaneously and to screen compounds in a physiologically relevant environment. LC3 is a component of the autophagosome, which undergoes a cytoplasmic redistribution from diffuse to punctate dots during autophagy. We employed HeLa cells stably expressing EGFP-LC3 in a primary phenotypic screen. As a first step, a "Validation Library" of about 8,000 pre-selected compounds, about 25% of which had known biological activity and the others representing a range of chemical structures, was run in duplicate both to assess screening suitability and likely hit rate, and to give a valuable preview of possible active structures or biological targets. The primary screen of about 0.25 million compounds yielded around 10,500 positive compounds. These were tested in a suite of further cellular assays designed to eliminate unwanted positives, together with the application of chemi- and bioinformatics to pick out compounds with known biological activity. These processes enabled the selection of compounds that were the most promisingly active and specific. The screening "tree" identified, amongst others with as yet unidentified targets, chemical series active against autophagy-relevant biological targets ULK or Vsp34, validating the phenotypic screening methods selected. Finally, about 400 compounds were fully qualified after following this triage. The development of the assays, compound screening process and the compound triage is described.

Keywords: HTS; LC3; autophagy; high-content screening.; image-based screening; inhibitors; phenotypic screening.


Figures

Fig. (1)
Fig. (1)
Schematic outline of the autophagy process. LC3 distribution in the cytoplasm changes once autophagy is initiated as the molecules cluster in double membraned organelles called autophagosomes. These fuse with the single membraned lysosomes, and finally the autophagosomes are degraded. Hydroxychloroquine inhibits the lysosomal degradation step.
Fig. (2)
Fig. (2)
Flow cytometry analysis of the EGFP-LC3 HeLa cell population before clonal selection (left panel, blue line) and after (right panel, green line), where 8 % of the population were expressing EGFP-LC3, compared to WT HeLa cells (red line). Clone C10 (green line/green arrow) was produced by single-cell sorting of the mixed population, expanded, and selected because of its high fluorescent signal.
Fig. (3)
Fig. (3)
Plate map of controls and compounds for primary screening. Compounds were run at 10 μM in singlicate (320/plate), along with 16 of each control type on every plate. The results from the compounds were normalized as % plate controls, where appropriate for the feature measured; features such as Npass (nucleus number) were treated as raw data.
Fig. (4)
Fig. (4)
Images of HeLa-EGFP-LC3 cells after 2 hr starvation; cells were stained with Draq5 to indicate nuclei (red, Channel 1), EGFP-LC3 is shown in green (Channel 2). The algorithm Granularity Analysis Module GRN1 was applied to first identify cell cytoplasm by expanding out a set number of pixels from the nucleus boundary designated in Channel 1 (large box) and then identify EGFP-autphagosomes located within the cell mask, which are counted as “grains” (small boxes). Other measurements are also made, e.g. brightness of objects in each Channel; nuclear size and cytoplasm area. Typical images of the assay controls are shown; the left panel shows cells after 2 hr starvation and the right shows cells after 2 hr starvation in the presence of the inhibitor wortmannin.
Fig. (5)
Fig. (5)
Dose response to wortmannin and HC in Clone 10 cells. Each point represents Mean ± SD for 6 replicates. HC inhibits the lysosomal degradation of the autophagosomes so that more accumulate for imaging with increasing doses of HC. Wortmannin IC50 was similar at 5 and 10 μM HC (1.4 nM). A dose of 33 nM for wortmannin and 10 μM for HC was selected to produce a good signal: background and best Z’.
Fig. (6)
Fig. (6)
Assay development. (A): Time of starvation of Clone 10 cells in the presence of wortmannin. Points show Mean ± SD for 4 replicates. The signal was stable by 2 hr starvation and was not improved at 3 hr (Table). (B): Titration of number of Clone 10 cells/well, in the presence of wortmannin under starvation conditions for 2 hr. Bars show Mean ± SD for 4 replicates. The response to wortmannin was similar at all cell densities and the Z’ was stable at 0.80 ± 0.04 across the range. A cell concentration of 4,000/well was selected. (C): DMSO titration for Clone 10 cells ± 33 nM wortmannin under starvation conditions for 2 hr. Points are Mean ± SD for 4 replicates. Table: for each DMSO %, the Z’ was calculated from the 33 nM vs. 0 nM wortmannin value; Signal Window was the ratio of the same values. No effect of DMSO was seen ≤ 0.3% DMSO. (D): Effect of binning images of Clone 10 cells, 4000 cells/well in the presence of wortmannin under starvation conditions for 2 hr. The same cell images were used with and without applying 2x2 binning. Points are Mean ± SD for 4 replicates. No effect of binning on the Z’ (0.82 vs. 0.79) or wortmann in IC50 values was observed.
Fig. (7)
Fig. (7)
Assay Qualification. Left: Correlation plot in Spotfire from % inhibition of autophagy on Day 1 vs. Day 2 of the Validation Screen. From 8,000 compounds (25 plates) screened and setting a threshold of >30% inhibition of the positive control, the hit rate on Day 1 was 3.0% vs. 3.2% on Day 2. Confirmation of positive compounds between Day 1 and 2 averaged 69%. Right: Z’ for control wells of individual plates (n=16 for each control, every plate) run for assay validation on Day 1 (pink) and 2 (blue). All plates were >0.5, with the Mean Z’ being 0.66. These Z’ were predictive of the HTS assay itself, indicating a robust assay. Where Z’ <0.5, the plate was repeated.
Fig. (8)
Fig. (8)
Primary screen - Spotfire plots of results. Left: scatter plot (each point is a separate compound) with normalized results for primary screening (% inhibition of autophagy vs. compound tested). Horizontal lines represent Mean with ranges ± 2 x SD (Mean = 1.8 ± 15.9). Compounds were selected positive at ≥ 30% inhibition and are marked in red, rejected compounds in blue. Right: values binned as a histogram of activity distribution of all compounds marked as for the Scatter plot; inset is an expanded view of the distribution of selected positives.
Fig. (9)
Fig. (9)
Compound qualification: example images (20x) of cells after treatment with compounds excluded through the secondary data analysis; Green – EGFP channel fluorescence, Red – nuclear channel fluorescence. (A): Positive control (0.3% DMSO); (B): Negative Control (33 nM wortmannin); (C): Fluorescent compound; (D): EGFP quenching compound; (E): very toxic compound; (F): somewhat toxic compound. Data associated are shown in Table 2. (G): Re-analysis of primary screen image data to remove fluorescent compounds. Compounds were removed that increased the normalized Dmrk (average nuclear diameter) or Icyt (average intensity in cytoplasmic region) values by more than 3 SDs from mean values (Mean = 0.06±6.05 – horizontal lines).
Fig. (10)
Fig. (10)
Confirmation of the primary screen compounds (Y axis) vs. viability counterscreen (X axis). Compounds were run at 10 μM in triplicate. Data are normalized as the % of controls on each test plate; each point is the Mean of 3 replicates. Unconfirmed screening hits are marked in blue; confirmed positives are marked in red. Compounds with ≥ 50 % inhibition of cell viability in the counterscreen are in the green box. Of the confirmed positives, 122 showed ≥ 50% inhibition of cell viability (red points in green box) and were eliminated from further consideration.
Fig. (11)
Fig. (11)
Distribution of IC50 values of ~1,400 compounds tested in a dose response ranging from 2 nM to 30 μM. About 1200 compounds gave IC50 values of < 30 μṂ and of these, 280 compounds gave sub-μM values (green); 79 compounds were classed as inactive (IC50>30 μM) (orange).
Fig. (12)
Fig. (12)
Left: Dose response IC50 values (M) of ~1,200 compounds which were designated Active in the Primary and Counter screen assays in EGFP-LC3-HeLa cells plotted vs. their cytotoxicity activity in the Secondary starvation assay in H1299 cells. So that they appear on the plot, compounds are set to 100 μM activity if inactive (red, n = ~450), and those with IC50 values > 30 μM are set to 50 μM (n= ~50). For the two secondary assays in H1299 cells, compounds designated Active Specific (green) were compounds which gave IC50 values in the starvation medium which were 3x or more lower than in the parallel assay in full growth medium (~400 compounds). Active Non-specific compounds (yellow) have similar IC50 values in both formats. Right: Examples of compound dose responses obtained in the secondary assay (pink: starved; blue: full growth medium). (A): Active Non-specific, (B) and (C): Active Specific.
Fig. (13)
Fig. (13)
Screening tree of HTS process.

References

    1. Rubinsztein DC, Codogno P, Levine B. Autophagy modulation as a potential therapeutic target for diverse diseases. Nat Rev Drug Discov. 2012;11:709–30. - PMC - PubMed
    1. Choi AMK, Ryter SW, Levine B. Autophagy in human health and disease. N Engl J Med. 2013;368:651–62. - PubMed
    1. Codogno P, Merhpour M, Proikas-Cezanne T. Canonical and non-canonical autophagy: variations on a common theme of self-eating? Nat Rev Mol Cell Biol. 2012;13:7–12. - PubMed
    1. Klionsky DJ, Abeliovich H, Agostinis P, et al. Guidelines for the use and interpretation of assays for monitoring autophagy in higher eukaryotes. Autophagy. 2008;4:151–75. - PMC - PubMed
    1. Mizushima N, Yoshimori T, Levine B. Methods in mammalian autophagy research. Cell. 2010;140:313–25. - PMC - PubMed

LinkOut - more resources