

Increased drug resistance is associated with reduced glucose levels and an enhanced glycolysis phenotype
- PMID: 24597478
- PMCID: PMC4080979
- DOI: 10.1111/bph.12668
Increased drug resistance is associated with reduced glucose levels and an enhanced glycolysis phenotype
Abstract
Background and purpose: The testing of anticancer compounds in vitro is usually performed in hyperglycaemic cell cultures, although many tumours and their in vivo microenvironments are hypoglycaemic. Here, we have assessed, in cultures of tumour cells, the effects of reduced glucose levels on resistance to anticancer drugs and investigated the underlying cellular mechanisms.
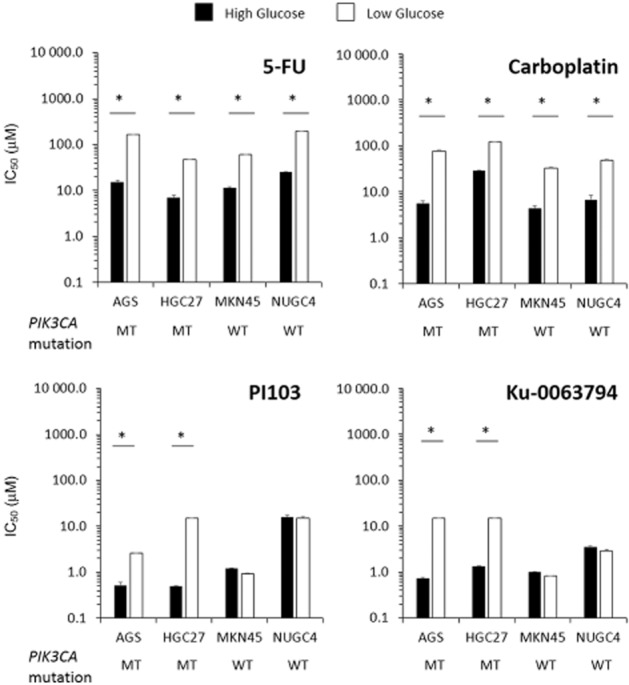
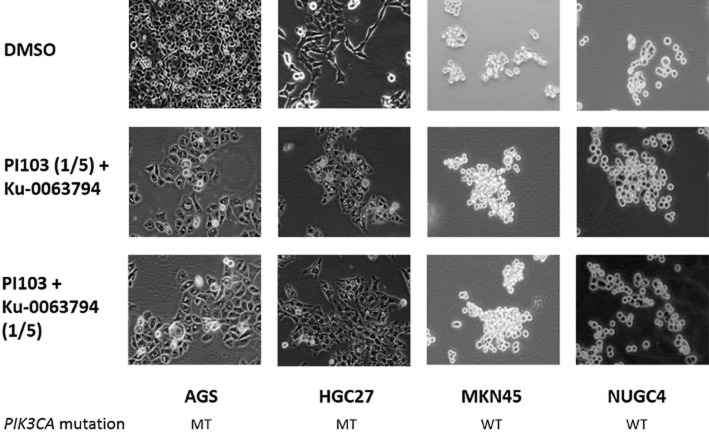
Experimental approach: PIK3CA mutant (AGS, HGC27), and wild-type (MKN45, NUGC4) gastric cancer cells were cultured in high-glucose (HG, 25 mM) or low-glucose (LG, 5 mM) media and tested for sensitivity to two cytotoxic compounds, 5-fluorouracil (5-FU) and carboplatin, the PI3K/mTOR inhibitor, PI103 and the mTOR inhibitor, Ku-0063794.
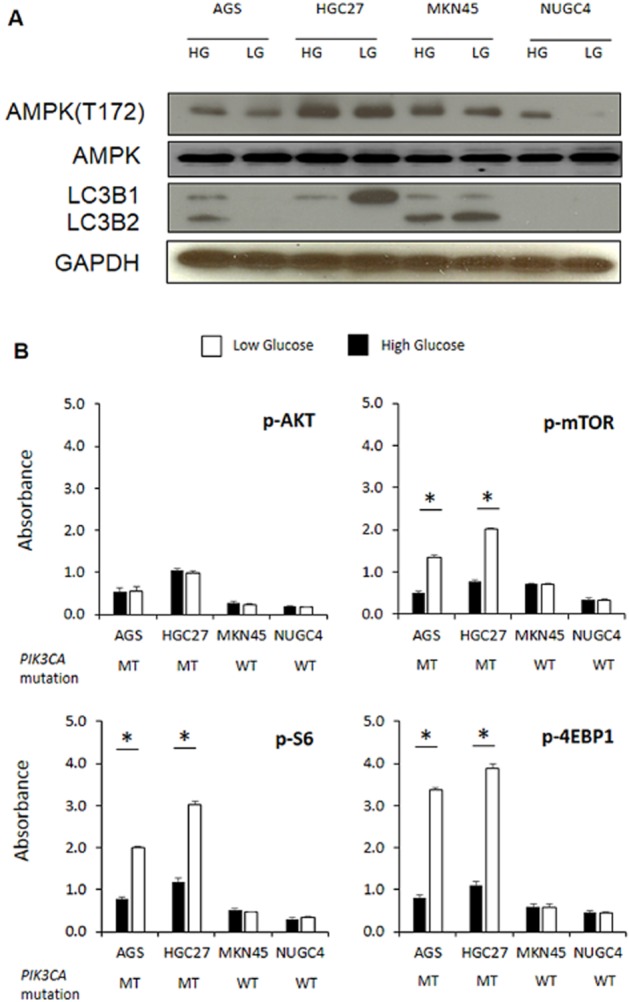
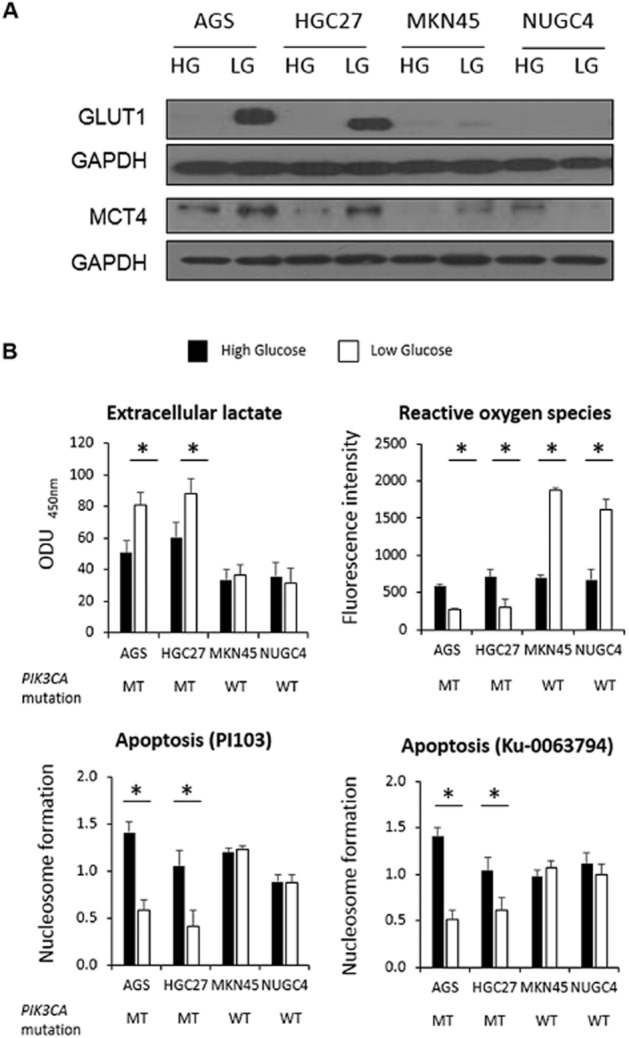
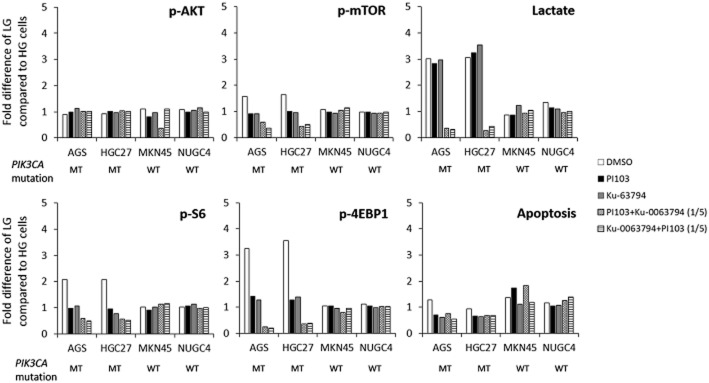
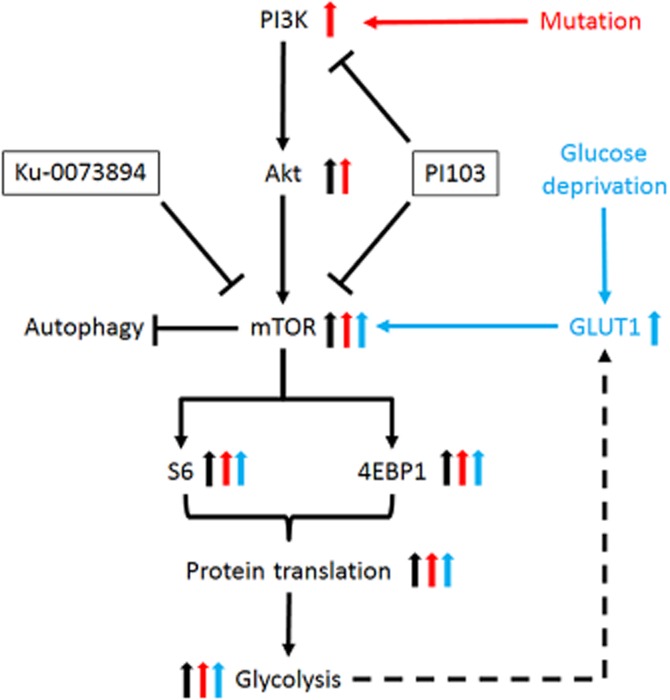
Key results: All cells had increased resistance to 5-FU and carboplatin when cultured in LG compared with HG conditions despite having similar growth and cell cycle characteristics. On treatment with PI103 or Ku-0063794, only the PIK3CA mutant cells displayed increased resistance in LG conditions. The PIK3CA mutant LG cells had selectively increased p-mTOR, p-S6, p-4EBP1, GLUT1 and lactate production, and reduced reactive oxygen species, consistent with increased glycolysis. Combination analysis indicated PI103 and Ku-0063794 were synergistic in PIK3CA mutant LG cells only. Synergism was accompanied by reduced mTOR signalling and increased autophagy.
Conclusions and implications: Hypoglycaemia increased resistance to cytotoxic agents, especially in tumour cells with a high dependence on glycolysis. Dual inhibition of the PI3K/mTOR pathway may be able to attenuate such hypoglycaemia-associated resistance.
Keywords: PI3K; chemoresistance; glycolysis; hypoglycaemia; metabolism.
© 2014 The British Pharmacological Society.
Figures
Similar articles
-
Pharmacologic synergy between dual phosphoinositide-3-kinase and mammalian target of rapamycin inhibition and 5-fluorouracil in PIK3CA mutant gastric cancer cells.Cancer Biol Ther. 2012 Jan 1;13(1):34-42. doi: 10.4161/cbt.13.1.18437. Cancer Biol Ther. 2012. PMID: 22336586
-
Chloroquine overcomes resistance of lung carcinoma cells to the dual PI3K/mTOR inhibitor PI103 by lysosome-mediated apoptosis.Anticancer Drugs. 2013 Jan;24(1):14-9. doi: 10.1097/CAD.0b013e32835a36db. Anticancer Drugs. 2013. PMID: 23111416
-
Synergistic effects of targeted PI3K signaling inhibition and chemotherapy in liposarcoma.PLoS One. 2014 Apr 2;9(4):e93996. doi: 10.1371/journal.pone.0093996. eCollection 2014. PLoS One. 2014. PMID: 24695632 Free PMC article.
-
Synthetic lethal interaction between PI3K/Akt/mTOR and Ras/MEK/ERK pathway inhibition in rhabdomyosarcoma.Cancer Lett. 2013 Sep 1;337(2):200-9. doi: 10.1016/j.canlet.2013.05.010. Epub 2013 May 16. Cancer Lett. 2013. PMID: 23684925
-
Critical role of mTOR in regulating aerobic glycolysis in carcinogenesis (Review).Int J Oncol. 2021 Jan;58(1):9-19. doi: 10.3892/ijo.2020.5152. Epub 2020 Nov 25. Int J Oncol. 2021. PMID: 33367927 Review.
Cited by
-
CD147 Mediates 5-Fluorouracil Resistance in Colorectal Cancer by Reprogramming Glycolipid Metabolism.Front Oncol. 2022 Jul 11;12:813852. doi: 10.3389/fonc.2022.813852. eCollection 2022. Front Oncol. 2022. PMID: 35898887 Free PMC article.
-
Elucidating cancer metabolic plasticity by coupling gene regulation with metabolic pathways.Proc Natl Acad Sci U S A. 2019 Feb 26;116(9):3909-3918. doi: 10.1073/pnas.1816391116. Epub 2019 Feb 7. Proc Natl Acad Sci U S A. 2019. PMID: 30733294 Free PMC article.
-
Clinicopathological characteristics, molecular features and novel diagnostic strategies for the detection of malignant transformation of endometriosis (Review).Exp Ther Med. 2023 Apr 24;25(6):279. doi: 10.3892/etm.2023.11978. eCollection 2023 Jun. Exp Ther Med. 2023. PMID: 37206546 Free PMC article. Review.
-
Curcumin Inhibits the PPARδ-p-Akt-GLUT1 Pathway and Ameliorates the Antiproliferative Effects of Doxorubicin in MDA-MB-231 Cells.Asian Pac J Cancer Prev. 2024 Mar 1;25(3):1035-1043. doi: 10.31557/APJCP.2024.25.3.1035. Asian Pac J Cancer Prev. 2024. PMID: 38546086 Free PMC article.
-
Multifunctional microfluidic chip for cancer diagnosis and treatment.Nanotheranostics. 2021 Jan 1;5(1):73-89. doi: 10.7150/ntno.49614. eCollection 2021. Nanotheranostics. 2021. PMID: 33391976 Free PMC article. Review.
References
-
- Airley RE, Mobasheri A. Hypoxic regulation of glucose transport, anaerobic metabolism and angiogenesis in cancer: novel pathways and targets for anticancer therapeutics. Chemotherapy. 2007;53:233–256. - PubMed
-
- Alexander A, Walker CL. The role of LKB1 and AMPK in cellular responses to stress and damage. FEBS Lett. 2011;585:952–957. - PubMed
-
- Berardi R, Scartozzi M, Romagnoli E, Antognoli S, Cascinu S. Gastric cancer treatment: a systematic review. Oncol Rep. 2004;11:911–916. - PubMed
Publication types
MeSH terms
Substances
LinkOut - more resources
Full Text Sources
Other Literature Sources
Medical
Miscellaneous
