. 2014;14(4):2065-70.
doi: 10.1021/nl500234t. Epub 2014 Mar 21.

Label-free, all-optical detection, imaging, and tracking of a single protein

Affiliations

Label-free, all-optical detection, imaging, and tracking of a single protein

J Ortega Arroyo et al. Nano Lett. 2014.

Abstract

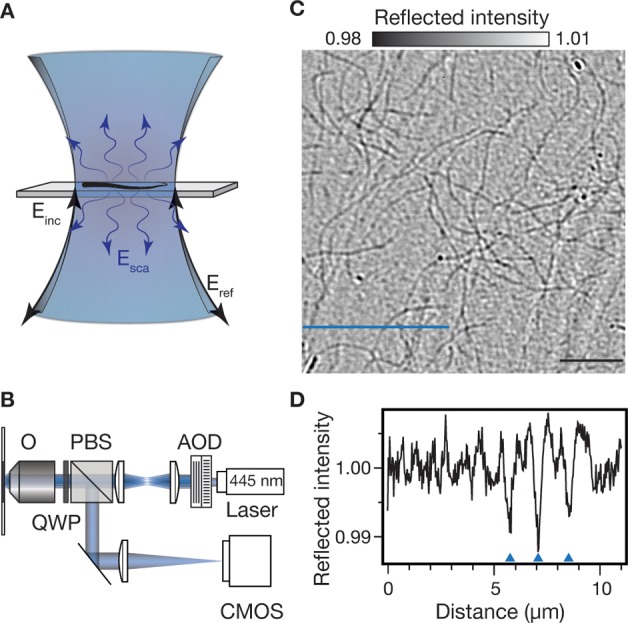
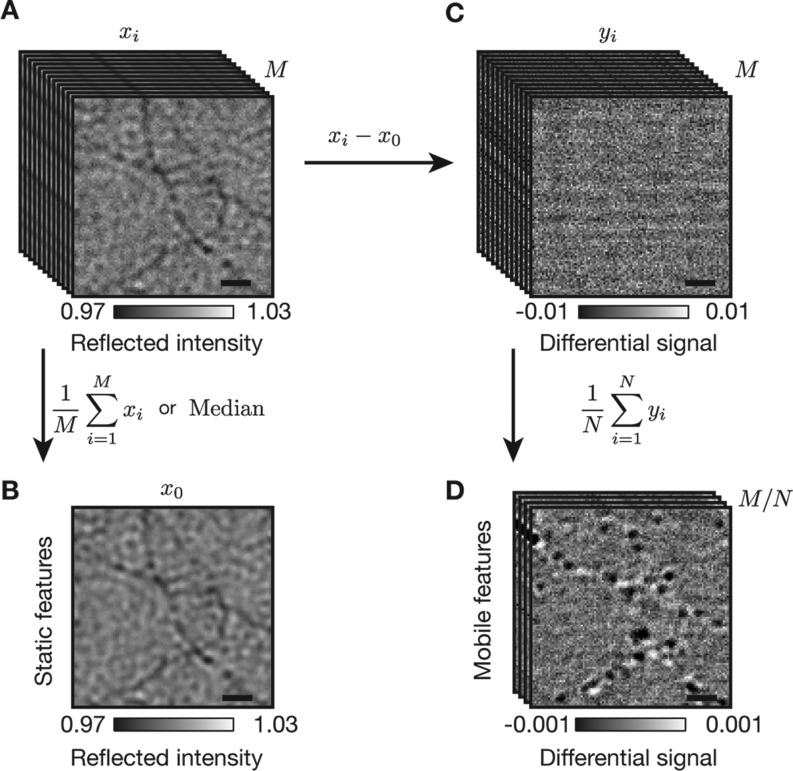
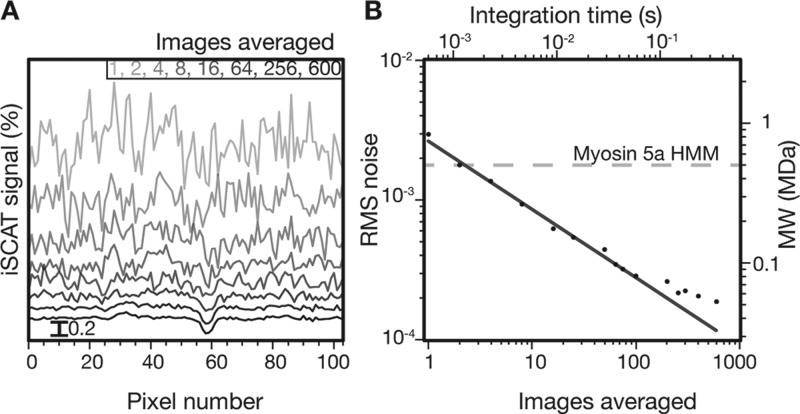
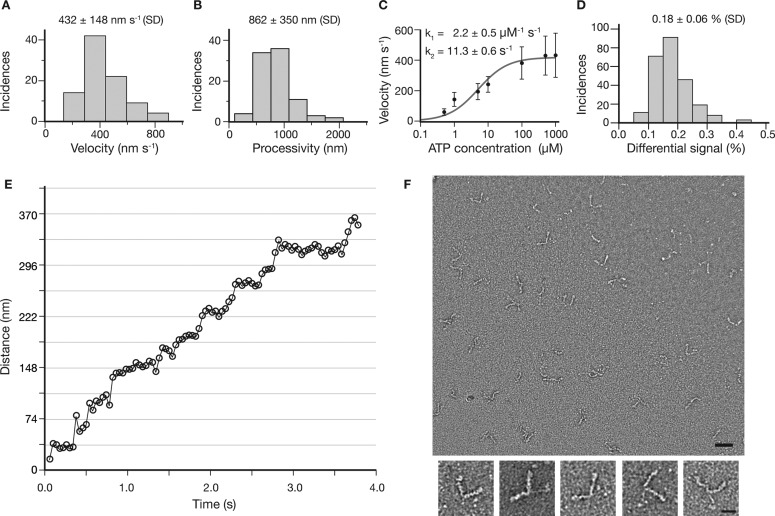
Optical detection of individual proteins requires fluorescent labeling. Cavity and plasmonic methodologies enhance single molecule signatures in the absence of any labels but have struggled to demonstrate routine and quantitative single protein detection. Here, we used interferometric scattering microscopy not only to detect but also to image and nanometrically track the motion of single myosin 5a heavy meromyosin molecules without the use of labels or any nanoscopic amplification. Together with the simple experimental arrangement, an intrinsic independence from strong electronic transition dipoles and a detection limit of <60 kDa, our approach paves the way toward nonresonant, label-free sensing and imaging of nanoscopic objects down to the single protein level.


Figures

Figure 1
Figure 1
Interferometric scattering microscopy of biomolecules. (A) Schematic of the sample region including incident Einc, reflected Eref, and scattered Esca light fields. (B) Experimental setup. O, objective; QWP, quarter wave plate; PBS, polarizing beamsplitter; AOD, acousto-optic deflector. (C) iSCAT image of individual, unlabeled actin filaments adhered to a microscope cover glass. Pixel nonuniformity and illumination inhomogeneity is removed by flat-fielding with a temporal median filter (see Methods). Scale bar: 5 μm (black line). (D) Signal profile of the blue line in (C) shows three actin filaments indicated by the blue arrowheads.
Figure 2
Figure 2
Interferometric scattering detection of myosin 5a HMM at the single molecule level. (A) Sequence containing M iSCAT images, xi, of actin filaments on a microscope cover glass in the presence of myosin 5a HMM. Camera exposure time set at 0.40 ms with a frame time of 0.58 ms, [ATP] = 5 μM. (B) An image containing purely stationary iSCAT features obtained by taking the median or averaging over the sequence of images in (A). (C) Sequence of M differential iSCAT images, yi, obtained by subtracting the stationary iSCAT features from the image sequence in (A). (D) Time-averaged differential images generated by binning N = 170 consecutive frames together. Note the order of magnitude decrease in z-scale from (C) to (D). Scale bars: 1 μm (black line).
Figure 3
Figure 3
iSCAT as an all-optical single protein sensor. (A) One-dimensional cut across a single differential myosin 5a HMM iSCAT signal for integration times ranging from 0.58 to 348.00 ms. The signal in (A) is assigned to be a single myosin 5a HMM molecule due to its processive nature, characteristic 37 nm steps, and contrast value of 0.18%. The cross section was chosen along the x-axis with no particular orientation relative to the underlying actin filament whose iSCAT signal is removed by the differential imaging scheme. (B) Background noise as a function of the number of averaged images. Solid line indicates shot noise behavior. We added a second vertical axis corresponding to the molecular weight detectable at a signal-to-noise ratio of 1 as a function of integration time. In the case of myosin 5a, this number corresponds to 1 ms. The dashed gray line represents the molecular weight of myosin 5a HMM. The detection limit thus corresponds to 60 kDa at an integration time of 300 ms in the current experimental arrangement.
Figure 4
Figure 4
Myosin 5a HMM processivity characterized by iSCAT at the single molecule level. (A,B) Velocity and processivity at saturating ATP concentrations (1 mM, n = 91). (C) Velocity as a function of ATP concentration. The solid curve represents the best fit of the velocity data to the relationship V = ds/(1/k1[ATP] + 1/k2), where ds represents the average step size assumed to be 37 nm, k1 is the second order ATP binding rate constant, and k2 is the first order ADP release rate constant. (D) Histogram of iSCAT contrasts obtained from finding the center of mass of 249 separate processive molecules. All visible processive signatures from 15 recordings were included in the histogram and no additional preselection was performed. Data was originally recorded at 1.7 kHz and then 170 consecutive frames were averaged together for this analysis. (E) Distance traveled for a single myosin 5a molecule with contrast of 0.31% at 10 μM ATP concentration. Imaging speed: 1 kHz averaged to 25 Hz (see Supporting Information Movie S4). (F) Sample quality assessment of myosin 5a HMM used in this study by electron microscopy. Upper panel shows an electron micrograph of the construct, scale bar: 50 nm. Lower panels show examples of individual myosin 5a HMM molecules at higher magnification, scale bar: 20 nm. The sample was confirmed to be without aggregates and dimeric with bound light chains.

References

    1. Moerner W. E.; Kador L. Phys. Rev. Lett. 1989, 62, 2535–2538. - PubMed
    1. Orrit M.; Bernard J. Phys. Rev. Lett. 1990, 65, 2716–2719. - PubMed
    1. Dickson R. M.; Cubitt A. B.; Tsien R. Y.; Moerner W. E. Nature 1997, 388, 355–358. - PubMed
    1. Enderlein J.; Toprak E.; Selvin P. R. Opt. Express 2006, 14, 8111–8120. - PubMed
    1. Nie S.; Emory S. R. Science 1997, 275, 1102–1106. - PubMed

Publication types

Substances