

Pten regulates homeostasis and inflammation-induced migration of myelocytes in zebrafish
- PMID: 24598081
- PMCID: PMC4015859
- DOI: 10.1186/1756-8722-7-17
Pten regulates homeostasis and inflammation-induced migration of myelocytes in zebrafish
Abstract
Background: Loss of the tumor suppressor phosphatase and tensin homolog (PTEN) is frequently observed in hematopoietic malignancies. Although PTEN has been implicated in maintaining the quiescence of hematopoietic stem cells (HSCs), its role in hematopoiesis during ontogeny remains largely unexplored.
Methods: The expression of hematopoietic marker genes was analyzed via whole mount in situ hybridization assay in ptena and ptenb double mutant zebrafish. The embryonic myelopoiesis was characterized by living imaging and whole mount in situ immunofluorescence with confocal microscopy, as well as cell-specific chemical staining for neutrophils and macrophages. Analyses of the involved signaling pathway were carried out by inhibitor treatment and mRNA injection.
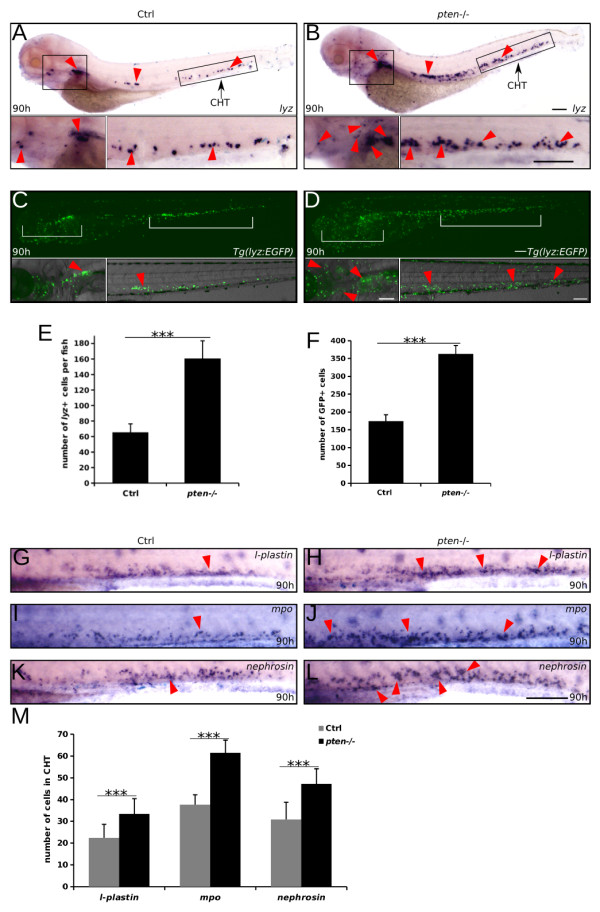
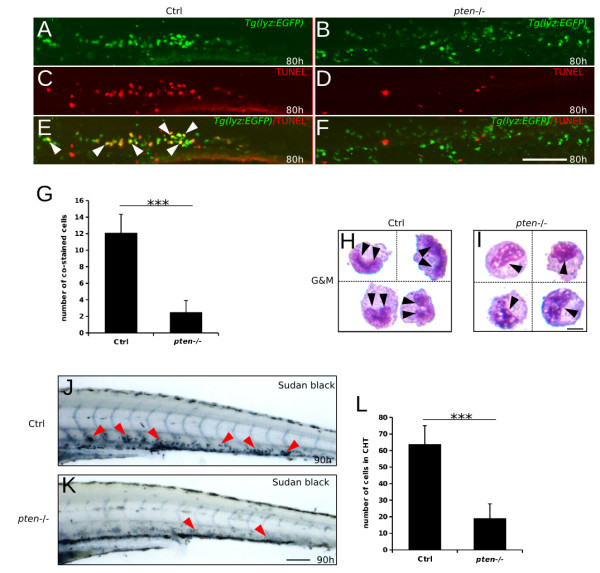
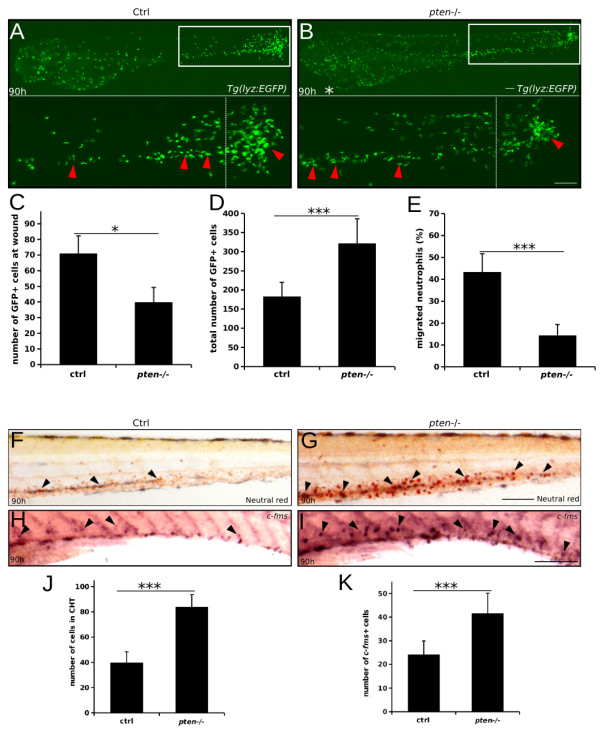
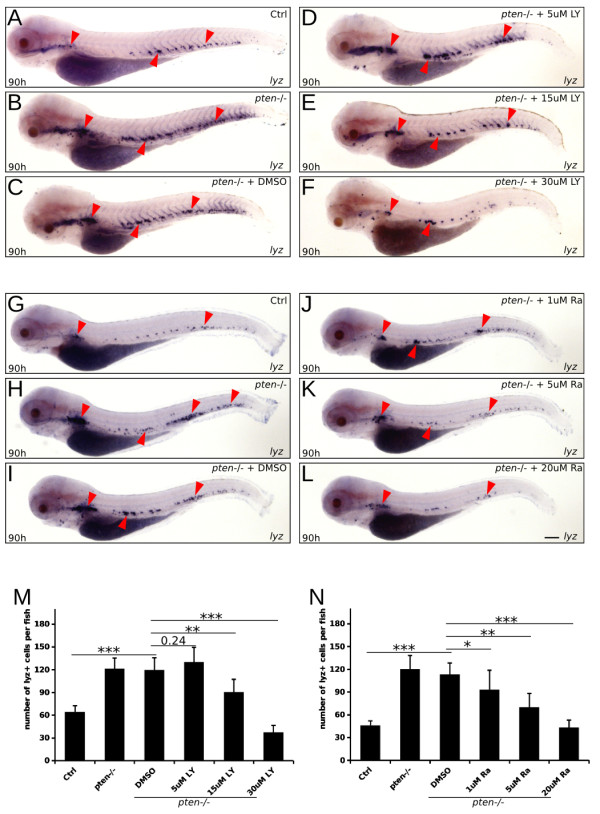
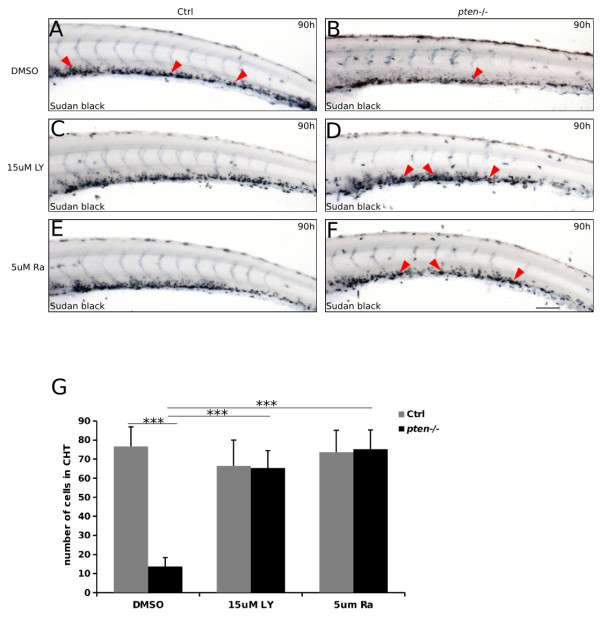
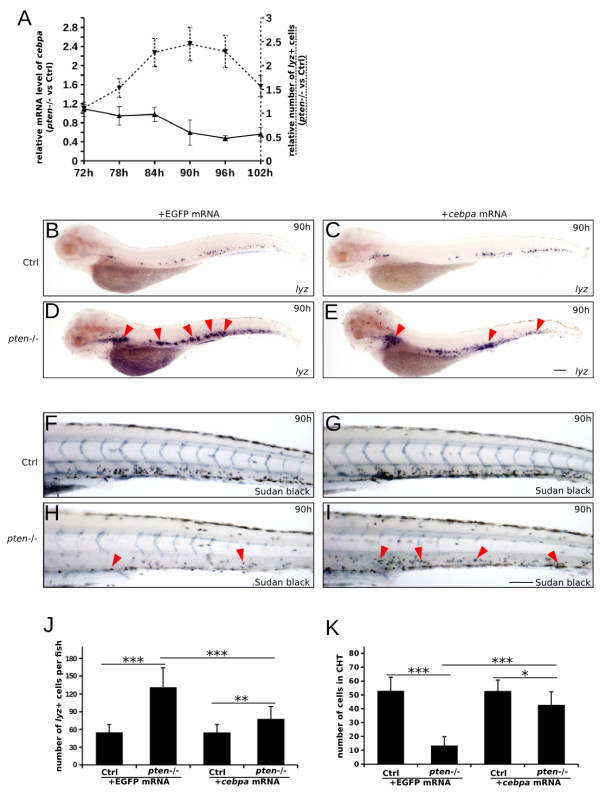
Results: Pten-deficient zebrafish embryos exhibited a strikingly increased number of myeloid cells, which were further characterized as being immune deficient. In accordance with this finding, the inhibition of phosphoinositide 3-kinase (PI3K) or the mechanistic target of rapamycin (mTOR) corrected the expansive myelopoiesis in the pten-deficient embryos. Further mechanistic studies revealed that the expression of cebpa, a critical transcription factor in myeloid precursor cells, was downregulated in the pten-deficient myeloid cells, whereas the injection of cebpa mRNA markedly ameliorated the dysmyelopoiesis induced by the loss of pten.
Conclusions: Our data provide in vivo evidence that definitive myelopoiesis in zebrafish is critically regulated by pten via the elevation of cebpa expression.
Figures
Similar articles
-
Zebrafish pten genes have overlapping and non-redundant functions in tumorigenesis and embryonic development.Oncogene. 2008 Feb 14;27(8):1079-86. doi: 10.1038/sj.onc.1210730. Epub 2007 Aug 20. Oncogene. 2008. PMID: 17704803
-
Ptena and ptenb genes play distinct roles in zebrafish embryogenesis.Dev Dyn. 2005 Dec;234(4):911-21. doi: 10.1002/dvdy.20576. Dev Dyn. 2005. PMID: 16193492 Free PMC article.
-
Pten function in zebrafish: anything but a fish story.Methods. 2015 May;77-78:191-6. doi: 10.1016/j.ymeth.2014.11.002. Epub 2014 Nov 11. Methods. 2015. PMID: 25461815 Review.
-
Impaired caudal fin-fold regeneration in zebrafish deficient for the tumor suppressor Pten.Regeneration (Oxf). 2017 Nov 10;4(4):217-226. doi: 10.1002/reg2.88. eCollection 2017 Aug. Regeneration (Oxf). 2017. PMID: 29299324 Free PMC article.
-
The PTEN tumor suppressor gene and its role in lymphoma pathogenesis.Aging (Albany NY). 2015 Dec;7(12):1032-49. doi: 10.18632/aging.100855. Aging (Albany NY). 2015. PMID: 26655726 Free PMC article. Review.
Cited by
-
Microarray and Proteomic Analyses of Myeloproliferative Neoplasms with a Highlight on the mTOR Signaling Pathway.PLoS One. 2015 Aug 14;10(8):e0135463. doi: 10.1371/journal.pone.0135463. eCollection 2015. PLoS One. 2015. PMID: 26275051 Free PMC article.
-
Zebrafish: a convenient tool for myelopoiesis research.Cell Regen. 2023 Jan 3;12(1):2. doi: 10.1186/s13619-022-00139-2. Cell Regen. 2023. PMID: 36595106 Free PMC article. Review.
-
mTORC1 mediates the expansion of hematopoietic stem and progenitor cells through ribosome biogenesis protein Urb2 in zebrafish.Stem Cell Reports. 2024 Sep 10;19(9):1277-1288. doi: 10.1016/j.stemcr.2024.07.011. Epub 2024 Aug 22. Stem Cell Reports. 2024. PMID: 39178846 Free PMC article.
-
Zebrafish pten Genes Play Relevant but Distinct Roles in Antiviral Immunity.Vaccines (Basel). 2020 Apr 26;8(2):199. doi: 10.3390/vaccines8020199. Vaccines (Basel). 2020. PMID: 32357549 Free PMC article.
-
BRD7 plays an anti-inflammatory role during early acute inflammation by inhibiting activation of the NF-кB signaling pathway.Cell Mol Immunol. 2017 Oct;14(10):830-841. doi: 10.1038/cmi.2016.31. Epub 2016 Jul 4. Cell Mol Immunol. 2017. PMID: 27374794 Free PMC article.
References
-
- Gutierrez A, Sanda T, Grebliunaite R, Carracedo A, Salmena L, Ahn Y, Dahlberg S, Neuberg D, Moreau LA, Winter SS, Larson R, Zhang J, Protopopov A, Chin L, Pandolfi PP, Silverman LB, Hunger SP, Sallan SE, Look AT. High frequency of PTEN, PI3K, and AKT abnormalities in T-cell acute lymphoblastic leukemia. Blood. 2009;114:647–650. doi: 10.1182/blood-2009-02-206722. - DOI - PMC - PubMed
-
- Yamada KM, Araki M. Tumor suppressor PTEN: modulator of cell signaling, growth, migration and apoptosis. J Cell Sci. 2001;114(Pt 13):2375–2382. - PubMed
Publication types
MeSH terms
Substances
LinkOut - more resources
Full Text Sources
Other Literature Sources
Molecular Biology Databases
Research Materials
Miscellaneous
