. 2014 May;42(9):5495-504.
doi: 10.1093/nar/gku180. Epub 2014 Mar 5.

Bacterial promoter repression by DNA looping without protein-protein binding competition

Affiliations

Bacterial promoter repression by DNA looping without protein-protein binding competition

Nicole A Becker et al. Nucleic Acids Res. 2014 May.

Abstract

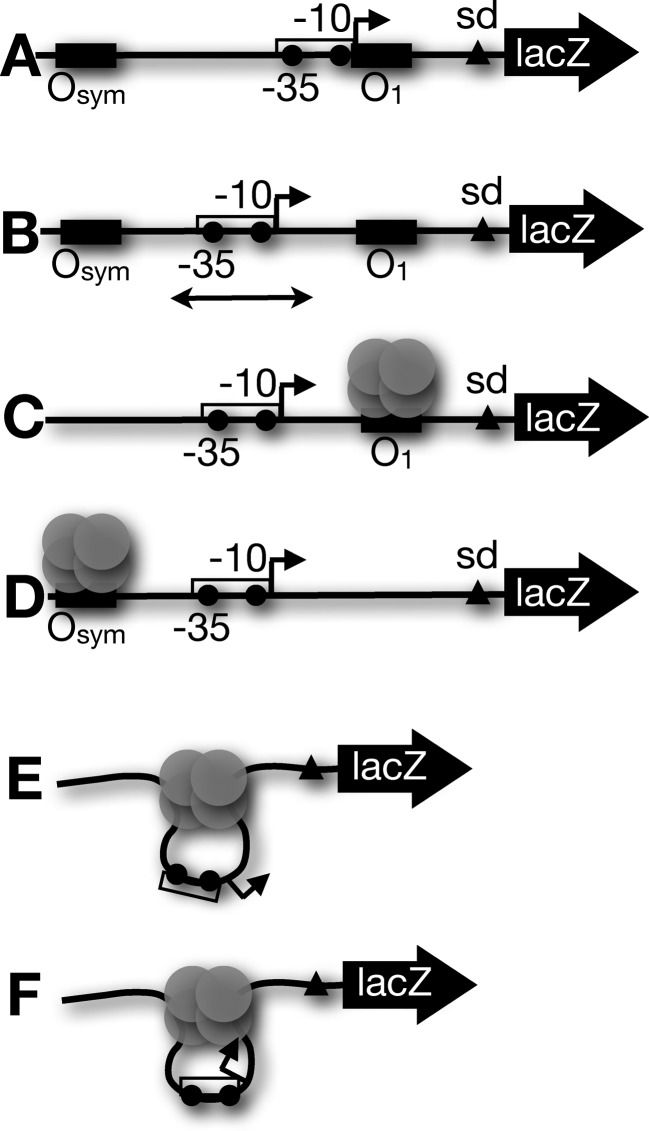
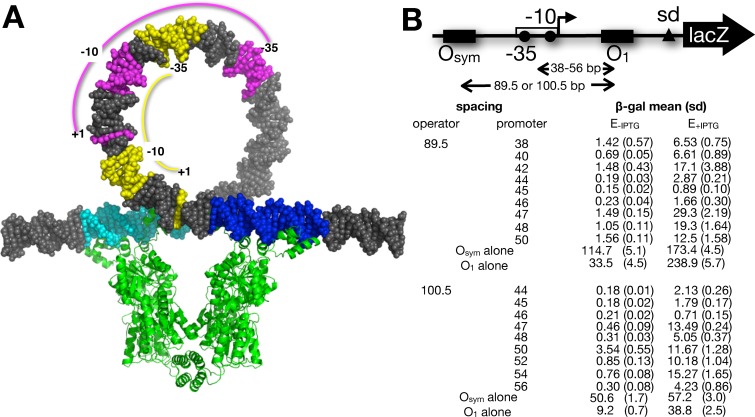
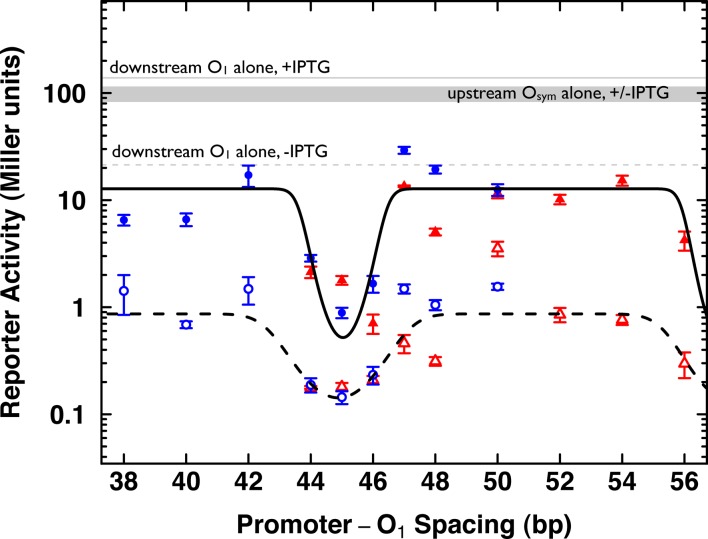
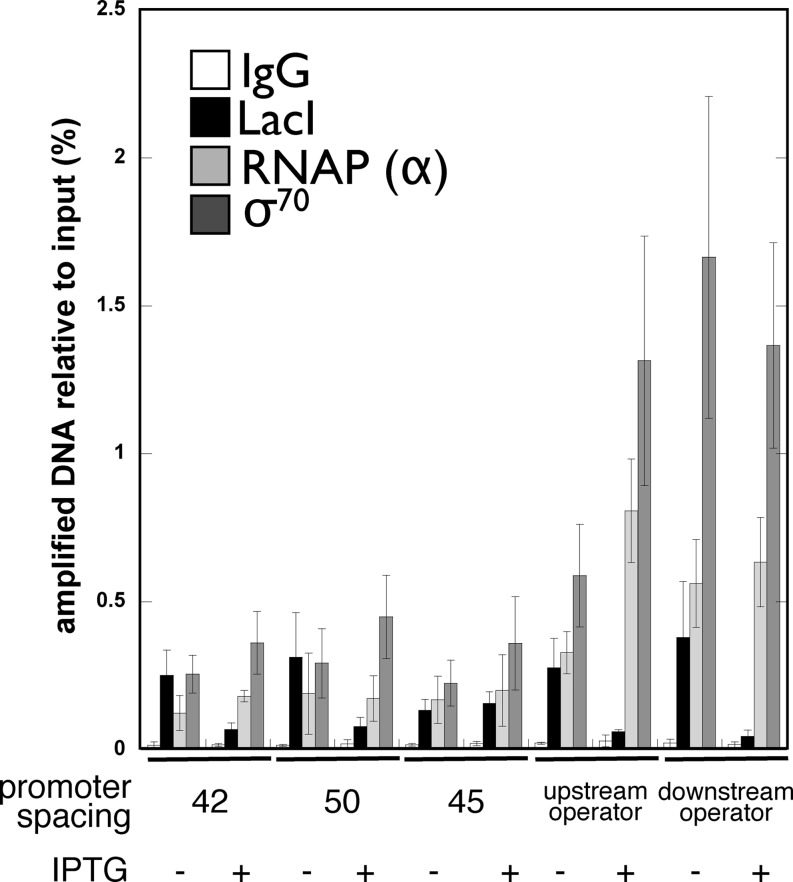
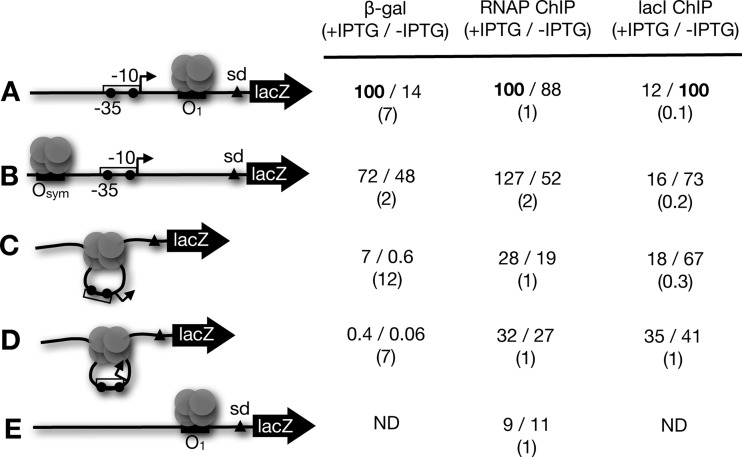
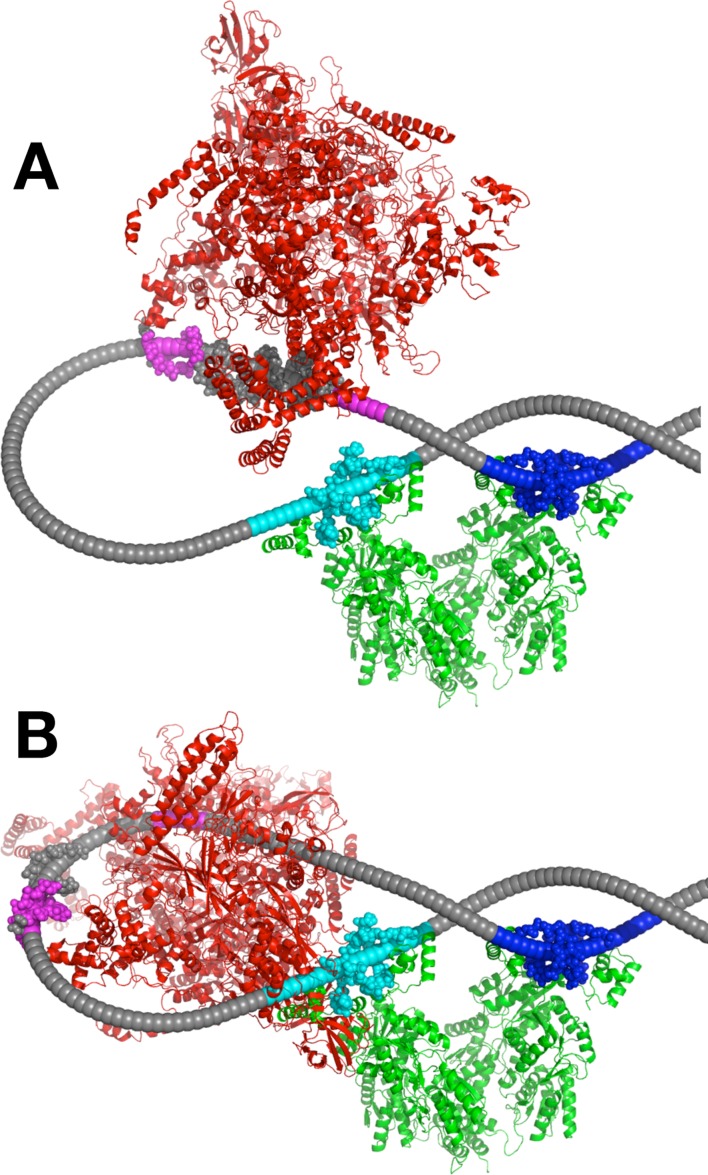
The Escherichia coli lactose operon provides a paradigm for understanding gene control by DNA looping where the lac repressor (LacI) protein competes with RNA polymerase for DNA binding. Not all promoter loops involve direct competition between repressor and RNA polymerase. This raises the possibility that positioning a promoter within a tightly constrained DNA loop is repressive per se, an idea that has previously only been considered in vitro. Here, we engineer living E. coli bacteria to measure repression due to promoter positioning within such a tightly constrained DNA loop in the absence of protein-protein binding competition. We show that promoters held within such DNA loops are repressed ∼100-fold, with up to an additional ∼10-fold repression (∼1000-fold total) dependent on topological positioning of the promoter on the inner or outer face of the DNA loop. Chromatin immunoprecipitation data suggest that repression involves inhibition of both RNA polymerase initiation and elongation. These in vivo results show that gene repression can result from tightly looping promoter DNA even in the absence of direct competition between repressor and RNA polymerase binding.


Figures

Figure 1.
Figure 1.
Schematic illustration of research design. (A) Conventional arrangement of lac operon elements. A strong lac operator (here Osym, filled rectangle) lies upstream of a promoter (open rectangle) with −35, −10 elements and transcription start point (filled circles and broken arrow, respectively) that overlap downstream operator (here O1) such that repressor and RNA polymerase directly compete for DNA. (B) Arrangement of lac elements in present study. The test promoter is positioned centrally so binding by RNA polymerase is not occluded by LacI. The promoter position can be systematically varied (double-headed arrow) to explore face-of-the-helix effects. (C) Control construct with only downstream O1 operator. (D) Control construct with only upstream Osym operator. (E) Schematic illustration of DNA looping by tetrameric LacI for a construct of the type shown in (B). Here, the promoter is exposed on the outer face of the tightly bent DNA. (F) As in (E) except the promoter has been shifted by 5 bp (one half helical turn) to face the inward surface of the looped DNA.
Figure 2.
Figure 2.
DNA looping constructs and data. (A) Scale space-filling models showing lac loop geometry studied here. 100.5 bp DNA loop is shown stabilized by the lac repressor tetramer (green; pdb code 1Z04) engaged with upstream Osym (cyan) and downstream O1 (blue) operators in the conventional model. This conventional model depicts the simplifying assumption that lac repressor does not deform its bound operators, and depiction of this conventional model is not meant to imply that there are not superior loop models. The positions of the wild-type lac promoter −35, −10 and +1 elements (yellow) are contrasted with an example of promoter elements in this study (magenta) where promoter and operator do not overlap. The diagram was rendered using the 3D-DART tool (57). (B) β-galactosidase expression data from constructs with the indicated operator and promoter spacings (mean, standard deviation in parentheses). Promoter spacing indicates distance (bp) between the center of O1 and the center of the UV5 promoter. Operator spacing indicates distance (bp) between the centers of O1 and Osym operators. Results for constructs with single operators are shown.
Figure 3.
Figure 3.
Reporter activity in vivo. β-galactosidase activity (Miller units) is shown on a logarithmic scale (y-axis) as a function of the center-to-center spacing (x-axis) between promoter and downstream O1 operator. Data from 89.5 bp (blue circles) and 100.5 bp (red triangles) constructs are shown in the absence (open symbols, dashed black fit line) and presence (filled symbols, solid black fit line) of IPTG induction. Average reporter activities of promoter constructs with an isolated downstream O1 operator in the absence (dashed gray) and presence (solid gray) of IPTG are shown. Similarly, average reporter activities for promoter constructs with an isolated upstream Osym operator in the absence or presence of IPTG fall in the gray shaded region of the graph. Black lines show best fits to a thermodynamic model of promoter accessibility.
Figure 4.
Figure 4.
Chromatin immunoprecipitation data. Quantitation of amplified immunoprecipitated DNA is indicated as a percentage of input for the indicated conditions within the indicated 89.5 bp DNA looped constructs and controls and for antibodies with the indicated specificities (or IgG control).
Figure 5.
Figure 5.
Summary of gene expression and protein cross-linking data. Representative schematic illustrations (left) are shown with data normalized to the maximum signal (set to 100) for both β-galactosidase reporter (first data column) and ChIP data for RNA polymerase (RNAP; second data column) or LacI (third data column). The first value in each data pair represents inducing conditions. The ratio of normalized values is shown in parentheses below. ND: not done.
Figure 6.
Figure 6.
Interpretive repression model. DNA repression loop (arbitrary example length 111.5 bp) anchored by LacI (green; pdb code 1Z04) binding to upstream (cyan) and downstream (blue) operators is depicted at the apex of a negatively supercoiled plectoneme, in contrast to the conventional model in Figure 2A. A scale representation of RNA polymerase holoenzyme (red; PDB code 4IGC) is shown for promoter positions facing outward (A) or inward (B), emphasizing the impacts of template strain and steric hindrance on repression. Note that the DNA diameter is reduced for clarity (but see crystallographic DNA atoms shown at protein binding sites). Potential operator deformation by repressor has not been modeled here. Superhelical DNA parameters are discussed in Materials and Methods.

References

    1. Müller-Hill B. The lac Operon: a Short History of a Genetic Paradigm. Berlin: Walter de Gruyter; 1996.
    1. Jacob F., Monod J. Genetic regulatory mechanisms in the synthesis of proteins. J. Mol. Biol. 1961;3:318–356. - PubMed
    1. Gilbert W., Muller-Hill B. Isolation of the lac repressor. Proc. Natl. Acad. Sci. USA. 1966;56:1891–1898. - PMC - PubMed
    1. Schmitz A., Galas D.J. The interaction of RNA polymerase and lac repressor with the lac control region. Nucleic Acids Res. 1979;6:111–137. - PMC - PubMed
    1. Kramer H., Niemoller M., Amouyal M., Revet B., von Wilcken-Bergmann B., Müller-Hill B. lac repressor forms loops with linear DNA carrying two suitably spaced lac operators. EMBO J. 1987;6:1481–1491. - PMC - PubMed

Publication types

MeSH terms

LinkOut - more resources