

Seven-tesla time-of-flight angiography using a 16-channel parallel transmit system with power-constrained 3-dimensional spoke radiofrequency pulse design
- PMID: 24598439
- PMCID: PMC4392648
- DOI: 10.1097/RLI.0000000000000033
Seven-tesla time-of-flight angiography using a 16-channel parallel transmit system with power-constrained 3-dimensional spoke radiofrequency pulse design
Abstract
Objectives: Ultrahigh magnetic fields of 7 T or higher have proven to significantly enhance the contrast in time-of-flight (TOF) imaging, one of the most commonly used non-contrast-enhanced magnetic resonance angiography techniques. Compared with lower field strength, however, the required radiofrequency (RF) power is increased at 7 T and the contrast obtained with a conventional head transmit RF coil is typically spatially heterogeneous.In this work, we addressed the contrast heterogeneity in multislab TOF acquisitions by optimizing the excitation flip angle homogeneity while constraining the RF power using 3-dimensional tailored RF pulses ("spokes") with a 16-channel parallel transmission system and a 16-channel transceiver head coil.
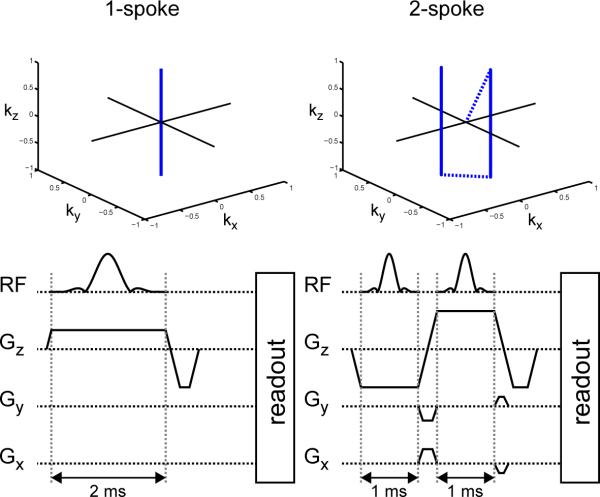
Materials and methods: We investigated in simulations and in vivo experiments flip angle homogeneity and angiogram quality with a same 3-slab TOF protocol for different excitations including 1-, 2-, and 3-spoke parallel transmit RF pulses and compared the results with a circularly polarized (CP) phase setting similar to a birdcage excitation. B1 and B0 calibration maps were obtained in multiple slices, and the RF pulse for each slab was designed on the basis of 3 calibration slices located at the bottom/middle/top of each slab, respectively. By design, all excitations were computed to generate the same total RF power for the same flip angle. In 8 subjects, we quantified the excitation homogeneity and the distribution of the RF power to individual channels. In addition, we investigated the consequences of local flip angle variations at the junction between adjacent slabs as well as the impact of ΔB0 on image quality.
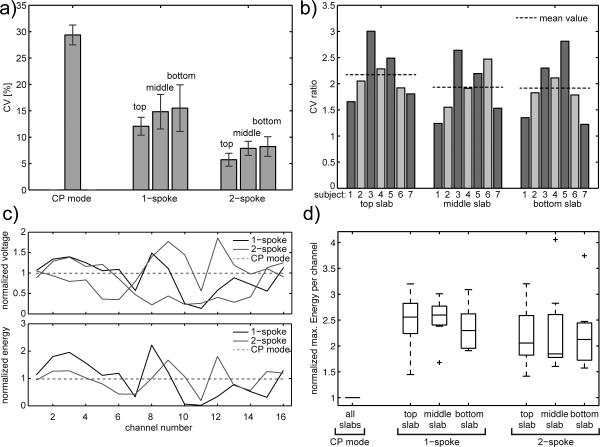
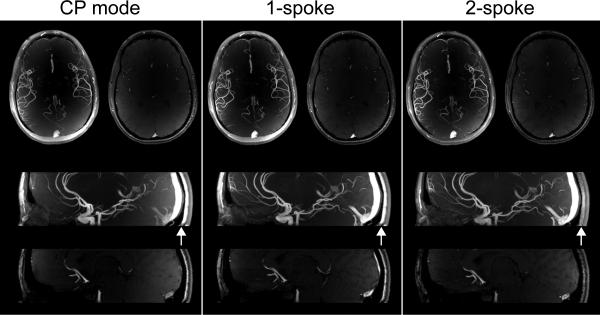
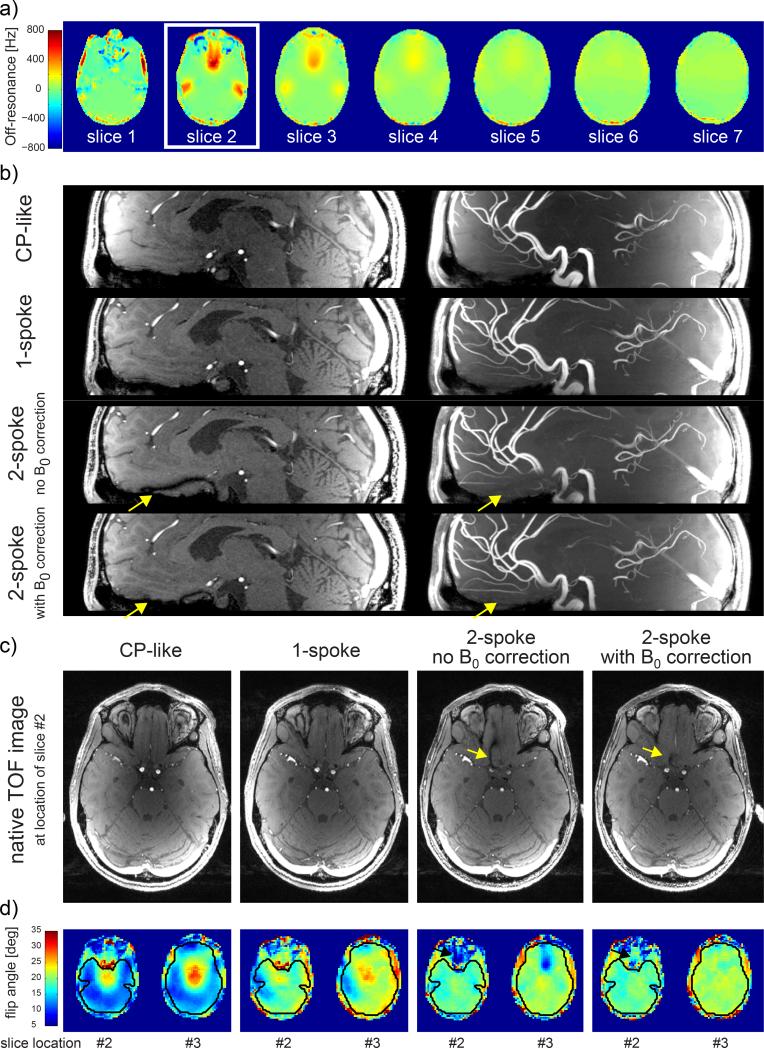
Results: The flip angle heterogeneity, expressed as the coefficient of variation, averaged over all volunteers and all slabs could be reduced from 29.4% for CP mode excitation to 14.1% for a 1-spoke excitation and to 7.3% for 2-spoke excitations. A separate detailed analysis shows only a marginal improvement for 3-spoke compared with the 2-spoke excitation. The strong improvement in flip angle homogeneity particularly impacted the junction between adjacent TOF slabs, where significant residual artifacts observed with 1-spoke excitation could be efficiently mitigated using a 2-spoke excitation with same RF power and same average flip angle. Although the total RF power is maintained at the same level than that in CP mode excitation, the energy distribution is fairly heterogeneous through the 16 transmit channels for 1- and 2-spoke excitations, with the highest energy for 1 channel being a factor of 2.4 (1 spoke) and 2.2 (2 spokes) higher than that in CP mode. In vivo experiments demonstrated the necessity for including ΔB0 spatial variations during 2-spoke RF pulse design, particularly in areas with strong local susceptibility variations such as the lower frontal lobe.
Conclusions: Significant improvement in excitation fidelity leading to improved TOF contrast, particularly in the brain periphery, as well as smooth slab transitions can be achieved with 2-spoke excitation while maintaining the same excitation energy as that in CP mode. These results suggest that expanding parallel transmit methods, including the use of multidimensional spatially selective excitation, will also be very beneficial for other techniques, such as perfusion imaging.
Figures


Similar articles
-
Time-of-flight angiography at 7T using TONE double spokes with parallel transmission.Magn Reson Imaging. 2019 Sep;61:104-115. doi: 10.1016/j.mri.2019.05.018. Epub 2019 May 17. Magn Reson Imaging. 2019. PMID: 31108151
-
Cardiac imaging at 7 Tesla: Single- and two-spoke radiofrequency pulse design with 16-channel parallel excitation.Magn Reson Med. 2013 Nov;70(5):1210-9. doi: 10.1002/mrm.24935. Epub 2013 Sep 10. Magn Reson Med. 2013. PMID: 24038314 Free PMC article.
-
High-resolution gradient-recalled echo imaging at 9.4T using 16-channel parallel transmit simultaneous multislice spokes excitations with slice-by-slice flip angle homogenization.Magn Reson Med. 2017 Sep;78(3):1050-1058. doi: 10.1002/mrm.26501. Epub 2016 Oct 23. Magn Reson Med. 2017. PMID: 27774641 Free PMC article.
-
Parallel Transmission for Ultrahigh Field MRI.Top Magn Reson Imaging. 2019 Jun;28(3):159-171. doi: 10.1097/RMR.0000000000000204. Top Magn Reson Imaging. 2019. PMID: 31188274 Free PMC article. Review.
-
Parallel magnetic resonance imaging.Neurotherapeutics. 2007 Jul;4(3):499-510. doi: 10.1016/j.nurt.2007.04.011. Neurotherapeutics. 2007. PMID: 17599714 Free PMC article. Review.
Cited by
-
Human Connectome Project-style resting-state functional MRI at 7 Tesla using radiofrequency parallel transmission.Neuroimage. 2019 Jan 1;184:396-408. doi: 10.1016/j.neuroimage.2018.09.038. Epub 2018 Sep 17. Neuroimage. 2019. PMID: 30237033 Free PMC article.
-
Brain imaging with improved acceleration and SNR at 7 Tesla obtained with 64-channel receive array.Magn Reson Med. 2019 Jul;82(1):495-509. doi: 10.1002/mrm.27695. Epub 2019 Feb 25. Magn Reson Med. 2019. PMID: 30803023 Free PMC article.
-
Comparison of RF body coils for MRI at 3 T: a simulation study using parallel transmission on various anatomical targets.NMR Biomed. 2015 Oct;28(10):1332-44. doi: 10.1002/nbm.3378. Epub 2015 Aug 30. NMR Biomed. 2015. PMID: 26332290 Free PMC article.
-
Towards high-resolution 4D flow MRI in the human aorta using kt-GRAPPA and B1+ shimming at 7T.J Magn Reson Imaging. 2016 Aug;44(2):486-99. doi: 10.1002/jmri.25164. Epub 2016 Feb 3. J Magn Reson Imaging. 2016. PMID: 26841070 Free PMC article.
-
Parallel transmission for ultrahigh-field imaging.NMR Biomed. 2016 Sep;29(9):1145-61. doi: 10.1002/nbm.3313. Epub 2015 May 19. NMR Biomed. 2016. PMID: 25989904 Free PMC article. Review.
References
-
- Kang CK, Park CW, Han JY, et al. Imaging and analysis of lenticulostriate arteries using 7.0-Tesla magnetic resonance angiography. Magn Reson Med. 2009 Jan;61(1):136–144. - PubMed
-
- von Morze C, Xu D, Purcell DD, et al. Intracranial time-of-flight MR angiography at 7T with comparison to 3T. J Magn Reson Imaging. 2007 Oct;26(4):900–904. - PubMed
-
- Heverhagen JT, Bourekas E, Sammet S, Knopp MV, Schmalbrock P. Time-of-flight magnetic resonance angiography at 7 Tesla. Invest Radiol. 2008 Aug;43(8):568–573. - PubMed
-
- Johst S, Wrede KH, Ladd ME, Maderwald S. Time-of-flight magnetic resonance angiography at 7 T using venous saturation pulses with reduced flip angles. Invest Radiol. 2012 Aug;47(8):445–450. - PubMed
Publication types
MeSH terms
Grants and funding
LinkOut - more resources
Full Text Sources
Other Literature Sources
Miscellaneous
